change/delete REPORT-#
Rare meson decays at the Tevatron
Walter Hopkins for the CDF and D0 Collaborations
Cornell University, Ithaca, NY 14853
Abstract
Rare meson decays are an excellent probe for beyond the Standard Model physics. Two very sensitive processes are the and decays. We report recent results at a center of mass energy of TeV from the CDF II and D0 collaborations using between 3.7 and 6.9 taken during Run II of the Fermilab Tevatron Collider.
PRESENTED AT
The Ninth International Conference on
Flavor Physics and CP Violation
(FPCP 2011)
Maale Hachamisha, Israel, May 23–27, 2011
1 decays
decays are flavor changing neutral current (FCNC) processes that can only occur through higher order box or penguin amplitudes in the Standard Model. New physics can be probed by measuring various combinations of their decay rates. One of the most sensitive observables is the forward-backward asymmetry of the muons () as a function of the squared di-muon mass.
Three decays of interest are , , and . The first two decays were observed at BaBar, Belle, and CDF. Belle found a 2.7 deviation for for [1]. We describe hre the CDF analysis that uses 4.4 of data [2].
1.1 Analysis Method
1.1.1 Branching Ratio Measurement
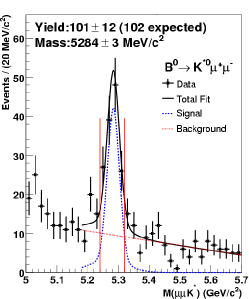
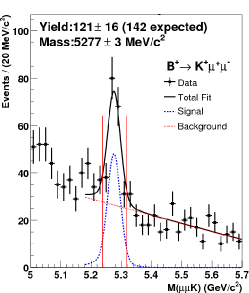
Branching ratios for , , and are measured relative to normalization modes, where the two muons originate from a decay. For the event reconstruction CDF requires two muons with a transverse momentum () greater than either 1.5 GeV/c or 2.0 GeV/c depending on the muon trigger. The three modes are then reconstructed where the is reconstructed from and the is reconstructed from . To avoid contamination from resonant modes such as the and , candidates with di-muon masses near these resonances are rejected.
The events then have to meet loose preselection requirements before an artificial neural network (NN), which combines multiple discriminating variables into one variable, is applied. Signal is modeled with -reweighted Pythia signal Monte Carlo simulations (MC). The reweighing is done by comparing the MC distribution with that of the normalization modes. The background is modeled by sampling the meson mass sideband regions. For the and modes there are significant physics backgrounds in the lower sideband region and thus only the higher sideband region between 5 and 15 (=20MeV/) above the known meson masses is used. For both lower and upper sidebands are used.
The final signal yield is obtained by an unbinned maximum likelihood fit to the meson mass distribution. The probability distribution function (PDF) of the signal is parametrized with two Gaussian with different means while the the background PDF is described by a first or second order polynomial. Peaking background contributions are subtracted from the fit results for the signal yields. The only significant peaking contribution is cross-talk among and which has a 1% contribution to the total observed signal MC yields. The final branching ratios are calculated as follows:
| (1) |
where signifies the , , or and represents , , or , and are the yields after the optimal NN, is the relative efficiency of the loose selection cuts, and is the NN cut efficiency on the loosely-selected events. The NN is not applied to the normalization mode because the signal/purity and size is sufficient with the loose selection cuts. The NN cut efficiency are obtained from signal MC.
The three leading systematics are the systematics on the efficiency, , and background PDF. The main sources within the efficiency systematic errors are the MC reweighing and the NN cut. The total systematics for the , , and are 9%, 7%, and 32%, respectively.
1.1.2 Forward-Backward Asymmetry Measurement
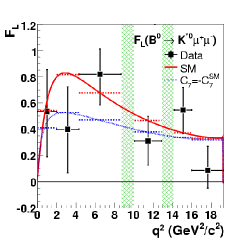
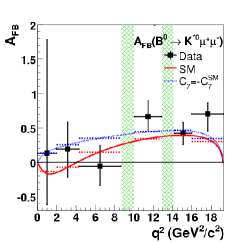
For the decay the forward-backward asymmetry () as well as the longitudinal polarization () are measured. These are extracted from , the cosine of the helicity angle between the () momentum vector and the opposite of () meson momentum vector in the di-muon rest frame, and , the cosine of the angle between kaon momentum and the opposite of the meson momentum vector in the rest frame. B decay amplitudes are calculated using operator product expansion and Wilson coefficients. There are many non-SM predictions for from models with different Wilson coefficients [3].
and are extracted using a unbinned maximum likelihood fit containing mass shape signal and background PDF’s as well as signal and background angular shape PDF’s. The mass shape PDF’s are divided into several di-muon mass bins and are described as 25 bin histograms. The combinatorial background PDF is taken from the meson higher sideband. The angular acceptances are also described as 25 bin histograms and are derived from phase space signal MC.
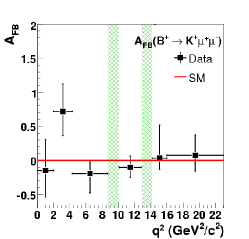
As a control and are fitted to and only to . This cross check yielded measurements that were consistent with other measurements.
The systematic uncertainties for the measurement in are dominated by a fit bias ranging between 2% and 7% for the different di-muon mass bins. This bias affects teh estimates of or when the true value of these quantities are close to physical boundaries. The lowest di-muon mass bin also has a significant contribution from the angular efficiency systematic (5%) attained from changing the binning of the angular acceptance histograms. The total of all the systematics ranges between 2% and 8% for the different di-muon mass bins.
For the measurement in the dominant systematic uncertainties are the angular efficiency, fit bias, and the statistical uncertainty from the fit. The fit systematic comes from varying by where is the statistical error from the fit. The total systematic errors range is 1%-10%.
The most significant systematic uncertainties in the measurement for is given by the angular efficiency and angular background. Angular background is estimated from the higher mass sideband. The systematic is estimated by changing the sideband region. The total systematic uncertainty ranges between 3% and 8% for the different di-muon mass bins.
1.2 Results
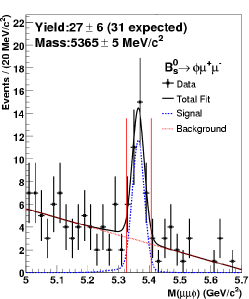
The resulting yield for the three decays are shown in Figure 1. All measured branching ratios agree with previous measured values as well as theoretical predictions. CDF reports the first observation of with a significance of and a measured branching ratio of [stat][syst].
The results of the polarization and forward-backward asymmetry measurement shown in Figure 2 ( for is shown as a cross check) may contribute to contrain several beyond SM physics models. They are compatible and competitive with the results from the B-factories [1], [4], [5].
2 decays
are FCNC decays that are highly suppressed by the SM. The SM predictions for these branching fractions are and [6]. These predictions are one order of magnitude smaller than the current experimental sensitivity. Previous bounds from the CDF collaboration, based on 3.7 of integrated luminosity, are and at C.L. [7]. D0 bounds were previously set at at C.L. using 6.1 of data [8]. LHCb bounds of and at C.L were recently set using 37 of data
Enhancements to the rate of decays occur in a variety of different new-physics models. In supersymmetric (SUSY) models, new particles can increase by several orders of magnitude at large . In the minimal supersymmetric standard model (MSSM), the enhancement is proportional to . Global analysis including all existing experimental constraints suggest that the large region is of interest [10, 11, 12]. For large , this search is one of the most sensitive probes of new physics available at the Tevatron experiments. In contrast, SUSY R-parity violating models [10] and non-minimal flavor violating models [13] can both enhance and separately even at low . In the absence of an observation, limits on are complementary to those provided by other experimental measurements, and together would constrain the allowed supersymmetric parameter space.
This document describes current status from D0 and CDF, as well as the planned updated analysis by CDF.
2.1 Analysis Method
Both CDF and D0 collect opposite sign muon candidate events using di-muon triggers.
events are collected on the same triggers as a relative normalization mode to estimate as:
| (2) |
where is the number of candidate events, is the geometric and kinematic acceptance of the di-muon trigger for decays, is the total efficiency (including trigger, reconstruction and analysis requirements) for events in the acceptance, with , , and similarly defined for decays. The ratio accounts for the different -quark fragmentation probabilities and is , including the (anti-)correlation between the uncertainties [14]. The final two terms are the relevant branching ratios [14].
The CDF analysis described is also sensitive to decays. The value of is estimated from Equation 2 substituting for , and changing to . All other aspects are the same as the search except where noted below. The analysis is done by first estimating the acceptances and efficiencies, then creating a multivariate discriminant for background rejection. This discriminant is optimized with Pythia signal MC and data mass sideband and validated with the normalization. The background is then estimated, which has two sources: combinatorial background and peaking background (B). Finally when the background is well understood the signal region is unblinded.
2.2 Signal and Background Properties
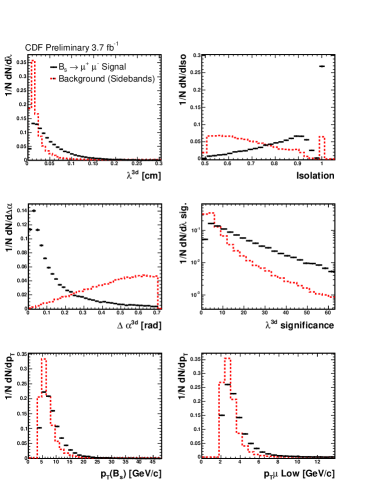
The signal candidates are fully reconstructed events with a secondary vertex due to the long lifetime (m) of the meson. Signal events will have a primary-to-secondary vertex vector that is aligned with the candidate momentum vector (Figure 3). Another property of signal events that is unique is that they are very isolated (with few tracks near the muon tracks) due to the hard B fragmentation.
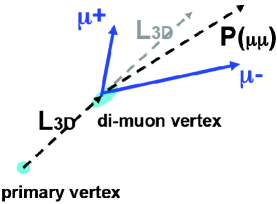
Background events tend to be partially reconstructed and be shorter lived than signal. They also have a softer spectrum, higher activity of tracks, and misaligned primary-to-secondary vertex and momentum vectors. The combinatorial background consists of sequential semi-leptonic decay () and and double semi-leptonic decay (). The expected number of combinatorial background events in the signal window is estimated by extrapolating the number of events in the sideband regions to the signal window using a first order polynomial fit.
The peaking background from two-body hadronic decays is also evaluated. These backgrounds are about a factor ten smaller than the combinatorial background and need to be estimated separately. The dominant sources of background are the decays of and to final states, where or can be either or and are misreconstructed (fake muons).
2.3 CDF Analysis with 3.7 of Data
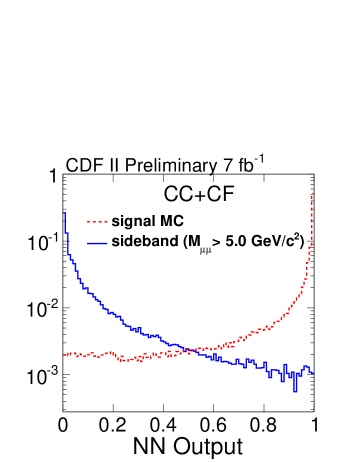
2.3.1 Signal Discrimination
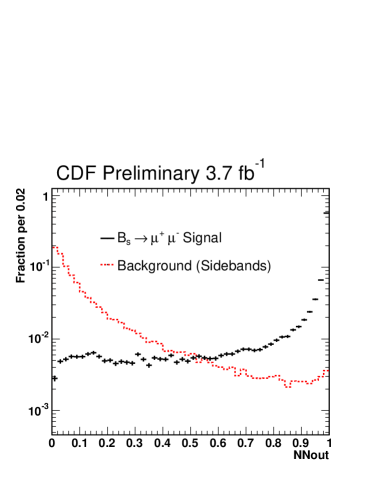
Six variables are used for the signal discrimination (Figure 4). Three of the variables are secondary vertex variables. These variables are combined in an artificial neural network which is optimized with signal MC and data mass sidebands (Figure 4, left). The NN output is then divided into three bins while the di-muon mass is split into 5 mass bins for limit calculation.
- :
-
the proper decay length;
- :
-
the 3D opening angle between the flight direction, , and the direction of the decay vertex - estimated as the vector originating at the primary vertex and terminating at the muon-pair vertex;
- :
-
the isolation of the candidate defined as , where the sum is over all tracks within an cone of radius , centered on ;
- :
-
proper decay length significance ( divided by the uncertainty on );
- :
-
the transverse momentum of the candidate;
- :
-
the transverse momentum of lower momentum daughter muon.
2.3.2 Control Samples for Combinatorial Background Estimates
CDF cross checked the background estimate procedure on four independent background samples:
- OS-:
-
opposite-sign muon pairs, which pass the baseline and vertex cuts and have a negative lifetime;
- SS+:
-
same-sign muon pairs, which pass looser baseline and vertex cuts and have a positive lifetime;
- SS-:
-
same-sign muon pairs, which pass looser baseline and vertex cuts and have a negative lifetime;
- FM+-:
-
opposite-sign fake-muon pairs, at least one leg of which is required to fail the muon ID requirement, passing looser baseline and vertex cuts for both positive and negative lifetimes.
These are representative of various background contributions and thus are excellent control regions to test the method of background estimation. We compare the estimated background with actual observation. The result of this cross check is summarized in Table 1. The agreement between predicted and observed number of background events in the signal region is good across all of our control regions. The backgrounds were estimated using the same method as for the signal sample.
| CMU-CMU | CMU-CMX | ||||||
|---|---|---|---|---|---|---|---|
| sample | cut | pred | obsv | prob(%) | pred | obsv | prob(%) |
| 26 | 39 | ||||||
| OS- | 46 | 3.2 | |||||
| 36 | 0.4 | ||||||
| 29 | 10 | ||||||
| SS+ | 34 | 66 | |||||
| 55 | - | ||||||
| 49 | 11 | ||||||
| SS- | 36 | 34 | |||||
| 43 | 70 | ||||||
| 50 | 19 | ||||||
| FM+ | 9 | 49 | |||||
| 48 | 53 | ||||||
2.3.3 Results
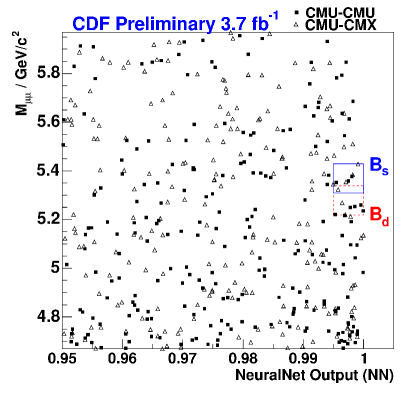
The results from the CDF analysis on 3.7 are shown in Table 2 and Figure 5. events were expected in the signal region and 7 events were observed, resulting in the observed limits, using 3 NN bins and 5 mass bins, shown in Table 2.
| Channel | Expected | Observed |
|---|---|---|
| Central | 4.01.0 | 3 |
| Extended | 2.10.8 | 4 |
| Central | 5.31.0 | 5 |
| Extended | 2.80.8 | 3 |
| 90% CL | 95% CL | |
|---|---|---|
| 3.6 | 4.3 | |
| 6.0 | 7.6 |
2.4 D0 Analysis with 6.1 of Data
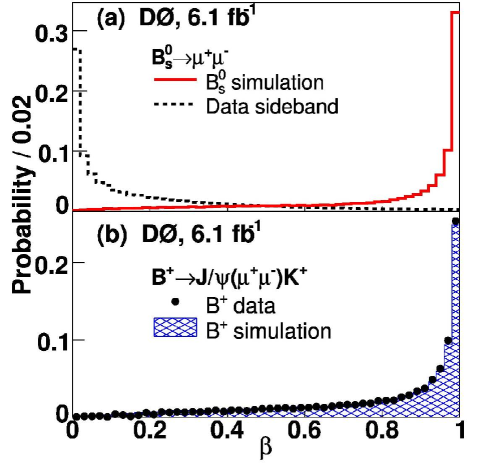
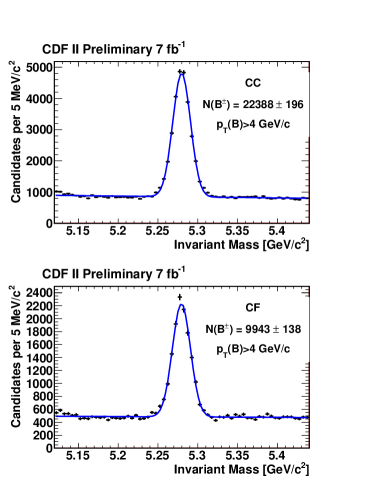
D0 uses a similar method as described above. For signal discrimination, variables are combined into a Bayesian Neural Network that also uses signal MC and data mass sidebands for optimization (Figure 6). Unlike CDF, D0 does not have the mass resolution to distinguish between and .
The D0 results are shown in Figure 7. 514 background events are expected in the highest sensitivity region and 55 events are observed. The expected limit is at 95% CL observed a limit of 5.1.
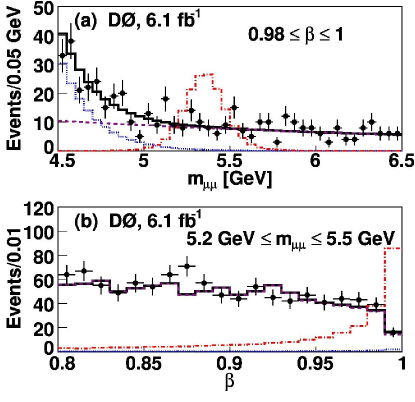
.
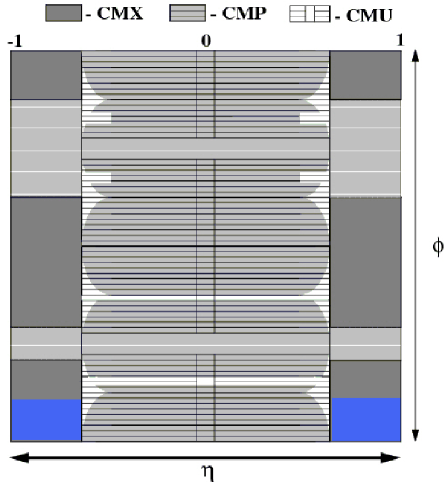
2.5 CDF Improvements
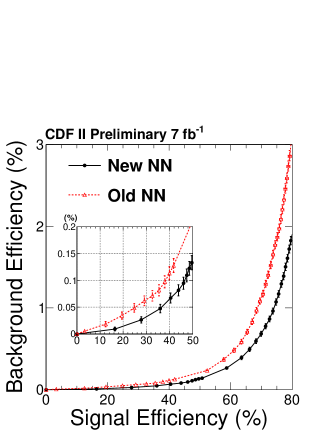
CDF is working on an improved analysis with significantly more (3.2 ) data. The forward muon acceptance (left of Figure 8) has been increased and the neural network has been improved to achieve greater background rejection. The peaking background prediction has also been improved. The central-forward (CMU-CMX) channel of the analysis has increased in statistics by 15% resulting in a total increase for both channels of 7%. The neural network has been improved by increasing the background rejections (Figure 9). Additionally the neural network has been extensively tested for mass bias (Figure 10).
The following variables, shown in order of significance to NN separation power, are used to discriminate the signal from the background:
- :
-
the 3D opening angle between the flight direction, , and the direction of the decay vertex - estimated as the vector originating at the primary vertex and terminating at the muon-pair vertex;
- :
-
the isolation of the candidate defined as, , where the sum is over all tracks within an cone of radius , centered on ;
- :
-
impact parameter of muon which has the larger value of the muon pair;
- :
-
impact parameter of reconstructed from muon pair;
- :
-
significance of ;
- :
-
of the vertex;
- :
-
3-dimensional vertexes displacement obtained by the vertex fitting;
- :
-
the transverse momentum of lower momentum daughter muon;
- :
-
Significance of smaller of the muon with smaller impact parameter, where is estimated uncertainty of ;
- :
-
proper decay length significance ( divided by the uncertainty on );
- :
-
the proper decay length;
- :
-
significance of larger of the muon with larger impact parameter, where is estimated uncertainty of ;
- :
-
the 2D opening angle between the flight direction, , and the direction of the decay vertex - estimated as the vector originating at the primary vertex and terminating at the muon-pair vertex;
- :
-
impact parameter of muon which has the smaller value of the muon pair.
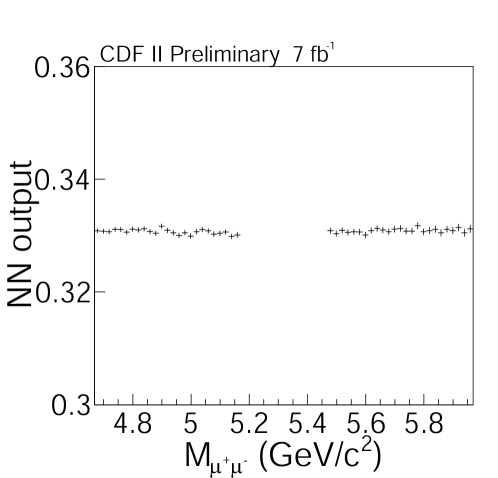
The final NN network consists of 14 input variables. Extensive cross checks were done to demonstrate the 14-variable network does not sculpt the di-muon invariant mass distribution. Figure 10 shows the correlation across the mass range. No significant correlations are seen.
2.6 Expected Limits for CDF
A comparison of the previous expected and observed limits is shown in Table 3. The expected limit after including the new data set, the increased acceptance, and the NN improvements is about .
| Expected | Observed | |
|---|---|---|
| 4.9 | 5.8 | |
| 3.3 | 4.3 | |
| - |
3 Conclusion
FCNC’s are powerful probe for New Physics and CDF and D0 continue to lead the searches in the B sector. CDF is updating their analysis which will significantly improve the expected limit for . CDF also has the first observation of as well as a measurement that competes and agrees with the B-factory results. Shortly after the FPCP conference CDF updated both the and analysis [15, 2, 16].
References
- [1] J. T. Wei, et al. (BELLE Collaboration), Phys. Rev. Lett. 103, 171801 (2009).
- [2] T. Aaltonen et al. (CDF Collaboration), et al., arXiv:1108.0695v1 [hep-ex]
- [3] K. G. Wilson, Phys. Rev. 179, 1499 (1969).
- [4] B. Aubert, et al. (BABAR Collaboration), Phys. Rev. D 79, 031102 (2009).
- [5] B. Aubert, et al. (BABAR Collaboration), Phys. Rev. Lett. 102, 091803 (2009).
- [6] A. Buras, B. Duling, T. Feldmann, T. Heidsieck, C. Promberger, S. Recksiegel, J. High Energy Phys. 1009, 106 (2010) .
- [7] CDF Collaboration, et al., A Search for Decays Using of Data, CDFNOTE 9860.
- [8] V. M. Abazov, et al., Phys. Lett. B 693, 539 (2010)
- [9] S. R. Choudhury and N. Gaur, Phys. Lett. B 451, 86 (1999); K. S. Babu and C. Kolda, Phys. Rev. Lett. 84, 228 (2000).
- [10] R. Arnowitt et al., Phys. Lett. B 538, 121 (2002).
- [11] S. Baek et al., J. High Energy Phys. 0506, 017 (2005).
- [12] R. Ruiz de Austri et al., J. High Energy Phys. 0605, 002 (2006); J. Ellis et al., J. High Energy Phys. 0605, 063 (2006).
- [13] P. H. Chankowski and J. Rosiek, Acta Phys. Pol. B 33, 2329 (2002).
- [14] K. Nakamura et al. (Particle Data Group), J. Phys. G 37, 075021 (2010).
- [15] T. Aaltonen et al. (CDF Collaboration), arXiv:1107.2304v1 [hep-ex]
- [16] T. Aaltonen et al. (CDF Collaboration), arXiv:1107.3753v1 [hep-ex]