Radio observations of Circinus X-1 over a complete orbit at an historically faint epoch
Abstract
We present results from the first radio observations of a complete orbit ( 17 days) of the neutron star X-ray binary Circinus X-1 using the Australia Telescope Compact Array Broadband Backend, taken while the system was in an historically faint state. We have captured the rapid rise and decline of a periastron passage flare, with flux densities for 9 days prior to the event stable at 1 mJy at 5.5 GHz and 0.5 mJy at 9 GHz. The highest flux densities of 43.0 0.5 mJy at 5.5 GHz and 29.9 0.6 mJy at 9 GHz were measured during the flare’s decline (MJD 55206.69) which continues towards pre-flare flux densities over the following 6 days. Imaging of pre-flare data reveals steady structure including two stable components within 15 arc-seconds of the core which we believe may be persistent emission regions within the system’s outflows, one of which is likely associated with the system’s counter-jet. Unlike past observations carried out in the system’s brighter epochs, we observe no significant structural variations within 3 arc-seconds of the core’s position. Model subtraction and difference mapping provide evidence for variations slightly further from the core: up to 5” away. If related to the observed core flare, then these variations suggest very high outflow velocities with 35, though this can be reduced significantly if we invoke phase delays of at least one orbital period. Interestingly, the strongest structural variations appear to the north west of the core, opposite to the strongest arcsec-scale emission historically. We discuss the implications of this behaviour, including the possibility of precession or a kinked approaching jet.
keywords:
binaries: close – stars: individual, Circinus X-1 – ISM: jets and outflows – X-rays: binaries1 Introduction
| Date | MJD | MJD | Total | F5.5 [range] | Noise 5.5 | F9 [range] | Noise 9 |
|---|---|---|---|---|---|---|---|
| (UT) | start | end | time (h) | (mJy beam-1) | (Jy beam-1) | (mJy beam-1) | (Jy beam-1) |
| 2009 Dec 30 | 55195.745 | 55196.055 | 6.50 | 0.89 0.08 [0.72:1.06] | 9.7 | 0.58 0.11 [0.39:0.77] | 13.7 |
| 2009 Dec 31 | 55196.707 | 55197.056 | 6.91 | 1.16 0.11 [0.88:1.42] | 12.9 | 0.75 0.10 [0.66:1.01] | 24.0 |
| 2010 Jan 01 | 55197.756 | 55198.057 | 6.29 | 0.67 0.15 [0.47:0.94] | 14.5 | 0.41 0.14 [0.32:0.72] | 30.3 |
| 2010 Jan 02 | 55198.704 | 55199.076 | 5.82 | 0.99 0.07 [0.87:1.10] | 10.8 | 0.60 0.08 [0.51:0.77] | 15.5 |
| 2010 Jan 04 | 55200.706 | 55201.181 | 9.91 | 0.89 0.08 [0.73:1.10] | 8.6 | 0.55 0.09 [0.39:0.73] | 11.1 |
| 2010 Jan 05 | 55201.703 | 55202.162 | 9.43 | 0.77 0.17 [0.37:0.91] | 9.0 | 0.41 0.18 [0.18:0.72] | 11.8 |
| 2010 Jan 06 | 55202.703 | 55203.160 | 7.15 | 0.49 0.12 [0.29:0.78] | 11.1 | 0.25 0.06 [0.18:0.40] | 13.3 |
| 2010 Jan 07 | 55203.682 | 55204.148 | 9.51 | 0.58 0.11 [0.41:0.79] | 9.1 | 0.33 0.10 [0.22:0.58] | 12.1 |
| 2010 Jan 08 | 55204.687 | 55205.163 | 9.43 | 0.59 0.10 [0.44:0.75] | 9.1 | 0.30 0.09 [0.17:0.50] | 12.1 |
| 2010 Jan 09 | 55205.681 | 55206.157 | 9.41 | 0.93 0.42 [0.42:6.67] | 9.8 | 0.93 0.65 [0.23:9.83] | 12.2 |
| 2010 Jan 10 | 55206.683 | 55207.162 | 10.03 | 21.3 8.81 [11.7:43.0] | 38.4 | 16.6 6.10 [6.57:29.9] | 43.0 |
| 2010 Jan 11 | 55207.684 | 55208.139 | 9.53 | 9.23 1.33 [7.60:11.3] | 20.5 | 6.11 1.26 [2.64:6.21] | 25.4 |
| 2010 Jan 12 | 55208.661 | 55209.150 | 10.19 | 5.48 0.80 [2.05:5.61] | 16.5 | 4.02 0.69 [0.96:3.65] | 18.3 |
| 2010 Jan 13 | 55209.685 | 55210.153 | 7.46 | 3.72 0.51 [2.48:3.96] | 15.6 | 3.19 0.21 [0.97:2.31] | 20.1 |
| 2010 Jan 14 | 55210.672 | 55211.142 | 9.71 | 2.37 0.21 [1.61:2.35] | 10.4 | 2.39 0.13 [0.99:1.43] | 12.8 |
| 2010 Jan 15 | 55211.665 | 55212.072 | 8.22 | 1.54 0.11 [1.32:1.79] | 9.9 | 0.91 0.12 [0.75:1.08] | 14.7 |
Circinus X-1 (Cir X-1) is a peculiar X-ray binary (XRB) system known for its regular outbursts occurring every 16.6 days. These events are believed to be caused by a highly eccentric orbit, wherein the periastron passage results in an increased level of accretion onto the compact object (Murdin et al. 1980; Nicolson, Glass & Feast 1980). These outbursts are visible at multiple wavelengths, including X-ray (Tennant, Fabian & Shafer 1986), IR (Glass 1978) and radio (Whelan et al. 1977). Discovered in 1971 (Margon et al. 1971), the system was initially classified as a black hole candidate due to X-ray spectral and timing similarities to Cygnus X-1, including millisecond variability (Toor 1977). However, a reclassification was necessary after the discovery of type I X-ray bursts in 1985 which indicated a neutron star (NS) primary (Tennant, Fabian & Shafer 1986), though none had been seen again until May 2010, when the NS host was confirmed by RXTE detection of bursts (Linares et al. 2010). Though the system is often classified as a low mass XRB, the nature of the companion star remains under debate, with the possibility of it being a 3 - 5 sub-giant (Johnston, Fender & Wu 1999) or even a super-giant up to 10 (Jonker, Nelemans & Bassa 2007).
Cir X-1 also challenges normal NSXRB classification in that it shows X-ray behaviour reminiscent of both atoll (Oosterbroek et al. 1995) and Z-source classes (Shirley, Bradt & Levine 1997), as well as behaviour that defies either classification in orbital phases prior to periastron (Soleri et al. 2009a). This divide is likely related to variations in accretion rate, , onto the neutron star during its orbit, much like the different behaviours observed from XTE J1701-462 which have been linked to changes in over time (Homan et al. 2007).
Low-frequency radio images reveal an extensive jet-powered nebula surrounding Cir X-1 (Stewart et al. 1993, Tudose et al. 2006). Early ‘runaway binary’ theories, which suggested the system was associated with nearby supernova remnant G321.9-0.3 (Clark, Parkinson & Caswell 1975) were supported by the existence of a tail-like structure extending from the southern end of Cir X-1’s nebula. However, observations with the revealed little or no proper motion, reducing the likelihood of such an origin (Mignani et al. 2002).
Nearby (arcsec) ejecta, presumably previously expelled from Cir X-1, were found to brighten in the radio after flare events, suggesting re-energisation by highly relativistic invisible outflows with 15 (assuming association with the flare immediately preceding the change: Fender et al. 2004) and inclination angles close to the line of sight ( 5∘). Cir X-1 was the second (after Sco X-1) neutron star system to show evidence of such invisible relativistic outflows. The implied velocities make the jets from Circinus X-1 some of the fastest in our Galaxy. These calculations assume a distance to the source of 6.5 kpc as put forward by Stewart et al. (1993), but that also serves as a compromise between the more recent estimates of Jonker & Nelemans (2004: 7.8 - 10.5 kpc) and Iaria et al. (2005: 4.1 kpc). The jets themselves are resolved on arc-second scales in X-rays (Heinz et al. 2007, Soleri et al. 2009b) and arc-second to arc-minutes in radio (Stewart et al. 1993, Tudose et al. 2006), with the jets appearing curved on the larger scales. X-ray shocks, believed to be caused by jet impacts, have also been observed (Sell et al. 2010). There have been suggestions of jet precession occurring within the system, based on conflicting estimates for the inclination of the outflows (Iaria et al. 2008: 90∘).
Between 1997 and 2002 Cir X-1 had been growing steadily fainter in the X-rays, and though radio flare events were known to reach 1 Jy in the 1970s (Haynes et al. 1978) they too had been in decline, reaching at most 10s of mJy by the 2000s (Fender, Tzioumis & Tudose 2005). Some renewed radio activity, similar to that observed in the 70s and 80s, occurred in 2006 (Nicolson 2007) but was followed by a return to minimal activity; a historically faint period during which our observations were taken. The observations and results discussed herein were taken during this most recent faint period. The system entered a relatively active phase in mid 2010 (a few months after our observations), with X-ray flares reaching hundreds of mCrab (Nakajima et al. 2010) and radio flares 0.1 Jy (Calvelo et al. 2010). Continued X-ray monitoring has shown the system intermittently returning to a low activity level for several months, much like that during which our observations were taken, and then undergoing another period of intense flaring. Thus, it seems these epochs of ‘low’ activity are punctuated by short but distinct flaring episodes, which appear to be extreme examples of the periastron events.
2 Observations & Data Reduction
Our goal was to monitor Cir X-1 over a complete orbital period using the Australia Telescope Compact Array - Compact Array Broadband Backend (ATCA-CABB), with the hope of catching the flare in significant detail as well as its subsequent decline, and additionally, to see if the structure of the source varied in any way around an orbit (Moin et al. (2011) recently carried out a similar campaign on milli-arcsecond scales with eVLBI but were only able to detect the source shortly after periastron). Furthermore, with the Monitor of All-sky X-ray Image (MAXI: Matsuoka et al. 2009) monitoring the system in X-rays, we would be able to simultaneously compare a flare event in the two bands.
By continuing to observe after the flare we would be able to capture any variation in ejecta luminosities caused by unseen relativistic jets, or perhaps even the jets themselves. However, given the observation time available post-flare ( 6 days), an assumed object distance of 6.5 kpc and a maximum image resolution of 1.5”, we would only be able to observe flows with minimum 9.5. Therefore, if we hope to observe the effects of flows related to our predicted flare we would require flow velocities similar to those implied by Fender et al. 2004. This does not prevent us from observing structural variations at any point during the run which might arise as a result of ejections from earlier events.
2.1 Radio
Observations of Cir X-1 were carried out on 2009 Dec 30, 31, 2010 Jan, 01, 02, 04, 05, 06, 07, 08, 09, 10, 11, 12, 13, 14 and 15 using the ATCA-CABB in 6A configuration (minimum baseline of 337m, maximum of 5939m) at both 5.5 GHz and 9 GHz (see Table 1). PKS J0825-5010 (PKS B0823-500) was used as the primary flux and bandpass calibrator when ever possible, with PKS J1939-6342 (PKS B1934-638) used in a few cases. Phase calibration was carried out using PMN J1515-5559 (PKS B1511-55) for the first half of the observations until it was noticed that on-screen levels indicated polarisation (5-10%) of the source, at which point PMN J1524-5903 (PKS B1520-58) was made the phase calibrator, with some days including observations of both phase calibrators to allow us to eliminate the slight polarisation effect during analysis. Observation times varied between 8 and 12 hour runs each day (predicted RMS noise between 8 and 6 Jy at 5.5 GHz and between 10 and 8 Jy at 9 GHz), for a total of 135 hours on the source. Deconvolution was carried out using a combination of MFCLEAN (multi-frequency: Sault and Wieringa 1994) and original CLEAN (Högbom 1974) subroutines. All data and image processing was carried out in MIRIAD (Sault, Teuben and Wright 1995).
3 Analysis & Results
3.1 Flare event
Using the ephemeris detailed in Nicolson 2007 (ATEL #985) we predicted a flare would occur near 2010 Jan 11. Observations from 2009 Dec 30 through to 2010 Jan 09 indicated Circinus X-1 was relatively stable at flux densities of 1 mJy at 5.5 GHz, and slightly lower at 9 GHz (for a list of average daily flux densities see Table 1). A sudden rise in flux density was detected towards the end of a day’s observations at 2010 Jan 10 02:30 UT, continuing until scheduled time ended at 03:50. Upon returning to the source 12.5 hours later, we found Cir X-1 in decline, indicating we had missed the peak of the outburst.
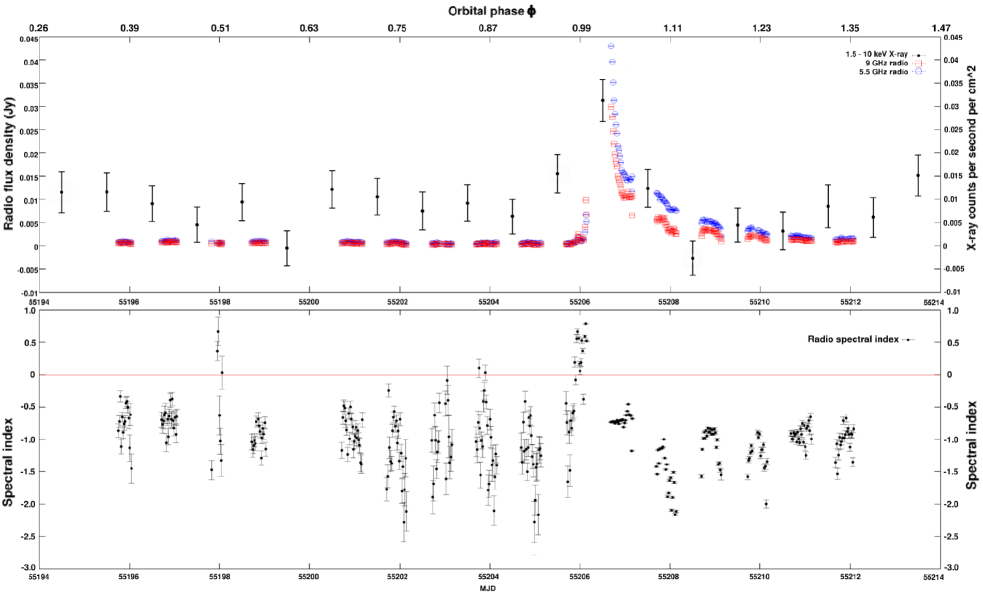
To better analyse the flare we divided data-sets from each day into smaller cuts ( 30 minutes), produced images from these cuts, and used the miriad command IMSTAT to measure the maximum flux density within a 1010 arc-sec2 box around the system’s previously established position (15:20:40.9 -57:10:00; based on image fitting from Tudose et al. 2008: tables A1 & A2); i.e. the system’s ‘core’ from which we observe the highest levels of radio emission. This allowed us to create a detailed light curve (Figure 1) while maintaining an acceptable level of error on each measurement.
The flare event (shown in more detail in Figure 2) appears to start at MJD 55206.05, rising from pre-flare levels of 1 mJy to S5.5 6.5 mJy and S9 10 mJy in just under 2 hours, before the day’s observations finally ended. Though some variations in flux densities are visible in pre-flare day light curves (a scatter of 0.5 mJy visible in most) they do not follow any obvious trend. However, the light curve from the day of the flare shows a gradual rise in flux density prior to the event, with levels at the start of the run 0.5 mJy. There is also a brief peak in flux density at both frequencies at MJD 55205.97 (2 hours prior to the flare - more easily visible in Figure 2), about one hour in duration. Observations the following day began at MJD 55206.683; the initial flux densities of S5.5 = 43.0 0.5 mJy and S9 = 29.9 0.6 mJy proceeded to decay rapidly (roughly power law decay: log S9GHz -3.03(log T) - 2.12 at 9 GHz, log S5.5GHz -3.03(log T) - 1.96, where T is days since outburst start i.e. MJD - 55206.05) before appearing to level off at S5.5 15 mJy and S9 11 mJy near MJD 55207. Subsequent days show continued decay (once again a rough power law: log S9GHz -1.4(log T) - 1.9, log S5.5GHz -1.6(log T) - 1.6) up to the final day of observations where flux densities remained above pre-flare levels: S5.5 1.5 mJy and S9 1.0 mJy. MAXI X-ray measurements (also shown in Figure 1) indicate a flare occurred at, or just before, the time of the radio event, with statistical errors and the lack of a radio peak preventing us from comparing the events to any greater degree.
There is little or no evidence of a turnover in flux densities either side of the flare, suggesting the peak of the event occurred towards the middle of the gap between observations (i.e. MJD 55206.5) at both frequencies. Our event appears to differ from previous flares (e.g. 2000 Oct 20/21 and 2002 Dec 04/05; Figure 6 of Tudose et al. 2008) in a variety of ways. Firstly, our event’s ‘peak’ (estimated to last from initial rise to the levelling off observed the next day) has a duration of almost a full day, compared to the 2000 Oct 20 flare light curve whose peak appears to last less than a third of that time. Secondly, our flare’s rise is significantly steeper than many observed in the past; 6 increase in 2 hours at 5.5 GHz and 10 at 9 GHz, compared to the rise observed in 2002 Dec 04 where levels only doubled over half a day. However, the light curve following the 2002 Dec event does reveal a similar gradual decline post flare (the 2000 Oct 20 light curve might also show the start of a similar decay trend, but is cut short). Such comparisons are difficult to justify, as Circinus X-1 was consistently far brighter in the former epochs than that during which our observations were carried out. As a result, we can only crudely estimate the peak of the flare to have a flux density between 0.05 and 0.1 Jy at both frequencies, based on extrapolations of the initial rise and decay rates.
The lower sections of Figures 1 and 2 show the spectral index (S) of Cir X-1’s core, based on the 5.5 GHz and 9 GHz flux densities. Indices remain negative for most of the pre-flare period, with an average value of 1.0 but with significant scatter ( = 0.45) and statistical errors. This is, as expected, indicative of optically thin synchrotron emission, and consistent with previous measurements of Cir X-1’s spectral index (e.g. Fig 10, Tudose et al. 2008). There does appear to be a rise to positive indices near MJD 55198, which would correspond to phase 0.5 (based on current ephemeris estimates). However, the day’s data (2010 Jan 01/02) to which the points correspond, was particularly difficult to calibrate, making the flux densities unreliable. This effect might initially suggest an apastron radio flare (Fender 1997, Tudose et al. 2008), but it is more likely that the positive index is a result of errors and not a real physical effect.
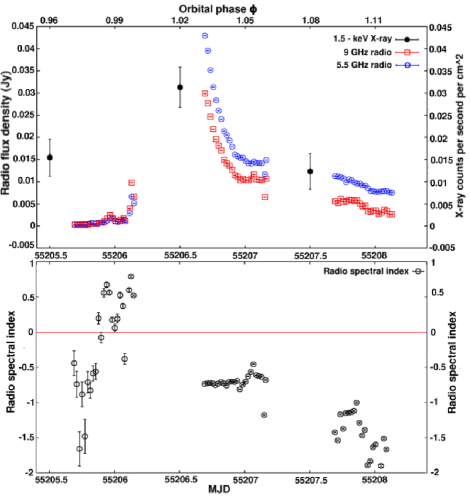
The spectral index begins a clear rise on the day of the flare, reaching 0.5 twice during the days observations, firstly during times concordant with the ‘bump’ 2 hours prior to the flare, and then towards the end of observations with the rise of the flare itself. By the following day, during flare decline, spectral index has returned to negative values, = 0.70.1, with very little scatter. Subsequent days show increasing levels of error and scatter as values decline.
The behaviour of the light curves and radio spectrum are consistent with that expected from either internal shocks created within outflows as a result of quasi-continuous ejections (i.e. jet flows with higher velocities during flares impacting with older slower upstream flows: Kaiser, Sunyaev and Spruit 2000) or an adiabatic expansion of ejected clouds of relativistic particles (as in van der Laan 1966), as is the case for nearly all outbursts from XRBs. If we were dealing with such expanding knots of emission, one could expect these objects to eventually move a sufficient distance from the core to be resolved separately, which we do not observe. Such objects might still exist as part of the core emission, but if their velocities are far lower than those of the flows discussed in Fender et al. 2004, then there may not be sufficient time after outburst to directly observe the separation before the knots fade below detectable levels. Crude estimations of the velocities possible for this scenario can be calculated based on image synthesised beam size ( 1.5” for a 12 hour 9GHz CABB image) and the total time taken for core flux densities to stabilise after the flare ( 6 days). Taking an assumed jet inclination of 5∘, and half the beam size as a required minimum distance for detectable change in the core structure, we find that such objects could remain unresolved if moving with Lorentz factors that do not exceed 5. This does not eliminate the possibility of ultra-relativistic flows re-energising media further downstream, since internal shocks can fade only to reignite during additional collisions (e.g. XTE J1748-288: Hjellming et al. 1998).
As mentioned earlier, flux densities actually appear to level off towards the end of Jan 10 before commencing the gentler decay. There have been several examples of multi-peaked flares from Cir X-1 in the past (Thomas et al. 1978, Tudose et al. 2008) with varying numbers of peaks and timescales, but the gaps in our observations prevent us from confirming such behaviour.
There is an unfortunate effect visible in the light curve, which becomes more apparent in the spectral index plot, and that is a trend towards more negative (and lower flux densities) towards the beginning and end of each run, particularly when the source is brighter (i.e. post-flare); this is most easily seen in the observations around MJD 55209. The effect is likely a result of Cir X-1’s low elevation (25∘ at minimum) during early and late hours of individual observation runs (hence why it becomes more evident once we switch from 9 hour runs to full 12 hour runs after MJD 55200) leading to increased atmospheric opacities, or possibly, rising sensitivity to large scale structure as projected baselines decreased in length. While self calibration does appear to eliminate this turn over effect (standard calibration methods fail to do so), it also alters source flux density in such a way that makes measurements unreliable. Thus by using standard calibration routines we retain flux density accuracy, while the general trend and most important features of the light curve remain clear.
3.2 Imaging, modelling and subtractions
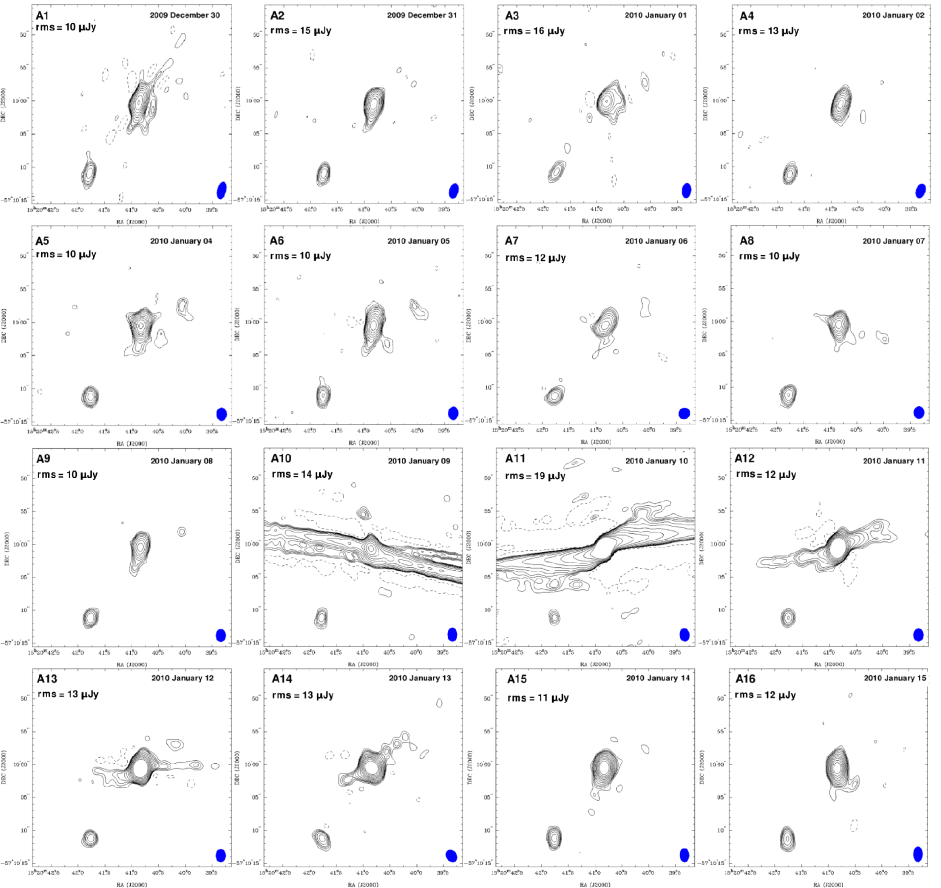
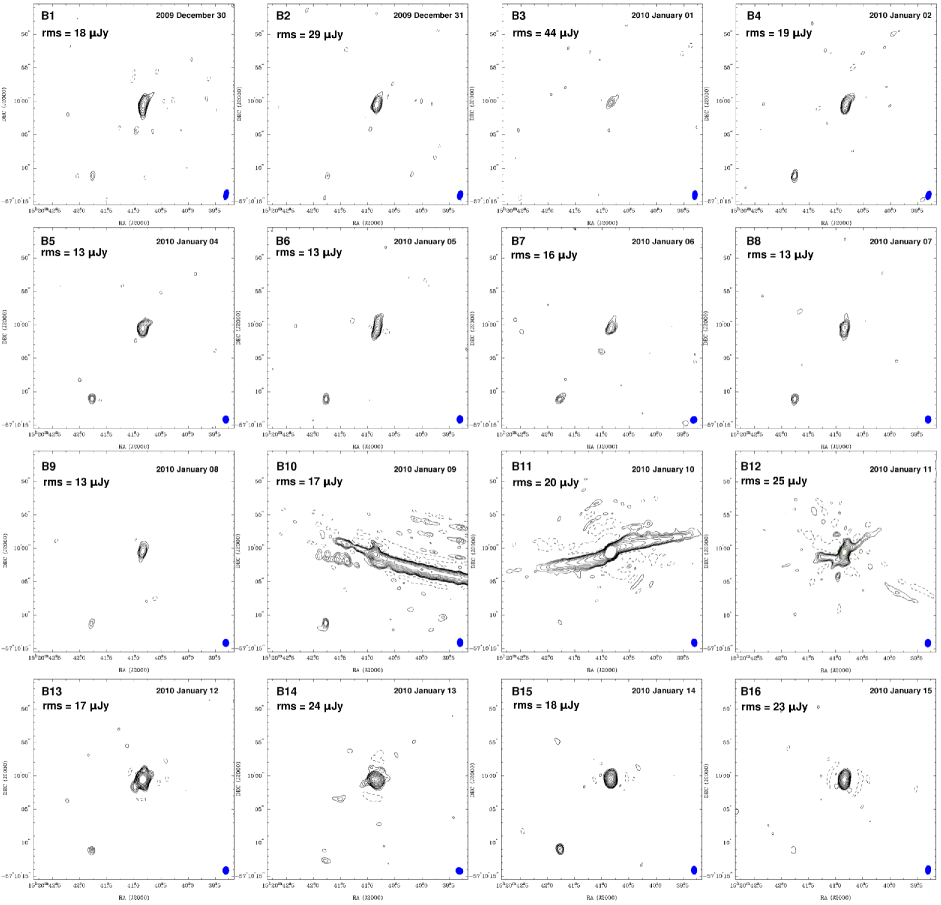
3.2.1 Original images
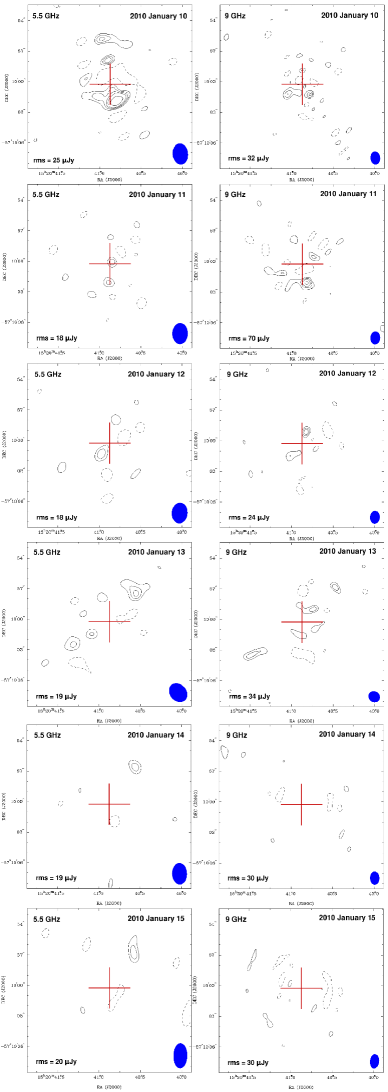
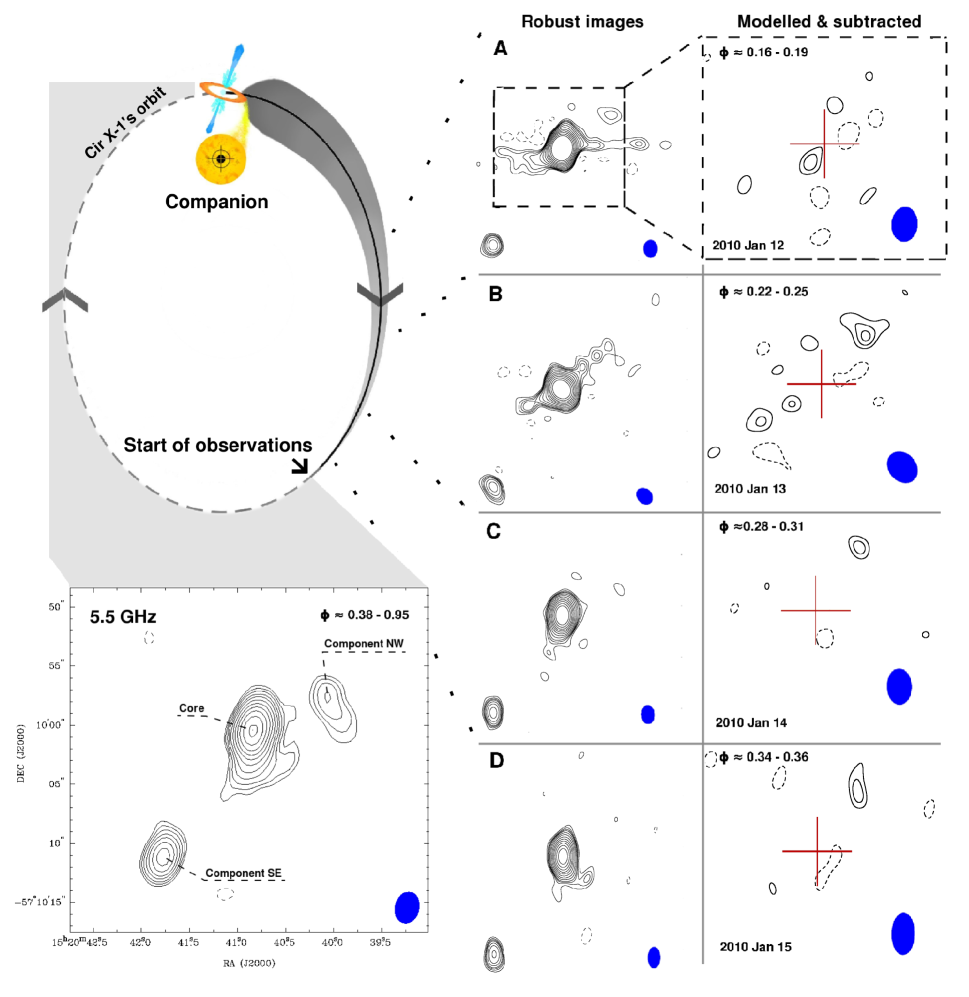
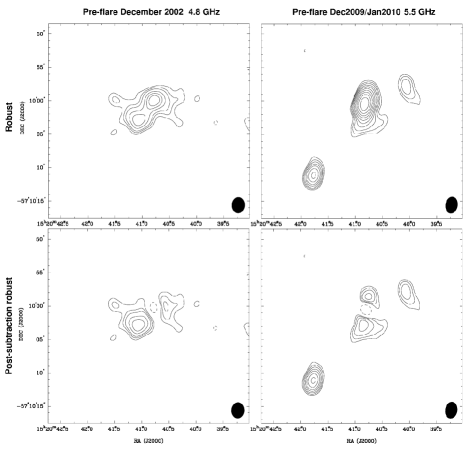
Images were created for each day’s individual data set, at both frequencies. These are presented, for reference, in Appendix A (5.5 GHz in figure A1, 9 GHz in A2). The images were self-calibrated in an effort to improve image fidelity and reduce the effects of artefacts caused by the large flux density variations following flare onset. All flux density measurements on the other hand (Table 1), are taken from images that have not undergone self-calibration, but only the standard calibration methods detailed in the MIRIAD guide. All uv data with uv distances shorter than 6 k at 5.5 GHz and 10 k at 9 GHz were ignored in order to eliminate the more diffuse emission from the surrounding nebula (see section 3.3). Note, that we will first address the ‘normal’ images from data sets before, and several days after the flare, in which conditions are more stable and similar from day to day, prior to discussing the images during and shortly after the event. The stability during the pre-flare days also allows us to combine the data from the first nine observations to produce a deep 5.5 GHz map of the system’s core and nearby region; this image is presented in the lower left hand panel of Figure 3. Fig 3 also presents the normal robust weighted images for the four days after the flaring episode (corresponding to images A13–A16 in Appendix A1), as well as images in which the (variable) core has been subtracted (see section 3.3) in an attempt to measure weak variability on arcsec scales.
The system’s core (centred) is well defined in all images, and in many of the 5.5 GHz examples shows a distinct south/south-east extension (particularly evident in Figure 3’s deep map) which can be interpreted as evidence for an approaching jet, i.e. the jet component aimed along our line of sight. The position angle of this jet is similar, but appears to be slightly more southerly than that observed in previous data sets (Tudose et al. 2008). Some of the individual images also show a slight north/north-west protrusion, or general elongation of the core along the north-south axis which cannot be fully explained by beam shape alone, indicating the presence of the (likely) receding jet. The maps produced from 9 GHz data show similar elongation of the core, as well as extensions related to the jets. However, unlike at 5.5 GHz, the 9 GHz northern jet structure appears to be just as visible as its southern counterpart, and often more easily so.
In figure 4 (upper row) we compare our deep pre-flare map to a single day’s observations from the pre-flare period of 2002 Dec. The difference in the structure near the core is significant, as we can clearly see a second bright component a few arc-seconds to the south west of the core in the 2002 map which does not appear in our 2009/2010 map. This component was that which varied following flare events, leading to the high jet velocity estimates by Fender et al. (2004), and though not persistent, structure has appeared in or very near this location multiple times in the past at various levels of intensity (see Tudose et al. 2008).
The lower row of Figure 4 shows point source subtraction results based on fits to the location of the core. It should be noted that the two far components (SE and NW) in our maps would be less likely to appear in the older map due to the lower signal to noise available (assuming similar flux densities). The differences in residual structure around the core is now more prominent. Firstly, though in both cases we observe residual structure on opposite sides of the core void (i.e. components likely related to the jet pair), we can clearly see the south-eastern component is significantly brighter than its north-western counterpart in the 2002 image, unlike our image which shows more similar intensity between the two (southern residual peak flux density of 79 4 Jy, northern residual with 75 4 Jy). Secondly, the axis along which these structures lie is different in the two images, with our map showing an axis ( 170 15∘) far closer to north-south than 2002’s near east-west orientation.
The images created from data sets during, and shortly after, the flare (panels A10 - A13) show the artefacts caused by rapid variation in brightness of a source during an observation (especially with an E-W array with its instantaneous one-dimensional projection in the uv plane), and as such much of what we see is not real, or requires very careful interpretation. There do appear to be resolved structures along the SE-NW axis (i.e. the jet axis) that do not make up part of the general elongation of the core, and thus we may be tempted to believe they are jet related, however, given the time since flare onset and angular distance of these structures ( 5”) we can quickly disregard these as real new components within the system. The intensity of distortions is reduced as flux densities and decay rates decline. The core at no point appears to resolve into two separate bright components as has been observed in the past (i.e. as in Figure 4; Fender et al. 2004, Tudose et al. 2008).
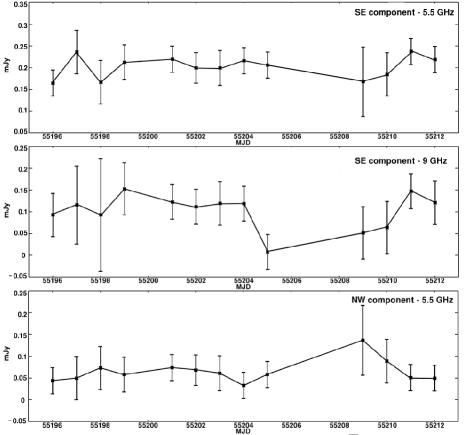
Other than the core, the most notable structure in the images is the separate emission component to the south east (labelled component SE in Figure 3’s deep map), located at approximately 15:20:41.75, -57:10:11 (J2000). Upon initial inspection we would assume this to be a possible component of the approaching jet, due to its proximity to Cir X-1 and the fact its position angle would fit well with that of previously observed outflow structures. The source is detected but unresolved at both frequencies, with an average spectral index of -1.4. The angular distance from the core to this component is 13”, which, based on previously estimated outflow Lorentz factors ( 10, distance 6.5 kpc), would mean flux density variations linked to core outbursts and subsequent re-energisation via the jet will be delayed by 30 days (assuming constant flow velocity). We may still be able to observe re-energisation of the component by flows from an older core outburst, with a large phase offset resulting from its distance. Light curves for this component at both frequencies are visible in Figure 5, with errors based on noise levels of each image. Measurements from 2010 Jan 9, 10 and 11 (A10–A12) are not included as low-level artefacts were noted to extend from the core and overlap with the component emission, reducing the validity of those estimates. There is at best only a hint of variation in the flux density of this component at 5.5 GHz, but some evidence at the level at 9 GHz.
A second fainter component also regularly appears north-west of the core in the 5.5 GHz images (15:20:40.1, -57:09:58 [J2000] - labelled component NW in Figure 3), though remaining undetected at 9 GHz. The source appears resolved in both the deep map and individual epochs, often displaying a south western extension. Again, we are dealing with an angular distance ( 7”) that would likely involve long delays between outbursts and subsequent reactions in the component ( 20 days). The 5.5 GHz light curve is included at the bottom of Figure 5. As with component SE, there is no unambiguous evidence for variability.
In an effort to determine the origin of these emission sources, we reviewed past observations of Cir X-1. Reviewing images from Tudose et al. 2008, we found several with distinct compact emission near the location of component SE (a total of 5 epochs). Data sets from individual days of pre-CABB observations tend to yield images with noise levels close to the flux of these components, making detection difficult. Therefore, we created stacked data sets which combined observations of close epochs (i.e. within a maximum of 2 orbital periods difference in observation time) to produce deeper maps in an effort to track down further evidence of the components. These were: July 1996, October 1998, May 2001 and December 2002 (See Tudose et al. 2008 for details on these data sets). Component NW remained undetected in all revised images; however, 3 0.05 mJy in all cases, which based on our flux measurements would make the component difficult to detect. Component SE was visible in nearly all stacked images with the following flux densities: Dec 2002 - 0.17 0.02 mJy; May 2001 - 0.25 0.03 mJy; and Oct 1998 - 0.20 0.04 mJy. The exception was Jul 1996, where we had difficulty distinguishing separate components due to the abundance of structure near that portion of the image. These fluxes are not dissimilar from the range measured in our data.
Linear polarisation was detected ( 3 levels) at the position of the core on 10 Jan 2010 at 9 GHz. No other images show any distinguishable polarisation in regions of interest and the single detection is relatively weak ( 2% of core flux density: 0.1 mJy), thus few strong conclusions can be garnered from it. Based on estimates quoted in Tudose et al. (2008) a correction of 9∘ must be applied to account for Galactic Faraday rotation. Vector orientation indicates electric fields aligned away from the jet axis, but not entirely perpendicular; similar to what was observed from the core in previous epochs (see section 7 of Tudose et al. 2008).
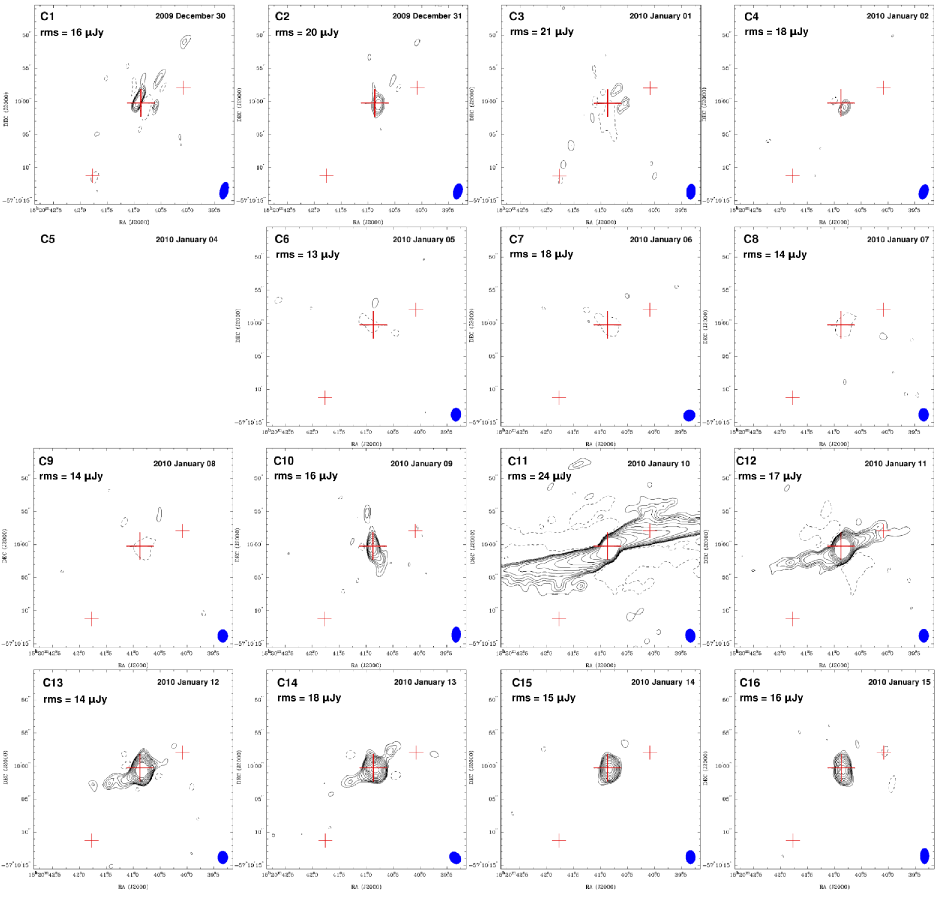
3.2.2 Difference images
In order to compare data sets on a day to day basis in search of structural changes associated with Cir X-1’s flare, it was prudent to select a single day’s data to act as a reference. This observation could then be subtracted at the in the uv plane (prior to construction of images) from each epoch, leaving only those regions of flux density which had changed in intensity. The reference data set would have to fall on a day sufficiently distant in time from a flare event, so that any subsequent variation in flux levels had diminished, both of the core and any nearby structures that may have reacted to the event. Based on the flare event captured in our observations, we can see that even 6 days after flare onset, the core continues to remain above pre-flare flux density levels. It is best to select a day that falls beyond a half-period after a flare event as a reference, i.e. 8 days or more. In case of a flare having occurred prior to that in our data, the reference would fall on 2010 Jan 01. Unfortunately we must also take into account data quality, as some days include gaps (or shorter observation durations) and increased levels of RFI. As mentioned in section 3.1, Jan 01/02 data suffered from problems making it an inadequate reference choice. Data from 2010 Jan 04 suffered from neither gaps, unexpected errors, nor high levels of RFI, and additionally covered a near full 12 hours, meaning it could not only be cropped to match hour angles of the earlier half of observations (each 9 hours long) but would also cover most of subsequent observations for effective comparisons.
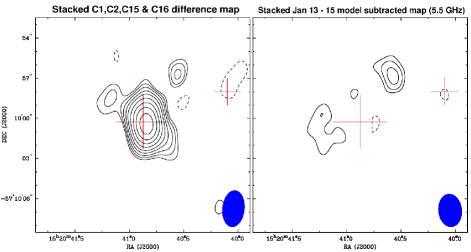
Appendix B (Figures B1 and B2) shows difference maps for all days at 5.5 GHz and 9 GHz respectively. The days prior to Jan 04 show excess flux at, or near the core; whereas the days following, but prior to the flare event, show regions of over-subtraction in the same location. This is a logical result from the trend in fluxes listed in Table 1 and would suggest a gradual decay in flux density over the first 10 observations, perhaps following a flare event preceding that of Jan 09. There are a pair of structures visible in the December 5.5 GHz images (panels C1 and C2) towards the north-west which should be noted, as they appear along the known jet axis and in the same locations in each of the images, then go undetected in most pre-flare maps. Images from the days following the flare event remain heavily affected by artefacts; however, the asymmetrical nature of some of the structures (e.g. C13) suggest that there may be some real emission towards the south-east which may persist over several days. A similar argument can be made for the structures in panel C14, and the emission component that is visible to the north-west persists in panels C15 and C16. Furthermore, its position is concordant with the structure nearest the core in panels C1 and C2. The left hand panel of Figure 6 shows the results of stacking data used for panels C1, C2, C15 and C16, in which one can clearly see the northern structure nearer the core. Though not shown in the image, the farther north-western structure from panels C1 and C2 was also visible, though only at a 3 level. The extension visible to the north-east of the core appears to be caused by an streak artefact of unknown origin running through the core perpendicular to the jet axis (further effects of this artefact can be seen to the core’s south-west).
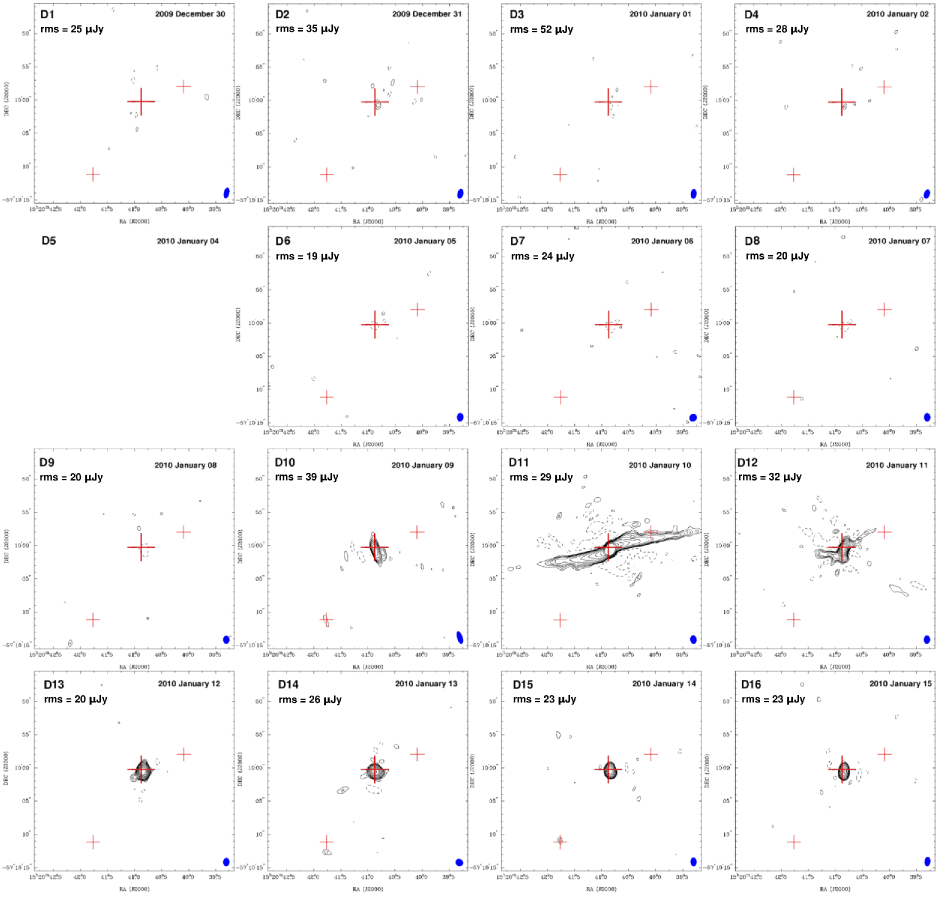
3.2.3 Model subtracted images
It is clear that the flare artefacts severely hinder our ability to interpret the images after Jan 09, with core variation continuing and causing elongation along an axis with an unfortunate similarity to that of the jet. Thus a second level of subtraction would be required to reveal structural variation in such images. This involves modelling the flaring core, based on the variation observed from measured light curves of each observation.
The process is as follows: each day’s difference data set (i.e. with the Jan 04 reference data already removed) is divided into smaller sections, approximately 5 minutes in length (100 data segments per observation). These individual sections are then converted into images and a measurement of the maximum flux density is taken from a 30 arcsec2 region centred on the core. It should be noted that no effort to clean the image is made prior to the measurement, as it results in no improvement to image fidelity for such small data chunks. Though these snapshot images are of very poor quality, the light curves that result from this process are very similar to that of Figure 1 suggesting relatively accurate representation of behaviour at the core. The flux density measurement of each 5 minute segment is then used to construct a 5 minute data model, representing a single source of the same flux density at the position (based on measurements made from the unaltered data) of Cir X-1’s core. Using the MIRIAD task UVSUB, one can then create new 5 minute data segments with the models subtracted, and recombine them into a complete observation (UVCAT). This final data set can then be inverted and cleaned as normal, eliminating as effectively as possible the recorded core behaviour.
The results of this process on the post flare images are shown in Appendix C. Unsurprisingly, the subtractions were least successful on the Jan 10 images owing to the rapid rates of variation soon after the flare. Many of the structures around the location of the core are likely to be remnants of flare artefacts or the result of phase errors, inferred from the symmetrical or anti-symmetrical layout of strong positive and negative counterparts (easily visible in the 5.5 GHz Jan 10 image). Though the Jan 11 images are cleaner by comparison, we must remain wary as we are still dealing with a day of high flux densities and decay rates. Most visible structures can be disregarded, owing to their numbers, negative counterparts, and almost random arrangement.
The final four model subtracted images are also shown in Figure 3 (far right column) together with their unaltered counterparts (described in section 3.2.1), in an effort to summarise the behaviour that occurs within Cir X-1. Jan 12 images (row A of Fig 3) show some emission to the south-east (i.e. along the jet axis) of similar size and position at both frequencies, leading to jet velocity estimates with 10 (assuming a relation with the flare of Jan 9th). However, we also observe a negative component at 5.5 GHz whose position would suggest these may be an artefact pair. We also observe strong emission to the north at 9 GHz, but the lack of a 5.5 GHz counterpart means we cannot confirm if it is real. The images from Jan 13 onwards show the strongest evidence of real structural variation beyond the core. These were the images that showed the lowest level of artefacts caused by the flare, prior to core subtraction, and thus are the most likely to display real emission structures rather than residual artefacts.
This leaves three components of interest in the 5.5 GHz images, two of which have possible counterparts at 9 GHz that do not appear to be related to side-lobes. The component nearest the core at 5.5 GHz on Jan 13 may be related to the negative component on the opposite side of the core, and without a confirmed counterpart at 9 GHz is best ignored. The remaining two components reside on opposite sides of the core and have possible 9 GHz counterparts appearing a significant distance further from the core (1-2”), yet they remain along a very similar axis. The northern component at 15:20:40.56 -57:09:56.7 (J2000) does appear to have a negative counterpart at a similar distance to the south-east of the core, and though it is slightly smaller and fainter, may still indicate effects of flare artefacts. However, support for the reality of this northern structure is that it persists at 5.5 GHz through Jan 14 and 15 images, and the position also coincides with that of the near-core northern component observed in the Dec 30 and 31 difference maps (see section 3.2.2). Both positive structures are not seen again at 9 GHz, nor does any significant new structure arise over the final 2 days. The result of stacking these final three days of model subtracted data is shown in the right panel of Figure 6, where we can see strong evidence of the northern component ( 5) and weaker signs of south-eastern residual structure ( 3).
Flux density variation of the northern component over the 3 days is well within the noise levels of the individual images. The emission lies approximately 3 - 5” away from the core, and appeared 3 days after the peak of the flare event. If we assume it is real, then it is unlikely to be related to our observed flare event, as that would require Lorentz factors of 35. However, if we consider the possibility of an earlier flare (16.6n4 days delay) being the source of re-energisation, then the calculated velocities may be significantly reduced (e.g. 20 day delay gives to be 6 - 10).
As a test of our methods we investigated whether the process of removing the generated model from the data could inadvertently create solitary structures such as those in the images. We created model data with a single point source at Cir X-1’s location (much like the subtraction model) but included noise within the flux density values with a combination of sinusoidal variation and random number components. The resulting models strongly resembled a single day’s high resolution light curve of Cir X-1’s core (with flux density levels set to be similar to those seen during flare decay). We proceeded to image this model data and run it through the same light curve extraction and model subtraction routines we used on the real data (with varying interval sizes). The result was a near complete removal of the source each time (a weak ‘core’ would remain with flux density 1% of original levels), with flux densities of residual surrounding structure in the image reaching only a few Jy (i.e. r.m.s. noise levels in standard images) and distributed in a spoke like manner rather than clustering.
3.3 Large scale structure
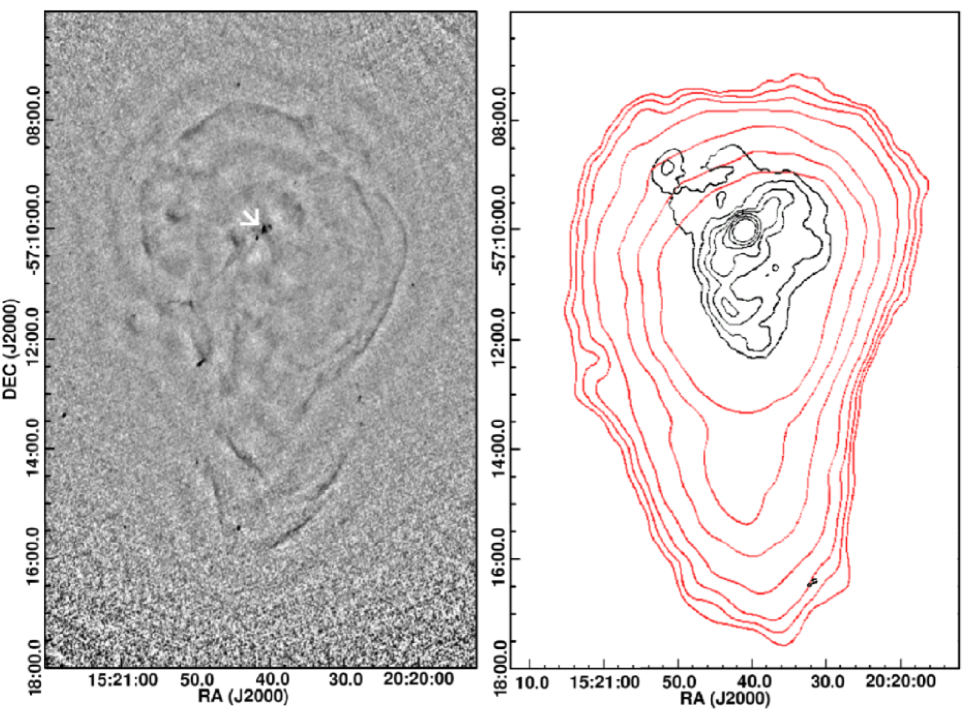
By combining the observations from the first 9 days we were able to create a deep 5.5 GHz radio map of Circinus X-1 and its surrounding region (Figure 7, left), with rms levels in the majority of the map not rising above 3.5 Jy beam-1. These low noise levels allow us to see detailed filament-like structures outlining the known layout of the Cir X-1’s jet powered nebula, and what appear to be faint (compared to the core) less diffuse regions within the larger nebula structure. We compare our map with contours created from the data used in Tudose et al. 2006 (Figure 7, right). The red/grey contours are those from 1.4 GHz observations with the ATCA in a short baseline configuration (EW214: minimum baseline of 31m, maximum of 4500m) taken in September 2004, showing the outer regions of the nebula surrounding Cir X-1. The black ATCA contours (configuration 1.5A: minimum baseline of 153m, maximum of 4469m) are from August 2001 and are also at 1.4 GHz, but the observations did not include baselines as short of those from Sep 2004, and thus we observe slightly more detailed structure closer to the core. The asymmetry of the structure can be observed on both these scales: an extension of the nebula towards the south. This has been mostly attributed to projection effects as a result of the approaching south-eastern jet, and receding north-western jet. However, there are also bends in the jets (evident in the black contours) which may be attributed to precession of the jet (much like SS433) or interactions with higher-density material along the jet’s path which cause the flow to deviate.
In our deep map we can see numerous filament structures outlining the nebula’s edges, as well as multiple components along the jet axis, including the radio counterparts to the X-ray synchrotron ‘caps’ reported in Sell et al. (2010). Though they form circular outlines, the filaments are unlikely to be the residuals of side lobe structure, based on comparison to the corresponding beam patterns; they are too large, intense and sharply defined (even prior to the application of cleaning algorithms). Much of the more diffuse structure within the confines of the filaments is affected by beam distortions, causing large scale ‘lumpiness’ or corrugation, though several sharper intense regions stand out (such as the caps). The majority of the outlying filaments have peak flux densities of 2 Jy beam-1, but since the 6A ATCA array configuration uses particularly long baselines (especially in comparison to those used in Tudose et al. 2006), it is likely much of the emission from these regions has been resolved out. This is also indicated via comparison of the flux levels with those measured at the same locations at lower frequencies, yielding an extremely steep spectrum ( 4). It should also be noted that though we have corrected for the response of the primary beam, the distance of the filaments from the pointing centre of the observation ( 2.5 arcmin for the ‘ring’ filaments, 4 - 5 arcmin for those to the south) may still add to the uncertainty in flux density measurements as a result of uncertainties in the primary beam model itself.
None of the filaments are detected at 9 GHz or in polarisation maps, and estimates for individual structures show no region has minimum brightness temperature Tb-min 0.5104 K, meaning either synchrotron or bremsstrahlung processes can be the cause. Nonetheless, these filaments clearly define an outline similar in form to that of the nebula, including the southern extension, though smaller in comparison to the full low frequency emission (red contours). Assuming the validity of a bremsstrahlung scenario, a comparison may be made with the nebula of Cygnus X-1 where we observe the thermal bremsstrahlung emission from ionised gas produced behind the bow shock of a jet impacting on the ISM, for which temperature estimates give T 104 K (Gallo et al. 2005).
It is also possible that we are observing boundaries related to the synchrotron emission bubble formed by the outflows and being reheated by continuing jet emission pointed towards us. Tudose et al. 2006 reported flattening of the nebula’s spectrum towards its edges, in particular in the north east and south west extremes: regions in our maps where we observe longer, unbroken emission filaments. The interpretation that followed was that the sites were regions of increased interaction between the ISM and accelerated particles. The filament like morphology may simply be a result of density fluctuations in the ISM, or perhaps, if the jet does precess or the large scale structure of the outflows has changed over time, they may be regions of jet-ISM interactions much like those observed in nebula W50 (Dubner et al. 1998). It could easily be imagined that, if this nebula resembles a layout much like that of SS433 and W50 but orientated towards us (inferred from the jet inclination: Fender et al. 2004), then, as suggested by the contour maps, the diffuse emission we see at lower frequencies would appear to extend beyond brighter zones reheated by the jets due to the ‘middle’ of the nebula being wider than the tapered ends (through which we are viewing the system).
4 Discussion
Previous observations of Cir X-1 taken during its brighter past have shown most of the system’s activity and structural variation occur south-east of the core, which is likely to be the direction of the approaching jet. Indeed there have been several epochs during which the emission of a distinct south-eastern component only 2 - 3 arc-seconds from the core has outshone the core itself (2001 May 29 - Fender et al. 2004, Tudose et al. 2008). There has also been some evidence of the receding jet (1996 July 02, 2000 October 25); however, the receding jet never appeared without activity from its counterpart, with the latter remaining dominant in comparison.
Initial inspection of images such as the bottom left panel of Figure 3 would suggest the current trend is similar, but with the core being significantly diminished. We observe a bright component (component SE) 13 arc-seconds to the south east of the core and a fainter counterpart to the north/ north west (component NW), slightly nearer but still over 10 arc-seconds away. However the nature of component SE can be easily scrutinised. Firstly, as well as being unresolved in the radio, it was also found by Sell et al. (2010) to be unresolved in X-rays and coincident with a bright IR point source. Subsequently, Sell et al. were unable to statistically rule out the possibility that the component is in fact a background source. If the emission was indeed related to the jet output from Cir X-1, we might expect some level of long term variation in flux density (to match Cir X-1’s core decline over the past decades) or position (as a previous ejection event). Archival data not only revealed it to exist in the same position during several epochs over the past decade or more, but that its flux density has not varied significantly beyond the range of values measured from our observations, and has not followed any particular trend. With this additional information in mind it becomes easier to disregard component SE as jet related emission, but it will require further observation before a firm conclusion can be made.
The northern counterpart (component NW) remains a strong candidate for jet emission. The source is resolved in both radio and X-rays, as per Sell et al. 2010, and was not found to have an IR counterpart. It remains undetected in any past observation stacks (bearing in mind if at the same low flux density it would fall below the noise), though there has been evidence of intermittent structure near its location in individual epochs detailed in Tudose et al. (2008); specifically 2000 October 20/21 and 2001 May 27.
The strongest indication of structural variation in our maps originates in regions to the north west of the core. The structure visible in model subtracted images from Jan 13 through 15 (and possibly Dec 30, 31) lies at an angle similar to that of the jet and thus may be related to the receding outflow, though we observe comparatively little change in the south. This behaviour goes against what is expected of the system based on past observations, with the greatest level of activity coming from a brighter approaching jet located to the south. This difference could simply be due to intrinsic asymmetry of interacting material around the binary, but jet precession could be an alternative explanation. For a small angle to the line of sight, as proposed, even a small degree of precession could account for a reversal of orientation with the approaching jet appearing in the north western quadrant. It should be noted that no significant change in jet axis has been observed in radio images that have been made of the core over the last decade and a half prior to our observations (Tudose et al. 2008), suggesting that if any change in orientation has occurred, it was sudden and recent. Nonetheless, a near 180 degree reversal of the projection of the jet axis, though plausible, remains suspicious, and suggests that the asymmetric flow theory is more likely.
We may also be dealing with a kinked or deviated outflow. Though we already see evidence of the south eastern outflow being curved on arc-minute scales, there may be bends earlier in the outflow that result in increased beaming effects along portions of the jet further inclined along our line of sight. Such could be the case for component SE, providing explanations for its stable position and compact structure if it were related to a persistent jet kink. Again, if dealing with a generally low jet inclination, significant deviations of the outflow direction could cause emission activity within the approaching jet to appear either side of core via projection along our line of sight.
The point source subtraction images shown in Figure 4 also provide evidence for precession, showing a possible axis that is almost a north-south orientation. Additionally, based on the greater degree of symmetry in residual structure around the core, our images suggest a higher inclination for the jets than that observed in the past. This latter conclusion might be seen to weaken the justification for using low jet inclination as a possible explanation for the observed behaviour in our images. However, just as observed in the outflows of SS433, the inclination of a flow can vary as we move further from the core, in this case as a result of either precession, flow deviation, or a combination of both.
5 Summary
We have presented the results from ATCA-CABB radio observations of a complete 17 day orbit of Circinus X-1 at 5.5 and 9 GHz. We successfully captured the rise and decay of a periastron flare event from the system’s core and mapped the structure of the system on each day during this period, during which it transpires Cir X-1 was in an historically faint radio state. Prior to the flare event the system was very stable at mJy flux densities. After the flare there is some evidence for significant spatially resolved changes in the images on arcsec scales in carefully modelled and core-subtracted images. The strongest sign of structural variation appears north west of the core, in the region previously associated with the direction of the receding jet. We interpret this unexpected behaviour as either an indication of asymmetry in the surrounding, or alternatively, of a change in outflow direction via precession or curvature of the jets. A change in jet orientation is also supported by comparisons of residual structure around the core in our maps to that of maps made from observations taken in 2002, showing an apparent ‘rotation’ of the arcsec-scale resolved core structure.
Deep radio maps of the area around the core show several persistent sources likely associated with the jets, and others that are counterparts to previously reported X-ray shocks. Large scale mapping of Circinus X-1’s surrounding region reveals filaments outlining the known structure of the system’s jet powered nebula, which, assuming a low inclination for the system’s jets (as has been previously claimed), suggest the system’s configuration may resemble that of SS 433 and W50, but viewed longitudinally.
6 Acknowledgements
D.E.C. and J.W.B. acknowledge support from the United Kingdom Science and Technology Facilities Council. The Australia Telescope Compact Array is part of the Australia Telescope which is funded by the Commonwealth of Australia for operation as a National Facility managed by CSIRO. This research has made use of the MAXI data provided by RIKEN, JAXA and the MAXI team.
References
- [1] Calvelo, D. E., Fender, R. P., Broderick, J., Moin, A., Tingay, S., Tzioumis, A. K., Nicolson, G., 2010, ATel, 2699
- [2] Clark, D. H., Parkinson, J. H., Caswell, J. L., 1975, Nature, 254, 674
- [3] Dubner, G. M., Holdaway, M., Goss, W. M., Mirabel, I. F., 1998, AJ, 116, 1842
- [4] Fender, R. P., 1997, in Dermer, C. D., Strickman, M. S., Kurfess, J. D., eds, AIP conf. Proc. Vol. 410, Proc. Fourth Compton Symp. Am. Inst. Phys., New York, p. 798
- [5] Fender, R. P., Wu, K., Johnston, H., Tzioumis, A. K., Jonker, P., Spencer, R., van der Klis, M., 2004, Nature, 427, 222
- [6] Fender, R. P., Tzioumis, A. K., Tudose, V., 2005, ATel, 563
- [7] Gallo, E., Fender, R. P., Kaiser, C., Russell, D., Morganti, R., Oosterloo, T., Heinz, S., 2005, Nature ,436, 819
- [8] Glass, I. S., 1978, MNRAS, 183, 335
- [9] Haynes, R. F., Jauncey, D. L., Murdin, P. G., Goss, W. M., Longmore, A. J., Simons, L. W. J., Milne, D. K., Skellern, D. J., 1978, MNRAS, 185, 661
- [10] Heinz, S., Schulz, N. S., Brandt, W. N., Galloway, D. K., 2007, ApJ, 663, L93
- [11] Hjellming, R. M., Rupen, M. P., Mioduszewski, A. J., Smith, D. A., Harmon, B. A., Waltman, E. B., Ghigo, F. D., Pooley, G. G., 1998, AAS, 193, 103.08
- [12] Högbom, J. A., 1974, A&AS, 15, 417
- [13] Homan, J., et al. , 2007, ApJ, 656, 420
- [14] Iaria, R., Spanò, M., Di Salvo, T., Robba, N. R., Burderi, L., Fender, R., van der Klis, M., Frontera, F., 2005, ApJ, 619, 503
- [15] Iaria, R., D’Aí, A., Lavagetto, G., Di Salvo, T., Robba, N. R., Burderi, L., 2008, ApJ, 673, 1033
- [16] Johnston, H. M., Fender, R., Wu, K., 1999, MNRAS, 308, 415
- [17] Jonker, P. G., & Nelemans, G., 2004, MNRAS, 354, 355
- [18] Jonker, P. G., Nelemans, G., & Bassa, C. G., 2007, MNRAS, 374, 999
- [19] Linares, M., et al. , 2010, ApJ, 719, L84
- [20] Margon, B., Lampton, M., Bowyer, S., Cruddace, R., 1971, ApJ, 169, L23
- [21] Matsuoka, M., et al. , 2009, PASJ, 61, 999
- [22] Mignani, R. P., De Luca, A., Caraveo, P. A., Mirabel, I. F., 2002, A&A, 386, 487
- [23] Moin, A., Reynolds, C., Miller-Jones, J. C. A., Tingay, S. J., Phillips, C. J., Tzioumis, A. K., Nicolson, G. D., Fender, R. P., 2011, MNRAS, 693
- [24] Murdin, P., Jauncey, D. L., Haynes, R. F., Lerche, I., Nicolson, G. D., Holt, S. S., Kaluziensku, L. J., 1980, A&A, 87, 292
- [25] Nakajima, M., et al. , 2010, ATel, 2608
- [26] Nicolson, G. D., Glass, I. S., Feast, M. W., 1980, MNRAS, 191, 293
- [27] Nicolson, G. D., 2007, ATel, 985, 1
- [28] Sault, R. J., Wieringa, M. H., 1994, A&A, 108, 585
- [29] Sault, R. J., Teuben, P. J., Wright, M. C. H., 1995, ASPC, 77, 433
- [30] Sell, P. H., et al. , 2010, ApJ, 719, L194
- [31] Soleri, P., Tudose, V., Fender, R. P., van der Klis, M., Jonker, P. G., 2009a, MNRAS, 399, 453
- [32] Soleri, P., et al. , 2009b, MNRAS, 297, L1
- [33] Stewart, R. T., Caswell, J. L., Haynes, R. F., Nelson, G. J., 1993, MNRAS, 261, 593
- [34] Tennant, A. F., Fabian, A. C., Shafer, R. A., 1986, MNRAS, 219, 871
- [35] Thomas, R. M., Duldig, M. L., Haynes, R. F., Murdin, P., 1978, MNRAS, 185, P29
- [36] Tudose, V., Fender, R. P., Kaiser, C. R., Tzioumis, A. K., van der Klis, M., Spencer, R. E., 2006, MNRAS, 372, 417
- [37] Tudose, V., Fender, R. P., Kaiser, C. R., Tzioumis, A. K., Spencer, R. E., van der Klis, M., 2008, MNRAS, 390, 447
- [38] Toor, A., 1977, ApJ, 215, L57
- [39] Whelan, J. A. J., et al. , 1977, MNRAS, 181, 259
Appendix A Un-altered data radio maps
The following maps (including those in subsequent appendices) use ATCA-CABB data that has undergone both normal calibration and phase calibration routines prior to final deconvolution. Maps were cleaned using multi-frequency clean subroutines.
Appendix B Difference radio maps
Appendix C Model subtracted radio maps