Continuous magnetic and structural phase transitions in Fe1+yTe.
Abstract
We report a sequence of continuous phase transformations in iron telluride, Fe1+yTe (), which is observed by combining neutron diffraction, magnetic susceptibility, and specific heat measurements on single crystal samples. While a gradual increase of magnetic scattering near the wave vector is seen below K, a temperature where the discontinuous first order magneto-structural phase transition is found in systems with small (), the reduction of the lattice symmetry in Fe1.1Te only occurs at K. Below K the long-range magnetic order develops, whose incommensurate wave vector varies with temperature. Finally, at K the system enters the low- phase, where is locked at . We conclude that these instabilities are weak compared to the strength of the underlying interactions, and we suggest that the impact of the Fe interstitials on the transitions can be treated with random-field models.
pacs:
71.27.+a 74.20.Mn 74.70.Xa 75.25.-j 78.70.NxI Introduction
Iron telluride is an end member of the simplest chalcogenide family of iron-based high-temperature superconductors (HTSC), Fe1+yTe1-xSex. It becomes superconducting upon partial (or full) isoelectronic substitution of Te by Se.Yeh2008 ; Hsu2009 ; Wen2011 Although the highest critical temperature for FeTe1-xSex is only K, it increases to above 30 K in KxFe2Se2, or under pressure.Margadonna2009 ; Guo2010 The FeTe crystal structure consists of a continuous stacking of square-lattice layers of iron atoms, each sandwiched between the two half-density layers of bonding chalcogen atoms, which is the basic structural motif for all iron-based superconductors. The Te atoms, which tetrahedrally coordinate the Fe sites, occupy alternate checkerboard positions above and below the Fe layer, so that the resulting unit cell contains two formula units. In this quasi-two-dimensional structure, FeTe layers are held together only by weak Van der Waals forces. Crystallographic stability is improved if some amount of extra Fe atoms is incorporated between the layers, which has important consequences for the low-temperature phases observed in the Fe1+yTe series, .Bao2009 ; Rodriguez2011 ; Stock2011 ; Li2009 ; Martinelli2010 ; Liu2011
Similarly to the cuprate and the ferro-pnictide HTSC families, the end member Fe1+yTe has a magnetically ordered ground state and undergoes a structural distortion which lowers the high-temperature tetragonal (HTT) lattice symmetry.Kastner1998 ; LynnDai2009 ; LumsdenChristianson2010 The physics behind these low-temperature phases and their relation to the superconductivity are of great interest and have been the subjects of intense study.Nakajima2011 ; ZhaoDai2008 ; LiDai2009 ; ChuFisher2009 ; Rotundu2010 ; Nandi2010 ; Ni2010 ; Kim2011 ; Marty2011 Two general trends of the phase diagrams were established: (i) unless there is a first order magneto-structural transition, the lattice distortion usually occurs at a higher temperature () than the magnetic ordering (), , and (ii) both and are reduced upon chemical substitution, so that both orders tend to disappear as the superconducting state develops. While this observation suggests a close connection between the magnetic ordering, the lattice distortion (LD), and the superconductivity, other studies indicate that there might be no causal relationship between these phenomena.Canfield2010 ; Katayama2010 ; Shimojima2010 In that case, they are simply different manifestations of the same complex physics underlying the electronic behavior of HTSC materials. The mechanisms by which composition affects the nature of these magnetic and structural transitions (first or second order, which occurs first), as well as their possible connections to superconductivity, are still not well understood.
Fe1+yTe provides an opportunity for investigating this issue. It is non-superconducting, but recent neutron studies have discovered that both magnetism and the low- crystal structure are extremely sensitive to the Fe stoichiometry.Bao2009 ; Rodriguez2011 We must note that the crucial issue of controlling the Fe stoichiometry, , is also a tedious one. In particular, we measured the iron content, , in several representative small crystals using the inductively-coupled plasma (ICP) method, and then performed supplementary neutron powder diffraction (NPD) measurements on specimens obtained by grinding single-crystal pieces. PhaseDiagram2011 We found that obtained by refining the occupancy of the interstitial site in NPD is typically about 3% higher than the chemical Fe content obtained with ICP, , for . Similar discrepancy was also observed by other groups. Stock It might imply that a certain amount of Fe vacancies exist, along with the interstitials. Here, we use the chemical Fe content as measured by the ICP as the appropriate notation for in the Fe1+yTe formula. This has to be kept in mind when comparing our results with other studies, such as in Refs Bao2009, ; Rodriguez2011, ; Stock2011, , where different determinations of have been used. We keep their original notations when discussing these results. Finally, we have also found that different crystals from the same growth can have different , thus calling for extreme caution when preparing powder specimens, as well as for the need of properly characterizing for each sample.
At low (), Fe1+yTe undergoes a first-order magneto-structural phase transition, where the HTT lattice symmetry is reduced to the monoclinic , and a “bi-collinear” magnetic order appears with propagation vector in reciprocal lattice units.Bao2009 ; Rodriguez2011 ; Stock2011 ; Li2009 ; Martinelli2010 The main peculiarity of the “bi-collinear” magnetic ordering in Fe1+yTe materials compared to the simple bipartite antiferromagnetism of other HTSC families is that it does not agree with the Fermi surface nesting of itinerant electrons, which corresponds to the position in the -plane.Hanaguri2010 ; Xia2009 ; ZhangFeng2010 ; Kanigel2011 Hence, band structure calculations, which tend to account for the Fermi surface,Subedi2008 ; Zhang2009 ; Ma2009 ; HanSavrasov2009 encounter difficulties when confronted with the broad range of experimental observations Bao2009 ; Rodriguez2011 ; Stock2011 ; Li2009 ; Martinelli2010 ; Kanigel2011 ; Chen2009 ; HuPetrovic2009 ; Khasanov2009 ; Bendele2010 ; Babkevich2010 ; Lipscombe2011 ; Zaliznyak2011 . On the other hand, the ground-state ordered moment, , Bao2009 ; Rodriguez2011 ; Li2009 ; Martinelli2010 although larger than in parent ferropnictides, is significantly less than ( Bohr magneton) expected in the ionic local-spin picture for Fe2+ () in the Hund’s state.HauleKotliar2009 While some theories postulate that Fe could be in the non-Hund, intermediate-spin S=1 state, Turner2009 such an assumption falls way short of accounting for the paramagnetic moment implicated in the Curie-Weiss behavior above 100 K Chen2009 ; HuPetrovic2009 . Thus, in Fe1+yTe we can explore the interaction of weak magnetic order with lattice and orbital degrees of freedom in a representative structure of Fe-based superconductors, disentangled from the effects of Fermi surface nesting and superconductivity.
The phase diagram for is still controversial. Bao et al.Bao2009 who first discovered the orthorhombic phase with an incommensurate magnetic order for , initially suggested that the incommemnsurability varies linearly with , and the transition is first order. A more recent NPD study Rodriguez2011 suggested that the first-order transition to a , “bi-collinear” commensurate phase survives until , at which point a mixed phase is observed. At higher , the low- phase is orthorhombic, with coexisting long-range helimagnetism and short-range spin-density-wave (SDW) order.
Here, we report studies of well-characterized single crystals of Fe1+yTe, , with a variety of techniques, which establish a sequence of continuous phase transitions. It starts with a structural distortion at K, which is followed by slightly incommensurate magnetic order at K. This implies a multicritical point, on the phase diagram of Fe1+yTe, with , where the first-order magneto-structural phase transition turns into a sequence of continuous ones. While according to Ref. Rodriguez2011, our samples belong to the grey “mixed” phase, we find no evidence for the mixed character. Instead, we find a well-defined sequence of phases as a function of temperature. This leads us to favor the idea that samples studied in Ref. Rodriguez2011, were mixtures of different stoichiometries, , among other possibilities suggested by the authors of that study. This conclusion is further supported by our more recent additional NPD and bulk measurements of the phase diagram of Fe1+yTe. PhaseDiagram2011 They suggest that multicritical point at is indeed an intrinsic property of this phase diagram. Hence, our findings provide a direct connection between the composition phase diagram of Fe1+yTe and that of BaFe2As2 (122) derived materials, where a similar multicritical point has recently been focus of considerable work.ChuFisher2009 ; Rotundu2010 ; Nandi2010 ; Ni2010 ; Kim2011 ; Marty2011
II Experimental procedure
The Fe1.1Te crystals were grown by the horizontal Bridgman method.Wen2011 The crystal used for the neutron-scattering study had a mass g and a mosaic of full-width at half-maximum (FWHM).
Our neutron measurements were carried out using the ARCS direct-geometry, time-of-flight (TOF) spectrometer at the Spallation Neutron Source, Oak Ridge National Laboratory. The instrument was operated in the Laue-diffraction-type mode,Bozin2009 where a quasi-white neutron beam with a broad band of incident neutron energies centered around meV was selected by the pre-monochromating chopper. The Fe1.1Te crystal was mounted on an aluminum holder attached to the cold head of the closed-cycle refrigerator in the ARCS evacuated scattering chamber. The crystal’s -axis was aligned in the horizontal plane, at to the incident neutron beam, while the -axis was at about to the horizontal plane. The detector signal is dominated by the elastic processes (diffraction), where the scattering angle is determined by the incident neutron energy (or wavelength, ) and the -spacing of the set of crystal planes involved in reflection, in accordance with Bragg’s law, . Such a measurement is particularly well suited for studying the relative temperature evolution of structural and magnetic scattering, which are both present in the diffraction pattern at each .
Bulk magnetization, , and heat capacity, , were measured on several single crystals with masses from 7.5 mg to 26 mg, cleaved from the same growth boule as the large crystal used for neutron studies. was measured using the relaxation method implemented in the Physical Properties Measurement System (PPMS) by Quantum Design (QD). Crystals were attached to a silver sample holder using apiezon grease, whose contribution to was measured and subtracted. Its uncertainty was the main source of the dominant systematic error. The non-magnetic lattice phonon specific heat was estimated using two different algorithms. First, we used the of non-magnetic ZnTe,Gavrichev2002 with temperature re-scaled by the ratio of the effective Debye temperatures, , of Fe1.1Te and ZnTe, obtained by fitting their in the range to a single Debye function (short-dashed lines in Fig. 2). Secondly, we used an equal-weight sum of two Debye and one Einstein functions, as described in Ref. Tsurkan_EPJ2011, for the FeSe0.5Te0.5 case, re-scaled in a similar way (solid lines in Fig. 2).
The static magnetic susceptibility, , was obtained from measured using a QD Magnetic Properties Measurement System, in a dc magnetic field T applied in the -plane, , or along the -axis, . The iron content, , was measured in these and several other representative small crystals, using the inductively-coupled plasma method. The error bar on results from the scatter of different ICP measurements. We performed supplementary neutron powder diffraction measurements on specimens obtained by grinding single-crystal pieces PhaseDiagram2011 and established that obtained by refining the occupancy of the interstitial site is about 3% higher than the chemical Fe content obtained with ICP, .
III Results and discussion
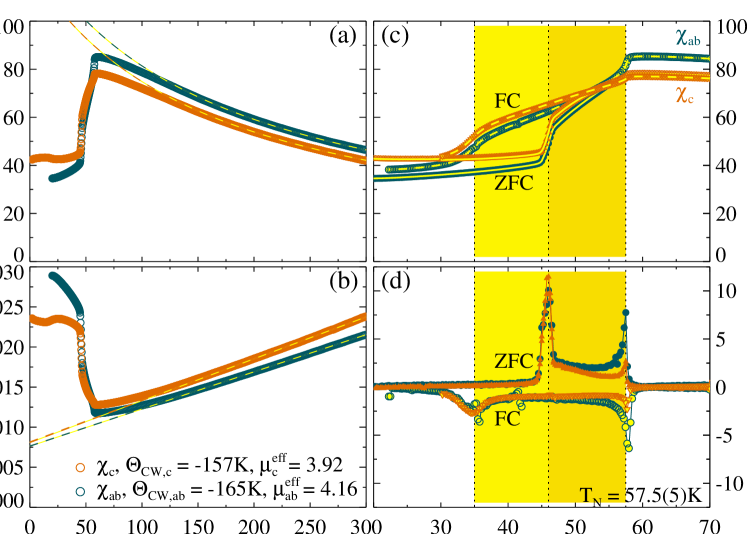
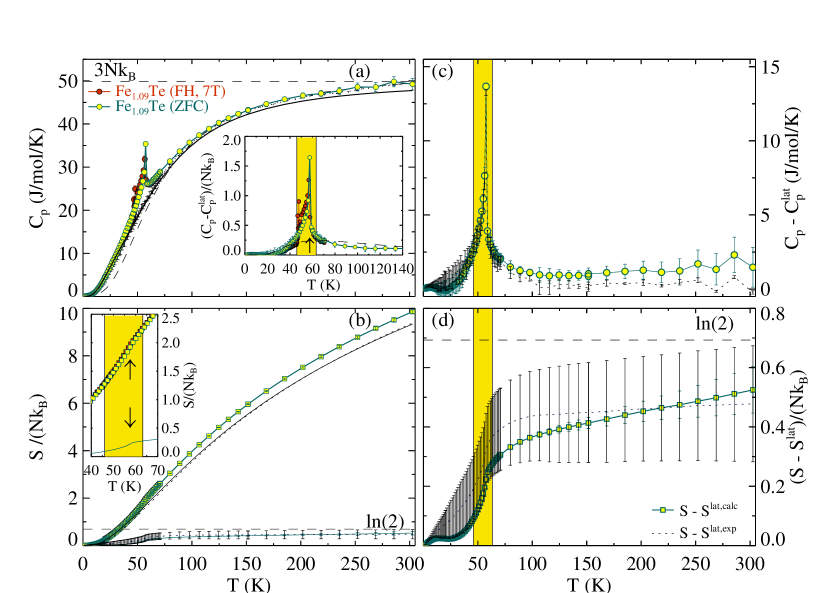
Figure 1(a) shows the temperature dependence of the magnetic susceptibility measured upon heating the zero-field-cooled (ZFC) sample. For K, it obeys the Curie-Weiss (CW) law,
| (1) |
where is Avogadro’s number, is Boltzmann’s constant, indexes the field direction, and and are the effective paramagnetic moment and the Curie-Weiss temperature. This behavior is consistent with previous studies Li2009 ; Chen2009 ; HuPetrovic2009 and is best revealed by plotting as in Fig. 1(b). CW fits to our data in the range K yield large effective magnetic moments, , which are consistent with Fe atoms having local spins with slightly anisotropic Lande factors, and . The CW temperatures are negative, corresponding to a dominant antiferromagnetic interaction, and are also very slightly anisotropic, with K and K. Remarkably, the magnitude of is much smaller than the bandwidth of magnetic excitations Lipscombe2011 ; Zaliznyak2011 , which indicates strong competition between ferro- and antiferromagetism. The low- susceptibility and its derivative in Figure 1(c),(d) clearly reveal a continuous magnetic phase transition at K. has a cusp at , rather than a first-order-like discontinuity, which is further corroborated by the -like (step) singularity in . It is followed by another magnetic transition, at a lower temperature, showing ZFC-FC hysteresis in the 35–45 K range.
The continuous, second-order nature of magnetic ordering at is further corroborated by the heat capacity in Fig. 2, which shows a type singularity. The change in magnetic entropy associated with the long-range magnetic ordering at is very small, Fig. 2(b),(d). It does not even reach per Fe, which would correspond to freezing of a single Ising degree of freedom per Fe. This, together with a rather small ordered magnetic moment observed by neutron diffraction, ,Bao2009 ; Rodriguez2011 ; Li2009 ; Martinelli2010 ; Zaliznyak2011 shows that long-range order (LRO) is weak. The most likely reason for the weakness of magnetic order is frustration arising from the competition of ferro- and antiferromagnetic, nearest- and further-neighbor interactions, which is also indicated by the small . The difference between the ZFC and the FC , as well as that measured upon heating the field-cooled sample in a magnetic field of T, is very small, suggesting that the hysteretic transition observed in susceptibility at 35–45 K is some sort of spin realignment, involving negligible change in magnetic entropy.
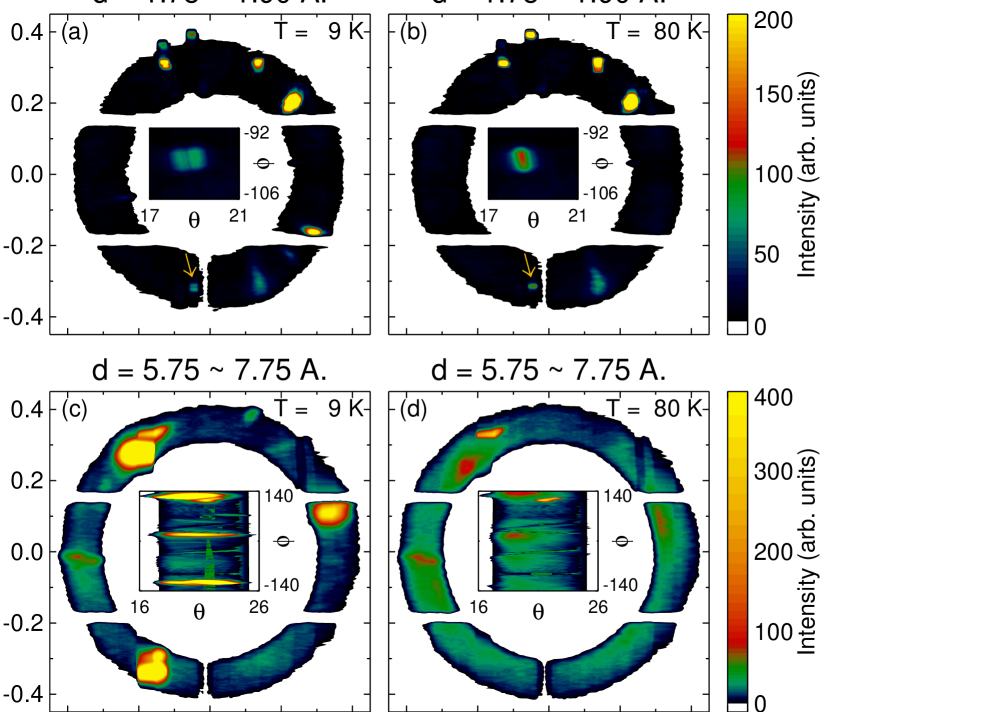
Figure 3 presents an overview of our neutron diffraction data at two temperatures, K and 80 K, in the form of Laue patterns on the detector bank. Each detector pixel is parameterized by the unit vector specifying its direction from the sample position. Although rather un-intuitive alignment of the sample reciprocal space with respect to the incident beam direction ( rotation around plus rotation around the vertical axis) results in an un-obvious pattern of equivalent Bragg peaks, reflections can be easily identified by their spacings. Panels (a), (b) show intensities corresponding to elastic scattering for the range of spacings from 1.75 Å to 1.9 Å, which is dominated by the lattice nuclear scattering. As magnified in the insets, a single Bragg spot corresponding to the lattice reflection seen at 80 K is clearly split into two spots at K.
Intensities in the bottom panels (c), (d) of Fig. 3, corresponding to 5.75 Å 7.75 Å, are mainly magnetic scattering. At the base temperature of 9 K it appears in the form of well-defined peaks near positions. Their significant angular size on detector results from the combination of deteriorating experimental resolution at small wave vectors (large spacings) and, to some extent, from contribution of quasielastic and inelastic diffuse scattering, which is also collected in this measurement. At K only a small intensity modulation highlighting former peak positions remains, while magnetic intensity appears distributed over a ring of scattering. Such pattern is characteristic of a liquid.
The competition between different magnetically ordered states, confirming the frustrated nature of magnetic interactions, is further revealed by the temperature dependencies of quasi-Laue neutron data in Figs. 4 and 5. They show intensities, obtained by integrating patterns, such as in Fig. 3, over the whole angular range of the detector array, as a function of spacing. Magnetic peak profiles near the position, Fig. 4(b) and Fig. 5(c,d), show complex structure evolving with temperature. Broad diffuse scattering around Å and a narrower peak near Å coexist for K. Below K they yield to a peak at Å, whose intensity grows roughly linearly with the decreasing . Then, below K, a new dominant peak emerges at Å. Its position changes upon cooling, and finally saturates at Å below K. At the same time, a smaller peak appears at Å.
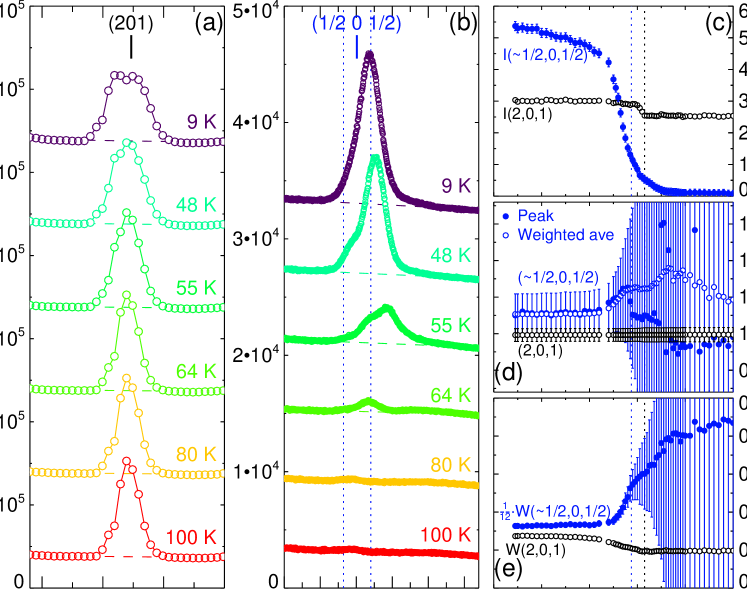
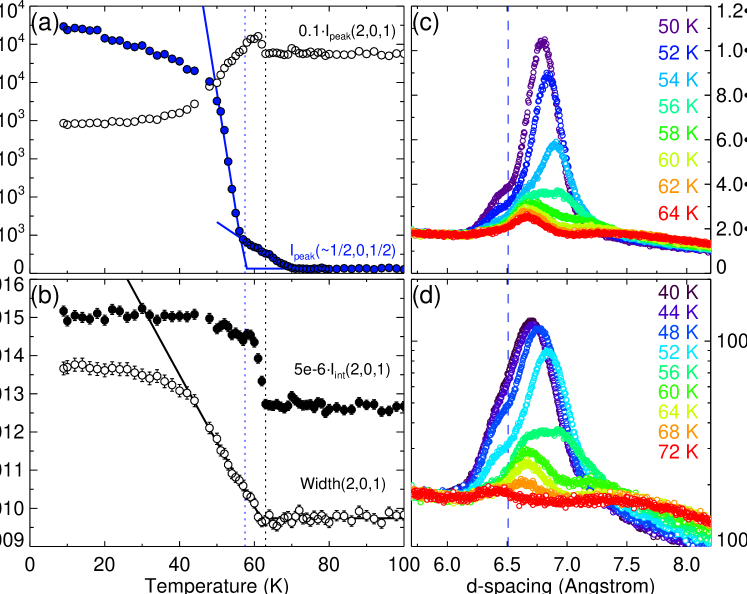
While very little, if any of these behaviors could be identified in the integrated magnetic intensity shown in Fig. 4(c), they are clearly observable in the temperature dependence of the peak maximum intensity, Fig. 5(a), and its position and width, Fig. 4(d), (e). In particular, the appearance of the new dominant magnetic component at K is most clear from an abrupt shift of the maximum intensity position in Fig. 4(d). Since it appears at the temperature where magnetic order is observed in susceptibility and heat capacity data, we identify this peak as a magnetic Bragg reflection associated with magnetic LRO. Fitting the peak intensity for K in Fig. 5(a) to an order-parameter-like dependence, , we obtain K and , consistent with the mean-field, linear behavior. The average peak position and its effective width in Fig. 4(d) and (e) are governed by the structured, multi-component nature of magnetic scattering and have very large error bars at high , where the net magnetic intensity is small. Note that error bars on the maximum intensity position, which are shown by the closed symbols in Fig. 4(d), are much smaller, of the order of the symbol size.
Since fitting the overlapping peaks is sensitive to fitting ranges and constraints, peak parameters in Figs. 4 and 5 were evaluated directly from the measured intensities. The peak integral intensity, position, and width, were obtained by numerical integration of the measured intensity, the intensity-weighted position, and the mean-square deviation, respectively, upon subtracting the linear background interpolated between the edges of data ranges shown in Fig. 4(a) and (b). Parameters of the structural Bragg reflection, whose splitting at low temperature reveals the lattice distortion that reduces the symmetry from HTT, Fig. 4(a), were obtained in the same way. The position of magnetic and lattice peaks in Fig. 4(d) are given relative to the nominal positions, and , respectively, in the HTT lattice with Å, Å.
While the evolution of the reflection between a single peak at 100 K and a two-peak structure at K seems gradual (mainly due to the experimental resolution), both the integral and maximum peak intensities in Fig. 4(c) and Fig. 5(a), as well as the peak width in Fig. 5(b), immediately reveal the structural phase transition at K. The width directly probes the order parameter – the splitting of the peak. Fitting it to an order-parameter-like dependence in K range, we obtain K and , again consistent with the mean-field behavior. The intensity is an indirect probe, and its temperature dependence is governed by the combination of splitting and extinction, which is why the two dependencies in Fig. 5(b) differ. The lattice Bragg intensity measured on a large single crystal is reduced as a result of neutron beam extinction within the crystal. It is therefore very sensitive to , where the crystal’s mosaic structure changes due to the appearance of domains associated with the lowering of the HTT symmetry Marty2011 . While our present data do not allow us to distinguish between the monoclinic and the orthorhombic structures,LynnDai2009 our supplementary powder diffraction measurements on a sample with similar indicate the structure.
IV Summary and conclusions
To summarize, our analysis of neutron Bragg scattering establishes the structural phase transition, lowering the HTT lattice symmetry at K, as the first instability which occurs in Fe1.1Te upon cooling. This transition is continuous and involves only very small structural changes: the peak splitting, , at 9 K is only %. Moreover, this transition does not show up neither in heat capacity, Fig. 2, nor in bulk magnetic susceptibility, Fig. 1, indicating negligible entropy change and nearly complete decoupling between this structural change and the magnetic order. Close examination of the magnetic scattering in Figs. 4 and 5 further corroborates this observation: its complex temperature evolution shows no visible anomaly at .
Thus, the lattice distortion, which occurs in Fe1.1Te at K, is not induced by the long-range antiferromagnetic ordering. Neither does it immediately lead to magnetic LRO, which only follows at a lower temperature, K. Magnetic order is weak. It accounts for freezing of only of (/Fe) paramagnetic entropy of spins, implicated in the CW behavior of magnetic susceptibility at K. While the present quasi-Laue data is not suitable for the absolute normalization and refinement of the LRO moment involved in Bragg scattering, complementary monochromatic beam measurements Zaliznyak2011 indicate an ordered moment in our Fe1.1Te crystal. This agrees with rather small values of the ordered magnetic moment, , observed by neutron diffraction in Fe1+yTe materials Bao2009 ; Rodriguez2011 ; Li2009 ; Martinelli2010 .
Magnetic LRO in our sample is not simple “bicollinear” type, but is an incommensurate structure, whose period varies with temperature. Upon cooling, it undergoes what looks like a lock-in transition with significant FC-ZFC hysteresis in magnetic susceptibility, as its propagation vector saturates at a low- value . In real space, such structure can be visualized by introducing a certain amount of “tricollinear” defects, whose density decreases with temperature. These defects can be viewed as randomly inserted lines of corner-sharing square plaquettes with ferromagnetically co-aligned spins. It was recently found that such plaquettes govern low-energy spin dynamics in Fe1.1Te Zaliznyak2011 . Such proliferation of defects highlights magnetic frustration, where a number of different magnetic ground states, including the plaquette state, have nearly equal energy.Yin2010 This situation is further demonstrated by the temperature evolution of the magnetic neutron intensity, where, upon cooling, one observes competition of a number of states with different propagation vectors. We note that incommensurate magnetic orderings were also observed in a number of Se-doped compositions, Fe1+yTe1-xSex. Khasanov2009 ; Bendele2010 ; Babkevich2010
Finally, our observations suggest that the weak lattice distortion and antiferromagnetic LRO are only symptomatic of the much stronger interactions driving the low-temperature physics in iron telluride. This leads us to question the applicability of traditional theoretical approaches, which treat electronic and magneto-structural properties in terms of expansions around the low- ordered states. The low-temperature physics in Fe1+yTe, and, perhaps, in ferropnictides, too, is likely governed by rather high-energy degrees of freedom, such as the temperature-dependent orbital hybridization and interaction of local spins with itinerant electrons.Yin2010 ; Yin2011 Upon being properly integrated, these interactions should render an effective low-energy model governing the magneto-structural transition. Is there such a model, which could explain the extreme sensitivity to small amount of doping and the multi-critical phase diagrams common to Fe1+yTe and 122 pnictides?
The effect of the small Fe off-stoichiometry, , on the electronic structure of Fe1+yTe being negligible Rodriguez2011 , Fe interstitials/vacancies can simply be viewed as a source of random magnetic and electric fields, which frustrate magnetic correlations, locally impact lattice distortion, and change the inter-layer structural and magnetic couplings. An effective description of the spontaneous HTT symmetry breaking in layered systems under these conditions is provided by the quasi two-dimensional (2D) anisotropic random field Ising model (ARFIM) considered by Zachar and Zaliznyak.ZacharZaliznyak2003 While this model was originally proposed for the superlattice formation associated with charge ordering in layered perovskites at half-doping, it is straightforwardly transplanted to the case of an orthorhombic distortion of the HTT lattice. The two possible choices of distortion at a given lattice site, which are related by the rotation, now play the role of an Ising variable. The effective ferromagnetic interaction accounts for the strain energy, arising where these two different states are adjacent to each other, and is strongly anisotropic (quasi-2D) in layered systems. The most important property of the ARFIM model is in its extreme sensitivity to very small amounts of disorder in the quasi-two-dimensional limit, which is inherited from the disordered nature of RFIM in 2D.ZacharZaliznyak2003 In fact, recent studies have found that ARFIM can account for signatures of nematicity observed in cuprates,LohCarlsonDahmen2010 and thus is probably also a good starting point for understanding similar findings in ferropnictides Nakajima2011 .
A natural generalization of the ARFIMZacharZaliznyak2003 to cases where the monoclinic lattice distortion and/or strong magneto-elastic coupling result in four choices of the ground state, such as for the magneto-structural transitions in 122 ferropnictides and 11 chalcogenides, is provided by the four-state () anisotropic random field Potts model (ARFPM). Similarly to the ARFIM, the ordering in the ARFPM is governed by the 3D fixed point of the random field Potts model (RFPM). In RFPM, however, it is of the first order for small disorder.BlankensteinShapirAharony1984 A multicritical point, where the transition changes from first-order into a continuous one with the increasing random field strength, is expected in this case.BlankensteinShapirAharony1984 Hence, such a model could provide natural explanation for our current results, suggesting that such a multicritical point exists in Fe1+yTe, as well as for the recent findings in 122 ferropnictides.Nakajima2011 ; ZhaoDai2008 ; LiDai2009 ; ChuFisher2009 ; Rotundu2010 ; Nandi2010 ; Ni2010 ; Kim2011 ; Marty2011
Acknowledgements.
We acknowledge discussions with and valuable assistance on different stages of this project from C. Petrovic, G. Xu, E. Carlson, and A. Tsvelik. This work was supported by the Materials Sciences and Engineering Division, Office of Basic Energy Sciences (BES), US Department of Energy (DOE), under Contract No. DE-AC02-98CH10886. The work at the SNS was sponsored by the Scientific User Facilities Division, Office of BES, US DOE, under Contract No. DE-AC05-00OR22725.References
- (1) K.-W. Yeh, T.-W. Huang, Y.-l. Huang, T.-K. Chen, F.-C. Hsu, P. M. Wu, Y.-C. Lee, Y.-Y. Chu, C.-L. Chen, J.-Y. Luo, D.-C. Yan, M.-K. Wu, Europhys. Lett. 84, 37002 (2008).
- (2) F.-C. Hsu, J.-Y. Luo, K.-W. Yeh, T.-K. Chen, T.-W. Huang, P.-M. Wu, Y.-C. Lee, Y.-L. Huang, Y.-Y. Chu, D.-C. Yan, M.-K. Wu, Proc. Natl. Acad. Sci. U.S.A. 105, 14262 (2008).
- (3) Jinsheng Wen, Guangyong Xu, Genda Gu, J. M. Tranquada, R. J. Birgeneau, arXiv:1104.0695 (unpublished).
- (4) S. Margadonna, Y. Takabayashi, Y. Ohishi, Y. Mizuguchi, Y. Takano, T. Kagayama, T. Nakagawa, M. Takata, K. Prassides, Phys. Rev. B 80, 064506 (2009).
- (5) J. Guo, S. Jin, G. Wang, S. Wang, K. Zhu, T. Zhou, M. He, X. Chen Phys. Rev. B 82, 180520(R) (2010).
- (6) W. Bao, Y. Qiu, Q. Huang, M. A. Green, P. Zajdel, M. R. Fitzsimmons, M. Zhernenkov, S. Chang, M. Fang, B. Qian, E. K. Vehstedt, Jinhu Yang, H. M. Pham, L. Spinu, Z. Q. Mao Phys. Rev. Lett. 102, 247001 (2009).
- (7) E. E. Rodriguez, C. Stock, P. Zajdel, K. L. Krycka, C. F. Majkrzak, P. Zavalij, M. A. Green, arXiv:1105.1937v1; Phys. Rev. B 84, 064403 (2011).
- (8) C. Stock, E. E. Rodriguez, M. A. Green, P. Zavalij, J. A. Rodriguez-Rivera, Phys. Rev. B 84, 045124 (2011).
- (9) S. Li, C. de la Cruz, Q. Huang, Y. Chen, J. W. Lynn, J. Hu, Y.-L. Huang, F.-C. Hsu, K.-W. Yeh, M.-K. Wu, and P. Dai, Phys. Rev. B 79, 054503 (2009).
- (10) A. Martinelli, A. Palenzona, M. Tropeano, C. Ferdeghini, M. Putti, M. R. Cimberle, T. D. Nguyen, M. Affronte, C. Ritter, Phys. Rev. B 81, 094115 (2010).
- (11) X. Liu, C.-C. Lee, Z. J. Xu, J. S. Wen, G. Gu, W. Ku, J. M. Tranquada, and J. P. Hill, Phys. Rev. B 83, 184523 (2011).
- (12) M. A. Kastner, R. J. Birgeneau, G. Shirane, Y. Endoh, Rev. Mod. Phys. 70, 897-928 (1998).
- (13) J. W. Lynn, P. C. Dai, Physica C 469, 469 (2009).
- (14) M. D. Lumsden, A. D. Christianson, J. Phys. Condens. Matter 22, 203203 (2010).
- (15) M. Nakajima, T. Lianga, S. Ishidaa, Y. Tomiokab, K. Kihoub, C. H. Leeb, A. Iyob, H. Eisakib, T. Kakeshita, T. Itob, S. Uchida, Proc. Natl. Acad. Sci. U.S.A. 108, 12238 (2011).
- (16) J. Zhao, Q. Huang, C. de la Cruz, S. Li, J. W. Lynn, Y. Chen, M. A. Green, G. F. Chen, G. Li, Z. Li, J. L. Luo, N. L. Wang, P. Dai, Nature Physics 7, 953 (2008).
- (17) S. Li, C. de la Cruz, Q. Huang, G. F. Chen, T.-L. Xia, J. L. Luo, N. L. Wang, P. Dai, Phys. Rev. B 80, 020504(R) (2009).
- (18) J.-H. Chu, J. G. Analytis, C. Kucharczyk, I. R. Fisher, Phys. Rev. B 79, 014506 (2009).
- (19) C. R. Rotundu, B. Freelon, T. R. Forrest, S. D. Wilson, P. N. Valdivia, G. Pinuellas, A. Kim, J.-W. Kim, Z. Islam, E. Bourret-Courchesne, N. E. Phillips, and R. J. Birgeneau Phys. Rev. B 82, 144525 (2010).
- (20) S. Nandi, M. G. Kim, A. Kreyssig, R. M. Fernandes, D. K. Pratt, A. Thaler, N. Ni, S. L. Bud’ko, P. C. Canfield, J. Schmalian, R. J. McQueeney, A. I. Goldman Phys. Rev. Lett. 104, 057006 (2010).
- (21) N. Ni, A. Thaler, J. Q. Yan,A. Kracher, E. Colombier, S. L. Bud’ko, P. C. Canfield, S. T. Hannahs Phys. Rev. B 82, 024519 (2010).
- (22) M. G. Kim, D. K. Pratt, G. E. Rustan, W. Tian, J. L. Zarestky, A. Thaler, S. L. Bud’ko, P. C. Canfield, R. J. McQueeney, A. Kreyssig, and A. I. Goldman Phys. Rev. B 83, 054514 (2011); M. G. Kim, R. M. Fernandes, A. Kreyssig, J. W. Kim, A. Thaler, S. L. Bud’ko, P. C. Canfield, R. J. McQueeney, J. Schmalian, A. I. Goldman ibid. 83, 134522 (2011).
- (23) K. Marty,A. D. Christianson, C. H. Wang, M. Matsuda, H. Cao, L. H. VanBebber, J. L. Zarestky, D. J. Singh, A. S. Sefat, M. D. Lumsden, Phys. Rev. B 83, 060509(R) (2011).
- (24) P. C. Canfield, S. L. Bud’ko, Ni Ni, J. Q. Yan, A. Kracher, Phys. Rev. B 80, 060501(R) (2009).
- (25) N. Katayama, S. Ji, D. Louca, S.-H. Lee, M. Fujita, T. J. Sato, J. S. Wen, Z. J. Xu, G. D. Gu, G. Xu, Z. W. Lin, M. Enoki, S. Chang, K. Yamada, and J. M. Tranquada J. Phys. Soc. Jpn. 79 113702 (2010).
- (26) T. Shimojima, F. Sakaguchi, K. Ishizaka, Y. Ishida, T. Kiss, M. Okawa, T. Togashi, C.-T. Chen, S. Watanabe, M. Arita, K. Shimada, H. Namatame, M. Taniguchi, K. Ohgushi, S. Kasahara, T. Terashima, T. Shibauchi, Y. Matsuda, A. Chainani, S. Shin Science 332, 564 (2011).
- (27) I. A. Zaliznyak, Z. Xu, et al., (unpublished).
- (28) C. Stock, private communication (unpublished).
- (29) T. Hanaguri, S. Niitaka, K. Kuroki, H. Takagi, Science 328, 474 (2010).
- (30) Y. Xia, D. Qian, L. Wray, D. Hsieh, G. F. Chen, J. L. Luo, N. L. Wang, M. Z. Hasan, Phys. Rev. Lett. 103, 037002 (2009).
- (31) Y. Zhang, F. Chen, C. He, L. X. Yang, B. P. Xie, Y. L. Xie, X. H. Chen, Minghu Fang, M. Arita, K. Shimada, H. Namatame, M. Taniguchi, J. P. Hu, D. L. Feng, Phys. Rev. B 82, 165113 (2010).
- (32) Y. Lubashevsky, E. Lahoud, K. Chashka, D. Podolsky, A. Kanigel, arXiv:1107.1487v1 (unpublished).
- (33) A. Subedi, L. Zhang, D. J. Singh, M. H. Du, Phys. Rev. B 78, 134514 (2008).
- (34) L. Zhang, D. J. Singh, M. H. Du, ibid 79, 012506 (2009).
- (35) F. Ma, W. Ji, J. Hu, Z.-Y. Lu, T. Xiang, Phys. Rev. Lett. 102, 177003 (2009).
- (36) M. J. Han and S. Y. Savrasov, Phys. Rev. Lett. 103, 067001 (2009).
- (37) G. F. Chen, Z. G. Chen, J. Dong, W. Z. Hu, G. Li, X. D. Zhang, P. Zheng, J. L. Luo, N. L. Wang, Phys. Rev. B 79, 140509(R) (2009).
- (38) Rongwei Hu, E. S. Bozin, J. B. Warren, C. Petrovic, Phys. Rev. B 80, 214514 (2009).
- (39) R. Khasanov, M. Bendele, A. Amato, P. Babkevich, A. T. Boothroyd, A. Cervellino, K. Conder, S. N. Gvasaliya, H. Keller, H.-H. Klauss, H. Luetkens, V. Pomjakushin, E. Pomjakushina, B. Roessli, Phys. Rev. B 80, 140511 (2009).
- (40) M. Bendele, P. Babkevich, S. Katrych, S. N. Gvasaliya, E. Pomjakushina, K. Conder, B. Roessli, A. T. Boothroyd, R. Khasanov, and H. Keller, Phys. Rev. B 82, 212504 (2010).
- (41) P. Babkevich, M. Bendele, A. T. Boothroyd, K. Conder, S. N. Gvasaliya, R. Khasanov, E. Pomjakushina, B. Roessli, J. Phys.: Condens. Matter 22, 142202 (2010).
- (42) O. J. Lipscombe, G. F. Chen, Chen Fang, T. G. Perring, D. L. Abernathy, A. D. Christianson, Takeshi Egami, Nanlin Wang, Jiangping Hu, and Pengcheng Dai Phys. Rev. Lett. 106, 057004 (2011).
- (43) I. A. Zaliznyak, Z. Xu, J. M. Tranquada, G. Gu, A. M. Tsvelik, M. B. Stone, arXiv:1103.5073v1; Phys. Rev. Lett. 107, 216403 (2011).
- (44) K. Haule, G. Kotliar, New J. Phys. 11 025021 (2009).
- (45) A. M. Turner, F. Wang, and A. Vishwanath, Phys. Rev. B 80, 224504 (2009).
- (46) E. S. Bozin, P. Juhas, W. Zhou, M. B. Stone, D. L. Abernathy, A. Huq and S. J. L. Billinge, Journal of Applied Crystallography 42, 724 (2009).
- (47) K. S. Gavrichev, V. N. Guskov, J. H. Greenberg, T. Feltgen, M. Fiederle, K. W. Benz, J. Chem. Thermodynamics 34, 2041 (2002).
- (48) V. Tsurkan, J. Deisenhofer, A. Günther, Ch. Kant, M. Klemm, H.-A. Krug von Nidda, F. Schrettle, and A. Loidl, Eur. Phys. J. B 79, 289 (2011).
- (49) W.-G. Yin, C.-C. Lee, and W. Ku, Phys. Rev. Lett. 105, 107004 (2010).
- (50) Z. P. Yin, K. Haule, and G. Kotliar, arXiv:1104.3454 (2011).
- (51) O. Zachar and I. Zaliznyak, Phys. Rev. Lett. 91, 036401 (2003).
- (52) Y. L. Loh, E. W. Carlson, K. A. Dahmen, Phys. Rev. B 81, 224207 (2010).
- (53) D. Blankschtein, Y. Shapir, A. Aharony, Phys. Rev. B 29, 1263 (1984).