11email: ovidiuv@ing.iac.es 22institutetext: Instituto de Astronomía, Universidad Católica del Norte, Avenida Angamos 0610, Antofagasta, Chile
33institutetext: Leibniz-Institut fur Astrophysik Postdam, innoFSPECPostdam, An der Sternwarte16, 14482 Postdam, Germany
44institutetext: Instituto de Astrofísica de Andalucía (CSIC), Apto. 3004, 18080, Granada, Spain
Searching for star-forming galaxies
in the Fornax and Hydra clusters
††thanks: Based on observations acquired at Gemini South (GS-2007B-Q-53 and GS-2008A-Q-49) and ESO VLT (382.A-0409A)
Abstract
Context. The formation and evolution of dwarf galaxies is relatively difficult to understand because of their faint emission in all regimes that require large aperture telescopes.
Aims. We intend to study the evolution of star forming dwarf galaxies in clusters. We selected Fornax and Hydra clusters to complement our previous study of Virgo. On the basis of available literature data, we selected ten star-forming candidates in Fornax and another ten objects in Hydra.
Methods. We used Gemini South with GMOS to acquire images necessary to detect star-forming regions in the two galaxy samples. We then performed long-slit spectroscopy for the brightest six candidates, to derive their chemical properties. Finally, we employed the VLT with HAWK-I to observe all galaxies in the band to derive their main physical properties.
Results. We studied the morphology of our two samples, finding five objects in Fornax and six in Hydra with structures consistent with those of star-forming dwarfs, i.e., dwarf irregulars (dIs) or blue compact dwarfs (BCDs). About four other objects are probably dwarf spirals, while three objects remained undetected in both visible and near infrared. On the basis of visible bright emission lines, we derived oxygen abundances for ten star-forming candidates with values between 8.00 12+log(O/H) 8.78.
Conclusions. Most fundamental properties of star-forming galaxies in Fornax and Hydra appear similar to corresponding properties of dIs and BCDs from Virgo and the Local Volume (LV). The luminosity-metallicity and metallicity-gas fraction relations in the LV and Virgo appear to be followed by Fornax and Hydra samples, suggesting that the chemical evolution of the two clusters seems consistent with the predictions from the closed box model, although larger samples are needed to investigate the role of possible environmental effects. Star-forming dwarfs (dIs and BCDs) in different environments appear to follow different mass-metallicity relations, with more metal-rich objects tending to occupy regions of higher galaxy overdensity in the Virgo and Hydra clusters. Treated separatelly, dIs and BCDs also appear to define different mass-metallicity relations, with BCDs following a steeper relation than dIs fitted alone. Only two objects from Fornax and Hydra appear confined to the dwarf fundamental plane (FP) which does not seem to hold for most Hydra objects, suggesting that the environment has some influence. A concerted effort is necessary to acquire deep radio data for these nearby clusters in conjunction with NIR imaging and spectroscopy.
Key Words.:
galaxies – dwarf, blue compact dwarf, irregular, formation, evolution, fundamental parameters, photometry, structure; infrared – galaxies1 Introduction
The concept of “compact galaxies” was introduced by Zwicky (zwi65 (1965, 1970)) to describe any galaxy whose surface brightness is brighter than 20 mag arcsec-2 in any wavelength range. The term “blue” later used refers to compact galaxies observed on blue and red plates (Zwicky zwi70 (1970); Zwicky & Zwicky zwi71 (1971)), thus blue compact galaxies must be blue in colour. Thuan & Martin (thu81 (1981)) later introduced the term ”blue compact dwarf” (BCD) to characterize three main properties of compact galaxies: their low luminostity (), small size (diameter kpc), and strong narrow emission lines superposed on a nearly flat continuum. The star-forming rates of BCDs are very high (between 0.1 and 1 yr -1) in comparison with those in dwarf irregular galaxies (dIs), while their metallicities are low (oxygen abundance between 1/50 and 1/2 ) relative to with giant galaxies, which implies that they have young ages (Kunth & Ostlin, kun00 (2000)).
Despite much research in the past three decades, many aspects of the evolution of star forming galaxies remain unclear. Thuan (thu85 (1985)) suggested that BCDs may be bursting dIs, while Kunth & Ostlin (kun00 (2000)) argued that the gas of dIs is insufficient to generate a starburst bright enough to transform a dwarf into a BCD. Richer & McCall (ric95 (1995)) proposed that the descendants of BCDs may be dwarf spheroidal galaxies (dSphs) rather than dIs, while James (jam94 (1994)) argue that dIs are fundamentally distinct from BCDs, with no simple evolutionary connection between the two classes.
Star-forming dwarf galaxies appear to be quite abundant in the Universe. Of the 451 galaxies in the Local Volume (LV, Mpc), about 70% (315 galaxies) have late Hubble types ( or ), most being dI candidates (Karachentsev et al. kar04 (2004)). About 64 BCDs and BCD candidates were classified in the Virgo cluster (Bingelli, Sandage & Tammann bin85 (1985)), while about 114 BCDs are listed as closer than 57 Mpc (Paz, Madore & Pevunova paz03 (2003)). Unfortunatelly, to date there has been no similar census in other nearby clusters. We know that the environment of galaxies can influence many processes regulating their star formation activity, hence their photo-chemical evolution. Therefore, environmental parameters of star-forming galaxies should be taken into account when trying to understand better the star formation process. The observation of star-forming dwarf galaxies populating some dense cluster neighborhood should shed light on the role played by the environment on their evolution.
Using facilities in the North, we have studies star-forming dwarf galaxies located both in the LV and the Virgo cluster to scrutinize their physical and chemical properties and compare their evolution (Vilchez & Iglesias-Paramo vil03 (2003); Vaduvescu et al. vad05 (2005); Vaduvescu, Richer & McCall vad06 (2006); Vaduvescu, McCall & Richer vad07 (2007)). BCDs and dIs appear to be physically related, showing similar correlations between size, near-infrared (NIR) luminosity, mass and internal energy, and populating the same “fundamental plane” (Vaduvescu & McCall vad08 (2008)) which also appears to be shared by dwarf ellipticals (dEs). The chemical properties of BCDs and dIs also confirm a possible link between the two classes via the metallicity-luminosity relation (), which appears to be tighter in NIR than in visible, although BCDs appear to share a relation steeper than dIs. The position of a dwarf on the diagram may indicate that there is a relation between the depth of the potential well and the dwarf’s ability to retain gas during the course of evolution. Nevertheless, to examine the prevalence of past gas flows, it is necessary to go beyond the relation and study the relationships between metallicity, gas fraction, and mass.
The most popular framework of galaxy evolution is the “closed box model” (Searle & Sargent sea72 (1972); Pagel pag97 (1997)). According to this model, a galaxy consists initially of gas with no stars and no metals. The stellar initial mass function (IMF) is assumed to be constant with time. Stars that end their life are assumed to enrich immediately the interstellar gas with metals, and throughout its entire life the galaxy evolves as a closed system with no mass inflow or outflow. In a simple closed box model, relations between metallicity, gas fraction, and mass have been proposed to exist (Pagel pag97 (1997); Lee et al. lee03 (2003); Vaduvescu, McCall & Richer vad07 (2007)) but to decouple the closed box model from the environmental influences, we need to study star-forming dwarfs in a broad range of clusters.
The metallicity of BCDs is commonly defined as the oxygen abundance of their HII regions detected using observations. Abundances can be measured precisely using the direct method based on the faint [OIII]4363 line (Osterbrock ost89 (1989)) or less precisely using a few bright line methods (Pagel pag97 (1997); McGaugh mg94 (1994); Pilyugin pil00 (2000)). The direct method is more difficult to apply to distant dwarfs, although accurate results in Virgo have been obtained using the 4m WHT telescope (Vilchez & Iglesias-Paramo vil03 (2003)) and the 8m Gemini North telescope (Vaduvescu, Richer & McCall vad06 (2006)) which have encouraged us to measure abundances of dwarfs in other nearby clusters using 8m telescopes. Studying galaxies in clusters, we have been able to reduce the scatter in distance-dependent parameters such as the absolute magnitude and mass. In contrast, if we had selected candidates in low density intergalactic regions, one could of course avoid the perturbation effects of the dense environment, being able to consider the simple closed box model regime.
This is the beginning of a long-term project to study star-forming galaxies in clusters and compare their properties and evolution with that of isolated objects in the LV. In the present paper, we scrutinize two small samples of star-forming candidate galaxies, specifically dwarfs (dIs and BCDs) located in two southern clusters, namely Fornax and Hydra. On the basis of the available literature, we selected and observed in each cluster ten star-forming candidates using Gemini with GMOS for pre-imaging and long-slit spectroscopy and VLT with HAWK-I for NIR imaging. In Section 2, we present the observations and Section 3 includes the results. In Section 4, we discuss morphological aspects, chemical abundance analysis, and the fundamental relations of the two cluster samples. Finally, in Section 5 we draw the conclusions.
2 Observations
This paper represents our first attempt to compare galaxy formation and evolution in nearby clusters. Vaduvescu, McCall & Richer (vad07 (2007)) used spectroscopy acquired with Gemini North and other data taken with 4m WHT telescope (Vilchez and Iglesias-Paramo, vil03 (2003)) to study a sample of star-forming dwarfs in Virgo and compare its evolution with a field sample. To address possible environmental effects, star-forming dwarfs located in other clusters should be studied further, and the most accessible clusters remain the closest ones ( Mpc). Nevertheless, emission from dwarfs located at these distances is extremely difficult to detect, hence 8-10m class telescopes are necessary for this work.
2.1 Cluster selection and membership
Fornax is the second closest cluster after Virgo and is located at Mpc () according to a measurement by the surface brightness fluctuations method using HST/ACS data (Blakeslee et al. bla09 (2009)) which closely matches a previous Cepheid value derived by Madore et al. (mad98 (1998)). Although smaller and poorer in terms of members than the Virgo cluster, Fornax is more compact than Virgo and is expected to include about 340 likely members in its central square degree region (Ferguson fer89 (1989)).
Hydra cluster is located at Mpc () based on the infrared surface brightness fluctuation method (Jensen, Tonry & Luppino jen99 (1999)), thus appears to be the fourth closest cluster after Virgo, Fornax and Antlia. Easily observable from the south hemisphere, Fornax and Hydra are natural choices for the search and study of star-forming dwarf galaxies in different environments. For each cluster, we selected our targets based on existing papers and data available from the literature.
A complete coverage of the two clusters should cover some 40 square degrees, and is virtually impossible to conduct using regular application time. For the sample selection, we took into account the scarce X-ray mapping available in the literature, to help us to avoid high density environments. Unfortunately, these maps are small and cover only the central regions of the clusters. For Fornax, we examined the Chandra X-ray image of the central field covering the square field close to the giant elliptical NGC 1399 (Chandra website 111http://chandra.harvard.edu/photo/2004/fornax/more.html concluding that all our ten sample objects are located outside of this field. For Hydra, we used the ROSAT X-ray map containing the central field of the cluster close to the giant elliptical NGC 3311 (NASA, nas03 (2003)) and the X-ray map from Fitchett & Merritt (fit88 (1988)), neither of which include any of our sample objects. Despite the uncertain mapping of our sample with respect with the X-ray cluster density, our datasets represent a step forward in studying star-forming galaxies in two neighbouring clusters, being complementary to some previous work (Ferguson fer89 (1989), Drinkwater et al 2001a ; 2001b , Duc et al. duc99 (1999, 2001)).
2.1.1 Fornax cluster
The Fornax Cluster Catalog (FCC - Ferguson fer89 (1989)) was constructed based on the visual inspection of the photographic plates taken with the 2.5m du Pont telescope at Las Campanas Observatory. The catalog lists 340 likely members and 2338 likely background galaxies. Because very few radial velocities were available, the criteria used to distinguish cluster members from background galaxies were based mostly on visual morphological analyse. The author identifies in the catalog a total of 35 BCD candidates, but notes that there are very few actual members of the cluster, classifying only five BCDs as definite or likely members while another 30 appear as dI candidates (classes ImIV or ImV).
Drinkwater et al. (2001a ) acquired multi-fiber spectroscopy with the 1.2m UK Schmidt telescope to study the evolution and star formation of dwarf galaxies in the central 6 degree field of the Fornax cluster. Their work focused on compact galaxies in the search for new BCDs that were not included in the FCC. They measured redshifts for 516 galaxies of which 108 were found to be members of the cluster. The spectroscopy of 19 FCC candidate BCDs confirm the morphological FCC findings that most candidates are background galaxies, with only three cluster members being detected to have emission. Only a few (12) objects were measured to have different membership classifications from those of the FCC.
Schroder, Drinkwater & Richter (sch01 (2001)) presented a new set of HI observations of member galaxies of the Fornax cluster using the Parkes radio telescope. This paper provides the HI fluxes, gas masses, and velocity widths of 66 galaxies, including 5 BCD/Im candidates some having measurements. Taking into account these literature data and the morphological appearance of all candidates, we selected ten objects to be observed in the Fornax cluster, which are included in the first part of Table 1.
2.1.2 Hydra Cluster
Studies of dwarfs in Hydra cluster are scarcer than for Fornax, most probably owing to Hydra’s distance of more than twice that of Fornax. Duc et al. (duc99 (1999)) presented HI, optical, and near-infrared photometric data of a sample of HI-selected dwarf galaxy candidates in Hydra. Their optical imaging was taken in the and bands with the 1.5m Danish telescope in La Silla, the NIR imaging in band with the ESO/MPG 2.2m telescope, and the radio data was acquired at high resolution with the Nancay decimetric radiotelescope to follow up a former VLA survey.
A second paper of the same authors (Duc et al. duc01 (2001)) presents a spectroscopic follow-up of a sample of 15 HI-selected dwarf galaxies in Hydra cluster. Long-slit spectra were obtained along an axis including the nucleus and the brightest HII region with the ESO 3.6m telescope. Only in one galaxy could the faint [OIII]4363 line be detected to derive oxygen abundances via the direct method, while for ten other dwarfs the abundance could be calculated via other bright line methods and for four others no line detection was possible. On the basis of the analysis of the surface brigtness profiles, existing spectroscopy, radio data ( line) and their close morphological inspection, we selected 10 objects to be observed in Hydra. They are included in the second part of Table 1.
2.2 Gemini Imaging and Spectroscopy
Two proposals were observed by Gemini South in queue mode in 2007B for Fornax (Run ID: GS-2007B-Q-53) and in 2008A for Hydra cluster (Run ID: GS-2008A-Q-49). During both runs, we used the GMOS South camera (GMOS-S) to acquire imaging of ten star-forming candidates in Fornax and ten candidates in the Hydra cluster. The GMOS-S camera consists of three CCDs pixels each with pixel size m, resulting in a pixel mosaic covering on-sky field. All observations were taken in band 3 weather conditions, using binning mode (pixel scale of ) that yielded a total field of view of . For all targets, we used the Ha_G0336 (referred to as from now on) and r_G0326 (referred to as from now on) Gemini filters. Gemini imaging is presented in Figure 1 and the observing log is given in Table 1.
We processed the pre-imaging frames (only the central CCD containing all galaxies) using the appropriate bias and flat field (in and ), then combined the individual frames to produce the final reduced images. The “net” images were reduced via the usual procedure measuring about 20-30 stars, whose measured magnitudes we scaled in order to subtract images from the original images. The runs were observed in non-photometric band 3 conditions, so for the images we derived zero points using stars in the observed fields with available magnitudes from the USNO-B1 catalogue (Monet et al. mon03 (2003)). The USNO-B1 magnitudes are in the photographic system and given at two different epochs, hence we averaged the two values. We acknowledge the possible need for a small shift between photographic and Gemini system, but we report that we found our total magnitudes to be consistent, within the errors, with those available in the literature.
The spectroscopic raw frames were processed using the Gemini GMOS routines within IRAF222IRAF is distributed by the National Optical Astronomical Observatories, which are operated by the Association of Universities for Research in Astronomy, Inc., under cooperative agreement with the National Science Foundation.. Biases and flat-fields were combined with the tasks “gbias” and “gsflat”, respectively. The following standard stars were observed: LTT 1788, LTT 1020, LTT 4364, and LTT 1377 for the Fornax run (one star observed every science night), while LTT 3218 and LTT 7378 were observed for the Hydra run (each in one night). Science targets and standard stars were reduced with task “gsreduce”, which applies the overscan correction, subtracts off the bias, mosaics the three detectors of GMOS interpolating across the chip gaps for science data, and applies flat-field correction. The wavelength calibration was established from the CuAr arcs with the task “gswavelength” giving residuals 0.1 Å. The science spectra were wavelength calibrated by applying the task “gstransform”. We use the task “gsextract” to extract the one dimensional spectra performing sky subtraction. The sensitivity function was created by using the task “gsstandard”, and finally we flux calibrated the science images making use of the task “gscalibrate”. The statistical uncertainty in the instrument response fitting across the spectrum from blue to red sides is .
2.3 VLT NIR Imaging
imaging was observed in service mode at VLT in 2008B for Fornax and Hydra clusters (Run ID: 382.A-0409). We used the HAWK-I camera, which consists of 4 HAWAII 2RG detectors with a pixel scale of resulting in a pixel mosaic covering field of view. For all targets, we used the filter.
The image reduction was done using REDNIR, an IRAF script that subtracts each sky image compiled from two neighbouring galaxy images, allowing a close temporary and spatially mapping of the rapid variation in the sky level and pattern (Vaduvescu and McCall vad04 (2004)). The reduced VLT imaging is included in Figure 2 and the observing log is given in Table 1. To reduce our photometry, we calculated zero-points based on the available 2MASS stars visible in the observed fields. The number of available 2MASS stars was about five in each Fornax field and around ten in the denser Hydra fields. In a few cases, only two or three 2MASS stars were available, but the zeropoints are consistent with the remainder, with both sets of fields having a standard deviation around 0.1 mag.
3 Results
3.1 Imaging
We present next the imaging observations acquired at Gemini (in the visible) and VLT (in the NIR).
3.1.1 R and Imaging
For the pre-imaging phase, we observed the whole sample with Gemini, namely 10 galaxies in Fornax and 10 in Hydra. Images in , , and reduced for both clusters are presented in Figure 1.
Only six galaxies of Fornax have detectable net emission in the right panel of Figure 1. In FCC 32, FCC 33, and FCC 35, some bright compact emission is clearly visible at their centres, with FCC 33 having the brightest core elongated in the east-west direction and FCC 35 being surrounded by a diffuse envelope that includes three small knots to the south and west of the core. FCC 102 and FCC 120 clearly display two separated knots, more compact and closed in the first case and more diffuse and separated in the second; a rather similar distribution can be seen for the three central knots of FCCB 905. The galaxy FCC 128 seems to contain a very faint and diffuse component, which is however unmeasureable about the noise level. The relevant physical properties of the Fornax selected galaxies are presented in Table 2.
Although all Hydra galaxies have different morphologies and rich details in the and frames presented in Figure 1 (most of them diffuse in ), they show no clear net measurable emission at the limit of detection of this work; this is possibly a consequence of either the poor weather observing conditions, an imperfect continuum removal, or both. Nonetheless, we should bear in mind that our Hydra targets are three times more distant than Fornax.
On the basis of the images observed in relatively good conditions with Gemini, we studied the surface photometry and colors of all 20 objects. By using both Gemini and the VLT surface photometry taken with similar aperture and resolution instruments and assuming to be more fundamental than in tracing mass, we derived the profiles based on the fitted parameters in . Using both and photometry, we compiled the color profiles of all detected galaxies.
The zero points in were derived using stars in the field with magnitudes taken from the USNO-B1 catalog, so these should be regarded with caution, although we note that the color profiles are unaffected by the zero point. The surface brightness profiles in and color profiles are included in the right panel of Figure 2. The derived total apparent magnitudes and the physical properties of Hydra galaxies are presented in Table 2.
3.1.2 imaging
For the NIR imaging, we observed the whole sample with the VLT, namely 10 galaxies in Fornax and 10 in Hydra. To perform the surface photometry, we employed the STSDAS package (ELLIPSE task) in IRAF using an iterative approach that converged for fixed parameters (centre, ellipticity, and position angle), which are common for the two ( and ) bands. We initially derived fitting parameters using images that we later compared to the parameters obtained from our fits. Within our estimated errors (about 0.5 arcsec in position for centres, 0.1 in ellipticity, and 5 degrees in position angle), the fits in and bands agree very well. The sky contibution in the visible is much fainter than in the NIR, so profiles in Figure 2 in are deeper than the corresponding ones in (the profiles in extend outside our plotted common region), while the associated error bars are much smaller in (smaller than the symbols used).
To fit the surface brightness profiles of star-forming dwarf galaxies, we used the same approach as in our previous work, by modeling profiles of dIs with a hyperbolic secant (“sech”) function (Vaduvescu et al. vad05 (2005)) and those of BCDs with a sech function plus a Gaussian (Vaduvescu, Richer & MacCall vad06 (2006)). In this sense, we used the NFIT1D function of FITTING package under IRAF. In Figure 2, we plot with a solid continuous line the sech fit (for dIs and BCDs), with a dashed line the Gaussian (for BCD-like objects only), and with a thin line the total that closely follows the profiles of BCDs (see for example the plots for FCCB 905 or H1031-2632).
In Table 2, we include our derived physical parameters for the galaxies detected in in Fornax and Hydra. Ellipticity and position angle (measured positively counter-clockwise) are given in the first two columns. Total magnitudes were measured by integrating growing ellipse apertures, while sech magnitudes were derived by modeling the profiles with the sech (where represent its central surface brightness expressed in mag/arcsec2 and is the scale radius expressed in arcsec) to which we eventually add a Gaussian function only for BCD-like objects to model a central outburst. The calculated semimajor radius (in arcsec) at mag/arcsec2 are given next. We provide in column 9 the total magnitudes in band, which are measured in a similar way integrating growing ellipse apertures. Absolute magnitudes in , MSK (column 10), were calculated from sech using the published distance modulus (DM) for the two clusters, namely 31.51 for Fornax (Blakeslee et al. bla09 (2009)) and 33.31 for Hydra (Jensen, Tonry & Luppino jen99 (1999)). The HI velocity line widths, quoted in column 11 (in km/s), were taken from the HYPERLEDA database, and the original reference for these data is given in column 12. The logarithms of the galaxy stellar mass (column 13), gas mass (column 14), and baryonic mass (column 15) all in solar units (M⊙) are presented, as well as the gas fraction (column 16), calculated following Vaduvescu, McCall & Richer (vad07 (2007)).
3.2 Spectroscopy
Taking into account our fluxes and the complementary information available in the literature (abundances and radio data) and on the basis of the time available to perform spectroscopy, we selected six star-forming dwarf candidates in Fornax and six similar objects in Hydra to be observed spectroscopically with Gemini. From these, we obtained emission line spectra with the necessary signal-to-noise ratio for all selected Hydra objects and only four observed Fornax galaxies. In the following section, we present our results obtained from spectroscopy.
3.2.1 Line fluxes
Emission-line fluxes were measured in the one-dimensional spectra extracted for each object using the IRAF task SPLOT, which integrates the line flux over a locally fitted continuum. To minimize the errors associated with the relative (to H) flux calibration over the full wavelength range (especially for faint lines), line ratios were referred to the flux of the nearest Balmer line, H or H.
Figure 3 displays the calibrated spectra of the galaxies of Fornax and Hydra clusters for which spectroscopic observations were sucessful. We provide some illustrative spectra for our sample which include FCC 35 (Fornax) exibiting a typical HII-region-like spectrum with a very faint continuum and strong emission lines, and H1031-2818 (Hydra) displaying absorption in the Balmer series and faint emission lines.
We derived the logarithmic reddening constant, C(H), from the ratios of the optical Balmer recombination lines, while simultaneously solving for the effects of underlying Balmer absorption using equivalent width, EWabs. We assumed that the equivalent widths of the main Balmer absorption lines were approximately the same, as expected for young ionizing clusters (Kobulnicky & Skillman ks96 (1996); Kobulnicky, Kennicutt & Pizagno k99 (1999)). The correction for underlying absorption ranged from equivalent widths equal to zero up to values around 8 Å. The values derived for C(H) vary from nearly zero to 0.9. The line-flux errors were calculated using the expression (e.g. Kehrig et al, keh08 (2008))
| (1) |
where is the standard deviation in the continuum near the emission line, is the width of the region used to measure the line in pixels, is the spectral dispersion in Å/pixel, and EW represents the equivalent width of the line. The error in C was computed by formally propagating the uncertainties of the line strengths,
| (2) |
Reddening-corrected emission-line intensities, normalized to H are presented in Table 3 for the objects observed along with their extinction coefficient C(H). The errors in the fluxes quoted in Table 3 include the contribution of the uncertainty in C(H) as well as of the uncertainty in the instrument response calibration; systematic errors were not included.
3.2.2 Nebular analysis
The electron density, ne, was calculated from the [SII]6717/6731 ratio using the prescriptions of the five-level atom FIVEL program available in the IRAF nebular package (Shaw & Dufour sd94 (1994)). The electron density values range from 100 cm-3, obtained for nearly one half of the sample, to values as high as 417 cm-3 for FCC 33.
We could not detect the temperature-sensitive line [OIII]4363 in any of our spectra, thus were unable to obtain direct oxygen abundance measurements. Different empirical and theoretical metallicity calibrations have been calculated over the past two decades as an alternative to estimating oxygen abundances without any direct electron temperature measurements (e.g. Pagel et al. pag79 (1979); Alloin et al. a79 (1979); Edmunds & Pagel ep84 (1984); McGaugh mg91 (1991); Vilchez & Esteban ve96 (1996); Pettini & Pagel pp04 (2004); Pilyugin et al. p06 (2006); Pilyugin, Vilchez & Thuan pvt10 (2010)). These calibrations are referred to as strong-line methods since they are based on strong emission-line ratios (e.g. [OII]3727; [OIII]4959, 5007; [NII]6584; [SII]6717, 6731; [SIII]9069, 9532).
For the determination of abundances in this paper, we used three methods: (i) the calibration of R23 [R23 ([OII]3727 + [OIII]4959,5007)/H], via the theoretical models of McGaugh mg91 (1991) (hereafter M91) and analytical expressions in Kobulnicky et al. (k99 (1999)); (ii) the empirical calibration of the parameter N2 (N2 [NII]6584/H) proposed by Pettini & Pagel (pp04 (2004); hereafter PP04); and (iii) the empirical calibration of the strong emission lines of oxygen, nitrogen, and sulfur (Pilyugin, Vilchez & Thuan pvt10 (2010); hereafter PVT10).
The relation between 12 + log(O/H) and log(R23) is double valued, showing an ambiguity between the high and low abundance branches and a turnover region centered around 12 + log(O/H) (e.g. M91; Miller & Hodge mh96 (1996); Olofsson o97 (1997)). Efforts have been made to refine the calibration of the R23 parameter. One of the most popular methods is the calibration by M91, which is based on photoionization models. As commonly accepted, we assumed that all the galaxies with log([NII]/[OII]) correspond to the lower oxygen abundance branch of this calibration, and conversely, the high abundance prediction of R23 correspond to objects showing log([NII]/[OII]) (e.g., McGaugh 1994; van Zee et al. 1998b; Contini et al. 2002). The typical uncertainties quoted for R23 empirical abundances are dex. In the turnover region, corresponding to log(R23) 0.9, the abundance predictions become more uncertain. Thus, in this work, we derived a conservative oxygen abundance of 12 + log(O/H) = 8.20 using the method for those objects in the sample presenting log (R23) 0.9.
The N2 parameter (N2 [NII]6584/H) offers several advantages, because it involves easily measurable lines that are available for a wide redshift range (up to z 2.5). The N2 versus O/H relation seems monotonic and the [NII]/H ratio does not depend on reddening correction or flux calibration. The drawbacks are that the [NII] lines can be affected by other excitation sources (see Van Zee et al. vz98 (1998)). In addition, N2 is sensitive to ionization conditions and relative N/O abundance variations. PP04 revised the N2 index, using 137 extragalactic HII regions. The uncertainty in the metallicity determination based on this calibration amounts to 0.3 dex.
PVT10 proposed some improved empirical calibrations for the determination of metallicity in HII regions. The authors refer to these calibrations as ONS calibrations since they are based on the strong emission lines of oxygen, nitrogen, and sulfur. They use both N2/R2 (=[NII]6548,6584/[OII]3727) and S2/R2 (=[SII]6717, 6731/[OII]3727) ratios as temperature and metallicity indices. PVT10 found that the rms difference between oxygen abundance derived from the ONS calibration and an electron temperature based oxygen abundance is within 0.075 dex.
For each galaxy studied in our paper, we adopted an average oxygen abundance obtained from the average of the three (O/H) values obtained from the three calibrators R23, N2, and ONS. However, in the computation of the R23 abundance we follow the [NII]/[OII] criterion, as indicated above, to help us select between the upper or lower branch values. In Table 3, we include in parenthesis the rejected R23 values.
Table 3 includes the physical conditions, oxygen abundances, and their corresponding errors for our sample galaxies in Fornax and Hydra clusters.
4 Discussion
We now discuss the results obtained for individual objects based on our Gemini and VLT observations. We compared and complemented our findings with existing data from the literature. We consider the morphological and chemical analysis of our galaxies as well as the implications of our results within the framework of the fundamental relations governing galaxy evolution.
4.1 Morphological analysis
4.1.1 Fornax cluster
FCC 32 is our second brightest Fornax object with a dense nucleus in all , , and net images. The poor conditions of the Gemini observations prevented us from resolving any details in the and images, but the VLT image observed in good seeing () conditions unveiled about 6 off-center regions (see the middle image in Figure 2 in which about five regions appear as extended knots and one has a stellar appearance (the western-most one at 03:24:52.52, -35:26:07.4 at J2000). Both and profiles are convex in the outer part and do not resemble a sech profile, while the colour is reddish mag. All these characteristics suggest a non-dwarf like structure for the host of FCC 32. Michielsen et al. (mic04 (2004)) observed this galaxy in and with the VLT in very good seeing, unveiling a bright core with a few bright knots associated with emission clouds similar to our findings, and classified this object as a non-nucleated dwarf elliptical (dE2). The authors found a total apparent magnitude of 14.52 mag, which matches very closely our Gemini findings mag. These results do not support the findings of Drinkwater et al. (2001a ), who classified this object as a BCD based on the detected emission observed with the UK Schmidt 1.2m telescope. Our net image also shows an important emission source in this galaxy.
FCC 33 is our brightest Fornax object and shows a very elliptical-like morphology. Our Gemini and images show a bright nucleus with two extensions to the east and west. The FWHM VLT image shows a very bright compact central nucleus at 03:24:58.51, -37:00:35.4 (J2000) with many patchy regions distributed mostly along the east-west direction. Two arm structures are clearly apparent towards the east (winding north) and west (appearing to wind south), as can be seen in the right plot in Figure 2. Both and radial profiles do not appear to conform to a sech profile fit, while the colour is reddish ( mag decreasing slightly from centre to outer regions). All these findings suggest that FCC 33 has a spiral structure and is not a canonical dwarf galaxy. These results are not in the line with the findings of Drinkwater et al. (2001a ), who classified this object as a BCD based on the spectroscopy taken with the UK Schmidt telescope. The total absolute magnitude inferred from our photometry, for the adopted distance modulus of Fornax, seems consistent with this suggestion.
FCC 35 is our third brightest Fornax object showing some patchy star-like regions over its surface in both and . The net image shows a very bright core surrounded by two neighboring patches to the north and other faint two to the south-east and south-west. The very compact relatively central nucleus (located slightly to the North of our centre fit along the principal axis) could be detected in both and net images at 03:25:04.21, -36:55:35.6 (J2000), this structure being much fainter in . The profile could be fitted with a sech plus a Gaussian. The colour varies between 1.5 and 3 mag, being blue at centre and redder at the outside. All these properties suggest that FCC 35 could be a BCD. These results agree with the findings of Drinkwater et al. (2001a ), who classified this object as a BCD based on the emission found in the UK Schmidt spectra, and also with the findings of Schroder, Drinkwater & Richter (sch01 (2001)) who suggested a BCD classification.
FCC 98 was not detected by the VLT in our band, being barely detected by Gemini in and , but cannot be seen in the net image. We could not find any other observations of this galaxy in the literature.
FCC 102 is our faintest Fornax galaxy and is relatively small, its and profiles being closely fitted by a sech model, this object having a blueish mag color. The pure image shows two compact features with a brighter elongated knot towards the south-east at 03:32:10.89, -36:13:04.8 (J2000) and a fainter and more compact one towards the north-west at 03:32:10.34, -36:12:59.8 (J2000). All these results suggests that FCC 102 could be a dI galaxy and agree with the findings of Drinkwater et al. (2001a ), who detected emission, as well as those of Schroder, Drinkwater & Richter (sch01 (2001)) who found HI emission in the Parkes radio data, both of these findings suggesting star formation activity.
FCC 120 is a relatively faint object with a profile modeled well by a sech with a mag blueish colour indicative of a dI galaxy. The VLT seeing allowed us to resolve a few regions (possibly bright star clusters), many patchy details being also visible in the image taken in poorer binning at Gemini. These findings are similar to those obtained by Schroder, Drinkwater & Richter (sch01 (2001)), who detected HI emission consistent with star formation activity, and with the results of Seth et al. (set04 (2004)), who detected 12 star clusters in this galaxy using the HST, some visible as knots in our images.
FCC 128 is faint and relatively small, having a profile closely modeled by a sech law and the mag blueish colour resembling that of a dI. The net image does not show any particular feature. The very good VLT HAWK seeing allowed us to resolve one starlike source and to identify an additional pair of patches close to the center of this galaxy. The results agree with those of Schroder, Drinkwater & Richter (sch01 (2001)) who found HI emission.
FCC 129 was not detected in . The galaxy was barely detected in , showing some fuzzy structure closed to its centre at 03:34:07.89, -36:04:12.7 (J2000). Its net image does not show any emission. We could not find any other observations of this galaxy in the literature.
FCC 130 was not detected in , being also barely visible in and showing no net emission. Four structures close to the centre of the image are possibly associated with this galaxy, three of them being colinear along the east-west direction and another one visible to the south. At least two of these structures appear star-like (). We could not find any previous observations of this galaxy in the literature.
FCCB 905 was detected in both visible and NIR. Two very closed patches are visible in near the centre, and three patches are visible in the and net images at 03:33:57.24, -34:36:42.3 (J2000), the brightest being the most central, and the other two being fainter at 03:33:57.39, -34:36:39.4 (J2000) and 03:33:57.15, -34:36:46.5 (J2000). Interestingly, a fuzzy compact and very small elliptical patch could be detected in eastward and very close to the two north patches at 03:33:57.57, -34:36:42.6 (J2000) but this object (possibly a background elliptical galaxy?) is undetected in our Gemini imaging in all bands. After removing this unknown object, the profile of FCCB 905 could be modeled with a sech plus Gaussian. The mag colour is blueish, thus FCCB 905 could be a BCD. These results agree with Drinkwater et al. (2001a ) who found emission suggesting a BCD classification for this object, previously identified (wrongly) with a background galaxy by Ferguson (fer89 (1989)).
4.1.2 Hydra cluster
H1031-2818 represents by far our brightest Hydra object, showing a very bright core in and but presenting no net emission. Both and -to a lesser extent- images denote the appearance of some spiral structure (see the second zoomed image in Figure 2). The surface profile in could be fitted by a sech model, but the one in seems more linear, while the colour is mag. Duc et al. (duc99 (1999)) detected this galaxy in HI. They also imaged it in and bands with the Danish 1.5m and in band with the ESO/MPG 2.2m telescope, finding exponential-like surface brightness profiles, similar to our findings. In the band, these authors found a total magnitude mag, which is close to -but fainter than- our VLT value mag.
H1031-2632 has a relatively faint nucleus in all bands, being surrounded by some fuzzy irregular envelope (see its and images in Figure 1. Its profile could be well fitted with a sech plus a Gaussian, and the color mag seems blueish, so these suggest that this object is a BCD. Duc et al. (duc99 (1999)) imaged this object in and with the Danish telescope, finding surface brightness profiles almost exponential, similar to our Gemini results in . These authors could not detect this object in .
H1032-2638 is an elliptical object, quite bright in but faint in . Thanks to the good Gemini seeing in band, this object clearly shows at its centre two bright stellar structures (visible also in and ) and two closer fainter unresolved features, reminiscent of a cross lensing effect. To fit the surface photometry, we removed the two brighter stellar-like structure via IMEDIT. Its surface brightness profile in could be fitted by a sech, while the color profile mag is very blue, so that H1032-2638 could be a dI. Duc et al. (duc99 (1999)) derived and exponential profiles that flatten near the galaxy centre (i.e., similar to our sech law) but could not detect this object in .
H1034-2758 has a very compact central elliptical core that is clearly visible in and endowed in a fuzzy elliptic envelope oriented in the opposite direction of the core and showing some diffuse patches located mostly to the south and west. The core is also visible in but the envelope is less pronounced. Surface profiles in and are similar and could not be fitted with either a sech or Gaussian. The colour profile is blueish, mag. This object was also observed in and by Duc et al. (duc99 (1999)) who showed light profiles similar to ours, and the authors also detected this objects in but their reported magnitude mag is fainter than our VLT mag.
H1035-2756 presents a very strange shape for a galaxy: in both and frames it clearly shows a circular ring structure reminiscent of a planetary nebula, showing a light deficit clearly visible towards the centre and one bright non-stellar compact patch (as compared to field stars measured in poor seeing) located slightly to the east plus a few other fainter fuzzy patches appearing embedded in the ring envelope. The image does not show the envelope but only the brightest patch embedded in diffuse emission. Consequently, the light profile for this object winds twice, but the profile could be fit with a sech plus a Gaussian. The colour is blueish, mag, so this object could be a BCD candidate, although its ring in visible light remains to be explained. A round fuzzy patch could be observed in all bands located about 1 arcmin to the south-east of H1035-2756 ( 10:37:414.41, -28:12:56.6 at J2000) having an apparent diameter of about 10 arcsec. NED does not contain data for this object, so we can speculate that it is a new dwarf galaxy in Hydra, possibly a dI. Duc et al. (duc99 (1999)) also observed this peculiar object in the optical, and their profiles are very similar to our profile.
H1035-2605 is our first brightest object in and the second one in . It shows a very elliptical morphology, being a very long object with a very compact central core visible in all bands and some light deficit line centered along its north-eastern side resembling a dust lane. Its image shows a very extended and thin linear structure. Its light profile in being quite convex and unable to be modeled with any of our dwarf models, while its colour profile decreases from a central very red color mag to some blueish color in the outskirts mag. Given all these findings, H1035-2605 resembles a spiral viewed edge-on. The light profiles of Duc et al. (duc99 (1999)) in both visible and NIR are similar to ours, and their reported colour is red, similar to our findings.
H1035-2502 is a very faint and small object showing a slightly brighter prolonged core in and while its image is very diffuse and extremely faint. Its profile can accurately modeled with a sech and its color profile looks blueish, mag, so this object might be a dI. This agrees with the findings of Duc et al. (duc99 (1999)), whose visible profiles are sech-like and who managed to detect the object in HI.
H1035-2740 is our faintest Hydra object in both and , having an elliptical morphology with a bright star-like non-central core and some patchy structure visible mostly in towards the north-eastern side. Its profile could be modeled with a sech and its colour profile is blueish, mag, thus this could be a dI. This result agrees with the finding of Duc et al. (duc99 (1999)) that the visible light profiles flatten towards the centre and that HI was observed throughout the galaxy, although these authors could not detect this object in .
H1038-2733 is our second faintest Hydra object, which is very small and diffuse in both visible and NIR. Its morphology looks strange: it has an extended core similar to a horizontal portion of a ring surrounded by two faint arm-like structures that make the overall structure of the galaxy appear elliptical. The surface is extremely faint and the profile could be fitted with a sech, while the color profile is blueish, mag. Given these findings, we regard this object as a dI candidate. This result agrees well with the findings of Duc et al. (duc99 (1999)), whose light profiles in the optical flatten towards the centre and who found that some HI emission was possible associated with this object.
H1038-2730 has a central elliptical core in , appearing clearly surounded by about three tight arms (see Figure 1). Its image also contains a small elliptical core embedded in an elliptical fainter envelope, better visible to the south-east. Its light profiles look more linear than dwarf-like, so we regard this object as a background spiral. This agrees with Duc et al. (duc99 (1999)) whose light profiles in visible are almost exponential, similar to our findings in both visible and NIR. These authors classify this object as an edge-on system with isophote twisting without any evidence of current star-formation and some HI line width intriguingly broad.
4.2 Chemical abundance analysis
We discuss in this section our derived abundances and compare them with existing data from the literature. We adopt the standard uncertainty of dex for our derived abundances using the bright line methods discussed above.
4.2.1 Fornax cluster
For FCC 32, we measured seven emission lines, including the bright lines , , and from which we calculated 12+log(O/H) = 8.68 and 8.15 using the upper and lower predictions of R23, respectively. For this galaxy, R23 upper was selected since log([NII]/[OII]) -1.0. Using the indicator, we obtained 12+log(O/H) = 8.60 and from the ONS calibration we derived 12+log(O/H) = 8.52 dex. The adopted oxygen abundance, taken as the average among the three methods, is 12+log(O/H) = 8.60 dex. This high abundance implies that it is an old object, in accordance with our morphological findings, thus FCC 32 is definitely not a typical star-forming dwarf galaxy.
The spectrum of FCC 33 does not exhibit all the emission lines required for the application of the R23 and ONS calibrations. For this galaxy, we only used the indicator from which we derived 12+log(O/H) = 8.55 dex. This relatively high O/H value suggests that it is a quite evolved object, in accordance with our morphological results, thus FCC 33 does not appear to be a star-forming dwarf galaxy.
FCC 35 is the galaxy with the highest signal-to-noise ratio spectrum of our Fornax sample, for which we measured 13 emission lines. Using the indicator, we derived a metallicity 12+log(O/H) = 7.87 dex; the ONS calibration gives us 12+log(O/H) = 7.81, while 12+log(O/H) = 8.20 was assumed from the R23 method since log(R23). The adopted abundance, 12+log(O/H) = 8.00 dex, suggests that it is a young object, consistent with our morphological findings.
FCC 905 has nine measurable emission lines in its spectrum, based on which we derived 12+log(O/H) = 8.19 and 8.20 using the N2 indicator and R23 method, respectively; from the ONS calibration we calculated 12+log(O/H) = 8.09. The average O/H gives us 12+log(O/H) = 8.16 for this object.
Two objects from Fornax did not show any emission lines, namely FCC 102 and FCC 120. We could not find any previous oxygen abundance determination for our Fornax sample to compare with our findings.
4.2.2 Hydra cluster
The spectrum of H1031-2632 does not contain the emission lines needed to derive the oxygen abundances via the N2 and ONS calibrations. We adopt 12+log(O/H) = 8.20 dex, as obtained from the R23 method because log(R23). Duc et al. (duc01 (2001)) acquired spectra for this object using the ESO 3.6m telescope but could not reliably detect any emission line.
H1031-2818 shows seven emission lines from which we derived 12+log(O/H) = 8.65 dex using the N2 method and 12+log(O/H) = 8.59 from the ONS calibration. The R23 upper and lower branches provide 12+log(O/H) = 8.98 and 7.53 dex, respectively. However, in the computation of the final O/H for this galaxy, we consider only the high metallicity prediction of R23 since log([NII]/[OII]) -1.0. Finally, we adopt 12+log(O/H) = 8.78 for this object. Duc et al. (duc01 (2001)) detected 10 emission lines for this object, deriving an abundance 12+log(O/H) = 8.81 using the R23 upper branch and 8.82 using the N2 method, both values close to our findings.
From the spectrum of H1035-2502, we measured nine emission lines. We derived 12+log(O/H) = 8.47 and 8.28 from the high and low metallicity predictions of R23. Using the ONS calibration, we find 12+log(O/H) = 7.99, while the N2 method provides 12+log(O/H) = 8.19. We adopt 12+log(O/H) = 8.17, selecting the R23 lower branch since log([NII]/[OII]) for this galaxy.
H1035-2605 has seven emission lines with measured fluxes. We derived 12+log(O/H) = 8.56 using the N2 indicator, finding 8.78 for the R23 upper branch and 7.93 for the R23 lower branch. Because this galaxy shows log([NII]/[OII]), we use the R23 upper branch in the computation of the final abundance value. From the ONS calibration, we find 12+log(O/H) = 8.50. Finally, we adopt an abundance of 12+log(O/H) = 8.63. Duc et al. (duc01 (2001)) measured nine lines for this object, deriving 12+log(O/H) = 8.65 from the method and 8.54 using the R23 upper branch, which are in agreement with our results, within the errors.
Both H1035-2740 and H1035-2756 were observed only over the blue spectral range. We were unable to use the N2 and ONS calibrations owing to the lack of the nitrogen and sulfur emission lines. According to the R23 method, we assumed 12+log(O/H) = 8.20 for both galaxies, since they show log(R23) 0.90 placing the two galaxies in the turnover region of the R23 calibration (see Section 3.2.2 for details). For H1035-2740, Duc et al. (duc01 (2001)) found 12+log(O/H) = 7.84 based on a few indicators. Using the R23 lower branch, the same authors derived 12+log(O/H) = 7.95 for H1035-2756.
4.3 Fundamental relations
4.3.1 The fundamental plane
Using a sample of dIs from the LV having known accurate distances, Vaduvescu & McCall (vad08 (2008)) derived the so-called dwarf fundamental plane (FP) linking photometrical parameters (the central surface brightness and the “sech” magnitude) to the velocity linewidths derived via radio data. In this paper we use data for 34 objects published there. McCall et al. (mcc11 (2011)) augmented the FP dataset with an additional 16 objects, enlarging the FP sample to 50 objects from the LV, refining the FP to the relation
| (3) |
In Figure 4, we plot with the dashed line the dI FP defined based on this sample of dIs (solid circles), taking into account data to be published soon (McCall et al. mcc11 (2011)).
A useful method for examining the possible effects of the environment on the evolution of star-forming galaxies is to compare the properties of field objects with those of galaxies located in dense clusters (e.g. Vilchez vil95 (1995); Vaduvescu and McCall vad08 (2008); Ellison et al. elli09 (2009)). In this sense, we probed the FP using a sample of star-forming dwarf galaxies (mostly BCDs and a few dIs) located in the Virgo cluster (Vaduvescu, Richer & McCall vad06 (2006)) by assuming a common distance to Virgo (Freedman et al. fre01 (2001)). We found that most dwarfs in Virgo lie on the FP defined by the field dIs, thus BCDs and dIs appear to be similar structurally and dynamically. The scatter of Virgo dwarfs is larger, possibly because of cluster depth effects and/or the action of some environmental effects.
The depth and substructure of a cluster should both be taken into account when studying distance-dependent parameters such as the absolute magnitude of a galaxy. Some previous studies of Virgo pointed out clear evidence to the three-dimensional substructure of the cluster (e.g., Gavazzi et al. gav99 (1999)), so that Gavazzi et al. (gav05 (2005)) published a revised list including 355 late-type members of Virgo located in seven clouds (A, E, S, N - at 17 Mpc, B - at 23 Mpc, and W and M - the most distant clouds, at 32 Mpc). On the basis of this list, we correct the distance modulus for two dwarfs in our Virgo sample, that is VCC 24 and VCC 144 (located in clouds M and W, respectively), , while for the remaining objects we retain our formerly adopted distance modulus from Freedman et al. (fre01 (2001)). In Figure 4, we overlay with solid triangles our updated sample of star-forming dwarfs in the Virgo cluster. As one can observe, most Virgo objects, including VCC 24 and VCC 144, are located now very close to or on the FP defined by the LV dwarfs, confirming that the cluster has no major enviromental influences on our selected Virgo sample of star-forming dwarfs.
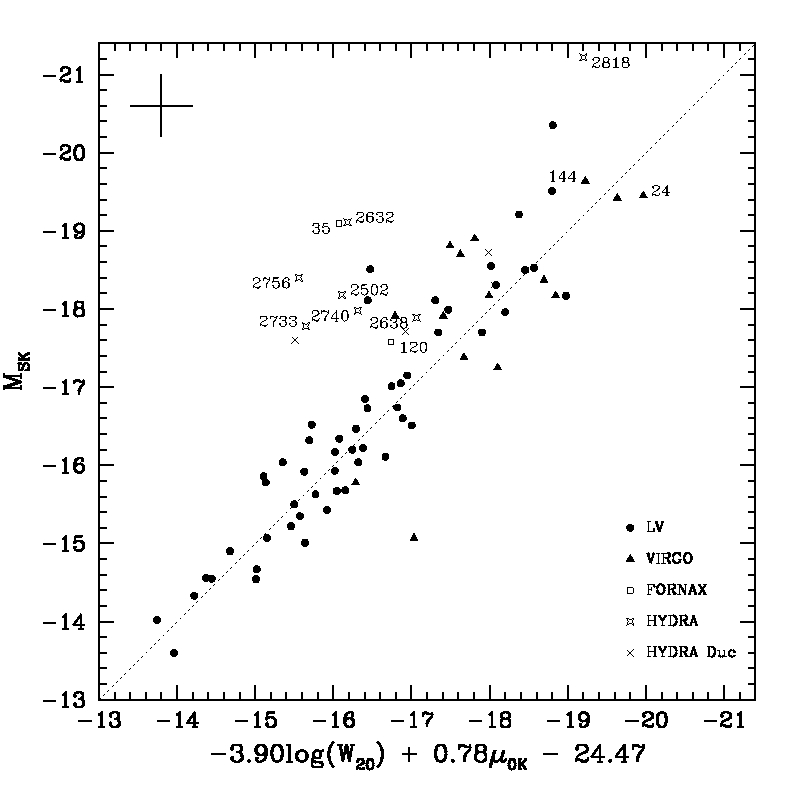
Only three dwarfs from our Fornax sample have published data (Schroeder et al. sch01 (2001)), while all objects in our Hydra sample have radio data (McMahon mcm93 (1993); Duc et al. duc99 (1999)). We include their values in Table 2 together with their reference source. Among these objects, only two galaxies in Fornax (FCC 35, FCC 120) and seven galaxies in Hydra have luminosity profiles consistent with dI or BCD profiles. We plot these objects on the dwarf FP in Figure 4 using open squares for Fornax objects and open starred symbols for Hydra objects, labeling only their last four digit names (for the sake of clarity). As one can observe, only two dwarfs from Fornax and Hydra (FCC 120 and H1032-2638) appear to be consistent (within the scatter) with the FP fit, while the majority of Hydra objects are located well above, towards the upper-left side of the plot.
We assessed the effect of an uncertainty in the distance for Hydra, for which we adopted the single distance found in the literature, namely Mpc (Jensen et al. 1999). Nevertheless, two main findings advocate that no such a distance effect could be responsible for such a large shift of most Hydra objects in the FP. The first finding is that most Hydra objects do fit the other three metallicity plots (presented next). The second finding is that to fit the plane, most Hydra points need a vertical shift (in absolute magnitude) of about 3 mag below, which means some 15 Mpc shift in distance, which is about three times larger than the uncertainty admitted by Jensen et al. Given this, we suggest that the environment has some some kind of influence for Hydra, e.g. causing the relatively low internal (gas) rotation. We closely inspected the published HI profiles of these Hydra galaxies, discarding any abnormal effects. On the other axis of the plot, absolute MSK magnitudes were derived from a sech fitting and appear to follow the model, as we describe in the next section.
To check for possible cluster environmental effects, we calculated the cluster-centric distances for the objects in both samples with respect to the cluster centres reported by NED. For Fornax, the NED centre coincides with Chandra centre, while for Hydra this is only away from the ROSAT field centre. Fornax galaxies reside between and from the cluster centre, from about 0.3 to 1.1 Mpc (projected at a 20 Mpc cluster distance) compared with apparent radius of the cluster (Ferguson, fer89 (1989)), which is about 1 Mpc. Hydra objects are located between and away from the cluster centre, namely from about 0.4 to 1.0 Mpc (projected at a 46 Mpc cluster distance) compared with radius of the cluster (Fitchett and Merritt, fit88 (1988)), which is about 1.3 Mpc. The available X-ray maps cover only from the centre of Fornax and for Hydra, being too small to include any object from our samples located in the outer regions of the two clusters.
We analysed all the objects observed by Duc et al. (duc99 (1999); duc01 (2001)), finding three more HI-rich dwarf galaxies with NIR, spectral, and radio data, in addition to another galaxy having only NIR and spectral data. We include these objects in Table 4 and compare them with our samples. Using cross symbols, we overlay these objects in Figure 4, adopting for them total magnitudes instead of sech magnitudes. Three galaxies are located close to the FP, and one object, H1038-2733, resides to the left.
More observations are needed for a larger sample of star-forming dwarf galaxies across the entire extent of the Hydra and Fornax clusters to study in great depth the environmental hypothesis suggested by the above results. Since several of the currently invoked environmental effects are strongly related to the density and spatial distribution of the intergalactic medium (Boselli & Gavazzi bos06 (2009)), a first test should be done using the X-ray distribution of these clusters. Unfortunately, we could not carry out this exercise based on the present small available X-ray coverage of the two clusters.
4.3.2 Luminosity - metallicity relation
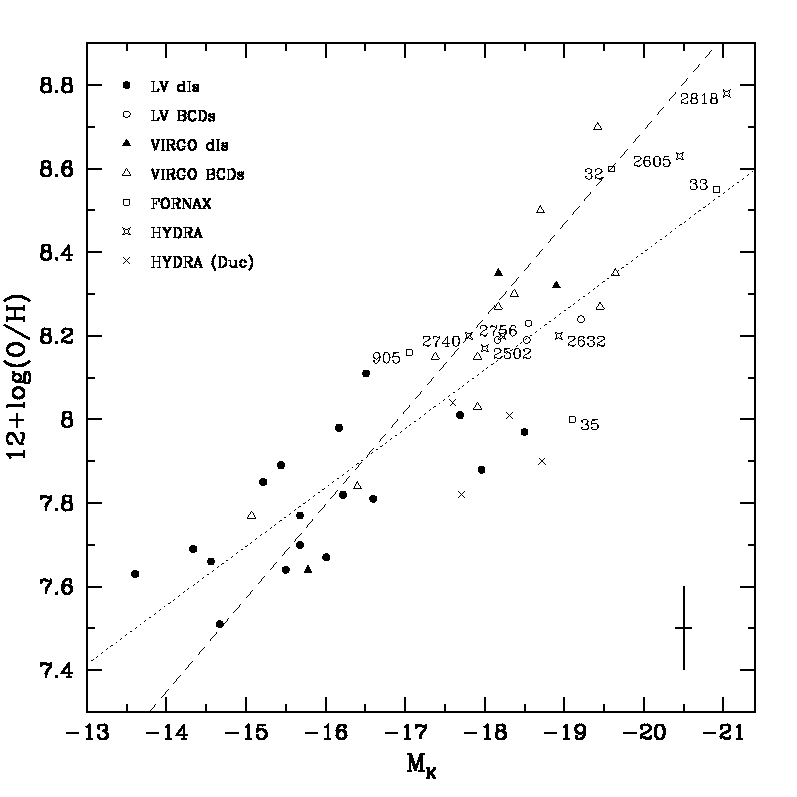
The galaxy NIR emission is believed to be a more reliable tracer than visible light of the for the stellar mass of the old (more than 3 Gyr) populations in star-forming galaxies (Vaduvescu et al. vad05 (2005)), hence band can be successfully used to help us measure the stellar mass of a galaxy. Moreover, NIR light and specifically that of the band is a more robust probe than any visible bands for studying the chemical evolution of star-forming dwarf galaxies, particularly the luminosity - metallicity () relation (Vaduvescu, McCall & Richer vad07 (2007); Saviane et al. sav08 (2008); Guseva et al. gus09 (2009)). On the basis of a sample of 25 dIs and 14 BCDs from the LV and Virgo cluster, Vaduvescu, McCall & Richer (vad07 (2007)) derived the relations for dIs and BCDs (plotted with a dotted and a dashed line, respectively, in Figure 5). These relations have a goodness of the fit of 0.10 and 0.11 dex, respectively, and the BCDs relation is slightly steeper than the one for dIs.
In the Figure 5, we plot the data for four Fornax dwarfs and six Hydra objects from our sample using available data. Using cross symbols, we overlay the other four Hydra galaxies from Table 4 (Duc et al. duc99 (1999); Duc et al. duc01 (2001)), adopting for them total magnitudes instead of sech magnitudes. One can observe that most points from our data-set appear to be consistent with these relations (within the errors), with only 2-3 outliers, among which there is only one object from our samples, namely FCC 35. The average uncertainty in metallicities derived with bright line methods is 0.2 dex, so that each Fornax and Hydra data point on the diagram should be regarded with caution and as being subject to a possible vertical shift by this amount.
4.3.3 Mass - metallicity relation
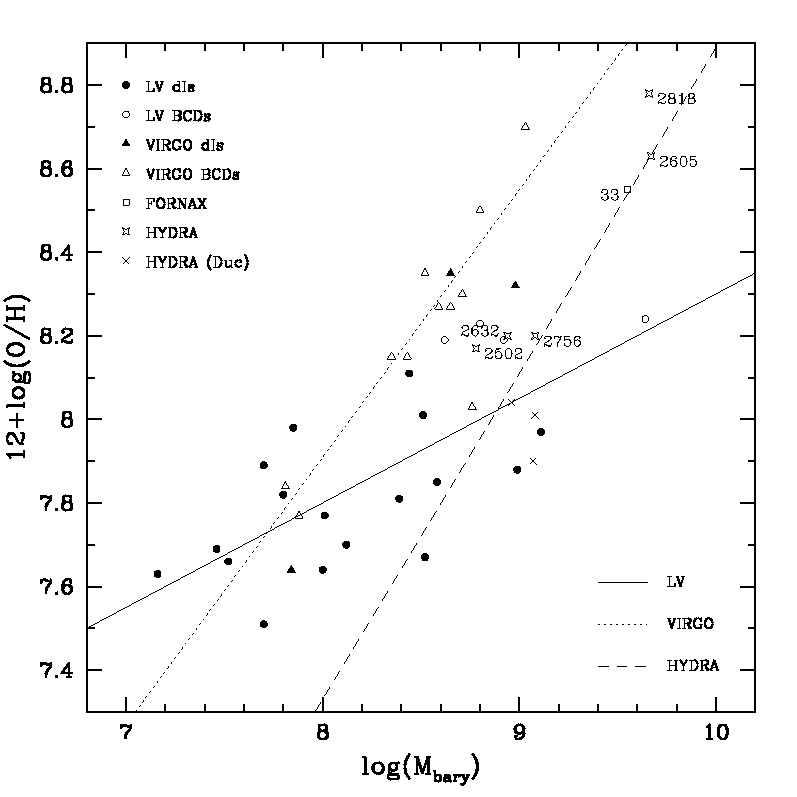
To examine the relation between galaxy mass and metallicity, one should go beyond stellar mass to assess baryonic mass, which is defined to consist only of the mass contained in stars and gas. This quantity is significant especially in a star-forming galaxy where the gas mass can be a substantial part of the total mass budget. Radio observations of the hydrogen species is known to provide such data based on the flux of the 21cm observations, but this line is rarely detected for faint objects and requires large radio dishes. Only one Fornax object and five Hydra objects from our sample have the requested data available, from which we calculated gas masses using the same relations as in Vaduvescu, McCall & Richer (vad07 (2007)). We included in Table 2 the logarithm of the stellar mass, gas mass, and baryonic mass, which are all given in Solar units. In Figure 6, we plot our samples, together with the comparison samples for Virgo and LV. With cross symbols, we overlay three other objects with data from Duc et al. (duc99 (1999); duc01 (2001)). There is a conspicuous outlier in our sample, namely the Hydra galaxy H1031-2818, which has been suggested to be a possible spiral galaxy candidate.
Star-forming dwarfs (dIs and BCDs) located in isolation appear to follow a different mass-metallicity relation than similar galaxies located in the Virgo cluster (Vaduvescu, McCall & Richer, vad07 (2007)), thus it is very important to study this relation further taking into account our LV, Virgo, and Hydra samples. On the basis of 21 star-forming dwarfs in the LV (17 dIs and 4 BCDs), we derived the following mass-metallicity fit using a classical fit that minimizes the standard error of a linear distribution (LINEST function in Linux/OpenOffice)
| (4) |
On the basis of 14 star-forming dwarfs in Virgo cluster (3 dIs and 11 BCDs), we derive the mass-metallicity relation
| (5) |
Using 8 star-forming dwarf candidates with available data in Hydra cluster (our 5 galaxies plus 3 objects from Duc et al. duc01 (2001)), we derive the mass-metallicity relation
| (6) |
Unfortunately we have only one Fornax object with available data, so we cannot check the Fornax mass-metallicity relation. In Figure 6, we draw with a solid line the LV fit (dIs and BCDs), with a dotted line the Virgo fit, and with a dashed line the Hydra fit.
One can observe that the slope of the fit is shallower than for the LV sample (0.25), and higher for the Virgo sample (0.64) and the Hydra sample (0.78). This could suggest an environmental trend for star-forming dwarfs in the mass-metallicity relation, with more metal-rich objects favouring regions of higher galaxy overdensity, namely Virgo and Hydra clusters. This result is in the line with Petropoulou et al. (pet11 (2011)), who demonstrated that some star-forming dwarfs located at higher densities in the Hercules cluster tend to be more metal rich than the lower density counterparts.
Treated as separate entities, dIs and BCDs appear to follow different mass-metallicity relations, with BCDs following a steeper relation than dIs alone. This could be checked for both LV and Virgo samples, and the result is similar to the luminosity-metallicity relation addressed by Vaduvescu, McCall & Richer (vad07 (2007)).
4.3.4 Metallicity - gas fraction relation
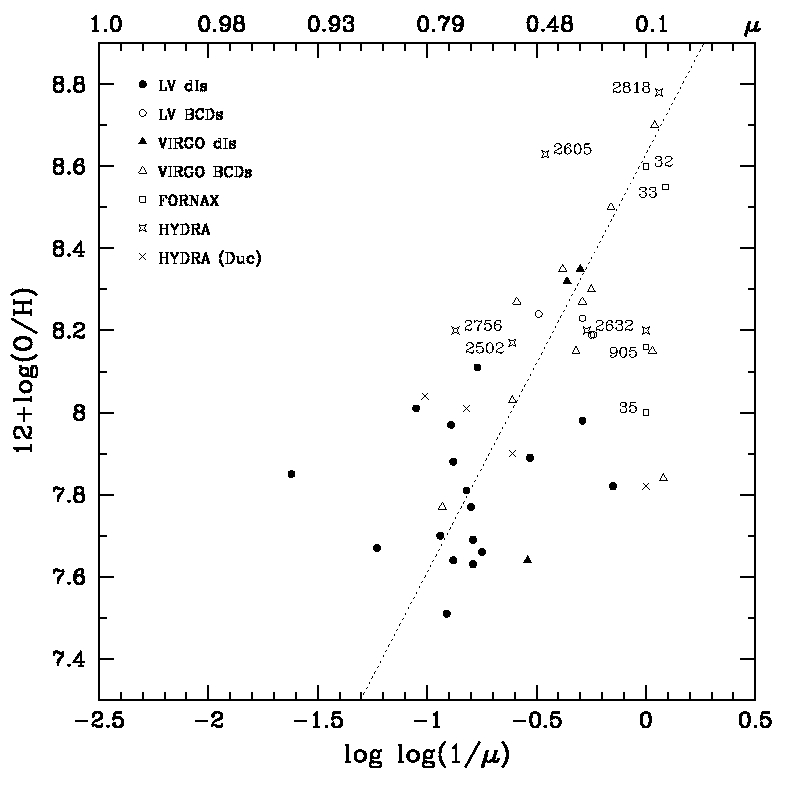
Lee et al. (lee03 (2003)) studied the closed box model of the chemical evolution of star-forming dwarf galaxies, which predicts a linear correlation between metallicity and the logarithm of the logarithm (”log-log“) of the inverse of the gas fraction. We studied this relation for our (small) Fornax and Hydra sample of galaxies for which these data are available. We include in Table 2 the gas fraction for the galaxies of the two cluster samples, and in Figure 7 we plot with a dotted line the metallicity - gas fraction relation, derived in Lee et al. lee03 (2003), as well as the points of our published LV and Virgo samples. With cross symbols, we add three other Hydra galaxies with data available from Duc et al. (duc99 (1999); duc01 (2001)), which all match the relation quite well. Although our two Fornax and Hydra samples are not statistically significant, one can see that most objects appear to be described by this relation. This suggests that the chemical evolution of star-forming galaxies in Fornax and Hydra is consistent with the theoretical expectations for a closed box model, thus seems compatible with a (relatively) unperturbed evolution.
5 Conclusions
Two samples of ten star-forming galaxy candidates in Fornax cluster and ten objects in Hydra cluster have been selected based on data available in the literature to study their physical and chemical properties, as part of a larger project aimed to begin the study of star-forming galaxies in nearby clusters using 8-10m class telescopes. For these two samples, we acquired and imaging using Gemini/GMOS and imaging using the VLT/HAWK-I. Based on the images, we selected two sub-samples of 6 objects in Fornax and 6 objects in Hydra to be observed spectroscopicaly with Gemini/GMOS.
Taking into account the , , and imaging, we studied the morphology of the two samples, finding five objects in Fornax and six objects in Hydra that have a structure compatible with a star-forming dwarf (dI or BCD-like), while about four objects are probably spiral galaxies and another three objects are virtually undetected. Although we aimed to detect the faint [OIII]4363 line to derive accurate direct oxygen abundances, the poor weather conditions and the large distance of Hydra precluded us from detecting this line in the observed galaxies. Taking into account the emission lines measured in the Gemini/GMOS specra, we derived metallicities for ten star-forming galaxy candidates (four in Fornax and six in Hydra) corresponding to abundances in the range 8.00 12+log(O/H) 8.78.
Based on the derived physical and chemical data, we studied several fundamental relations for a small sample of star-forming galaxies with available data in Fornax and Hydra.
The luminosity - metallicity and the metallicity - gas fraction relations found for star-forming dwarfs in the LV and Virgo appear to be followed by our Fornax and Hydra sample of galaxies having available radio data. These results suggest that the chemical evolution of these galaxies in both clusters appears consistent with the predictions of a closed box model.
Star-forming dwarfs (dIs and BCDs) in different environments appear to follow different mass-metallicity relations, with more metal-rich objects tending to occupy regions of higher galaxy overdensity, namely the Virgo and Hydra clusters. Treated separatelly, dIs and BCDs also appear to define different mass-metallicity relations, with BCDs following a steeper relation than dIs fitted alone, a result similar to the luminosity-metallicity relation.
Only two cluster objects appear confined to the dwarf FP, which does not seem to hold for most Hydra objects. This suggests that the cluster environment has some effect in Hydra, while the Fornax available sample was too small to probe the FP.
Based on our observations and some scarce data available in the literature (especially in the radio), we have identified some research avenues to studying star-forming galaxies in clusters. To confirm our results, a concertated effort to acquire 21-cm observations should be conducted in conjunction with NIR imaging and spectroscopic research of nearby clusters, so that most physical and chemical data could be available for studying galaxy evolution in clusters.
Acknowledgements.
O.V. thanks to the Chilean TACs for the time allocation at Gemini South (programmes GS-2007B-Q-53 and GS-2008A-Q-49) and ESO VLT (382.A-0409A). Acknowledgements are due to Prof. Marshall McCall who suggested some important insights in the cluster and sample selection and to Dr. Henry Lee for joining the Gemini observing proposals. C.K., as a Humboldt Fellow, acknowledges support from the Alexander von Humboldt Foundation, Germany. J.M.V. and C.K. acknowledge support by projects: AYA2007-67965-C03-02, AYA2010-21887-C04-01 and Consolider-Ingenio 2010 CSD2006-00070 “First Science with GTC”, of the spanish MICINN. This research has made use of the NASA/IPAC Extragalactic Database (NED) which is operated by the Jet Propulsion Laboratory, California Institute of Technology, under contract with the National Aeronautics and Space Administration. We acknowledge the usage of the HyperLeda database (http://leda.univ-lyon1.fr - Paturel et al. 2003). Our work used IRAF, a software package distributed by the National Optical Astronomy Observatory, which is operated by the Association of Universities for Research in Astronomy (AURA) under cooperative agreement with the National Science Foundation. This research has made use of SAOImage DS9, developed by Smithsonian Astrophysical Observatory. This paper is based on observations obtained at the Gemini Observatory (Run IDs: GS-2007B-Q-53 and GS-2008A-Q-49), which is operated by the Association of Universities for Research in Astronomy, Inc., under a cooperative agreement with the NSF on behalf of the Gemini partnership: the National Science Foundation (United States), the Science and Technology Facilities Council (United Kingdom), the National Research Council (Canada), CONICYT (Chile), the Australian Research Council (Australia), Ministerio da Ciencia e Tecnologia (Brazil) and Ministerio de Ciencia, Tecnologia e Innovacion Productiva (Argentina). Special thanks are due to the Gemini staff who acquired and took care of our data, specificaly Rodrigo Carrasco, Henry Lee, Jose Gallardo, Kathleen Labrie, Claudia Winge and Pablo Candia. This paper is also based on observations made with ESO Telescopes at the La Silla or Paranal Observatories under programme ID 382.A-0409. Special thanks are due to the refferee whose comments helped us to improve the paper.References
- (1) Alloin, D., Collin-Souffrin, S., Joly, M., Vigroux, L. 1979, A&A, 78, 200
- (2) Bingelli, B., Sandage, A., Tammann, G. A. 1985, AJ, 90, 1681
- (3) Blakeslee, J. P., et al. 2009, ApJ, 694, 556
- (4) Boselli, A., & Gavazzi, G. 2006, PASP, 118, 517
- (5) Drinkwater, M. J., et al. 2001, MNRAS, 326, 1076
- (6) Drinkwater, M. J., Gregg, M. D., Colless, M. 2001, AJ, 548, L139
- (7) Duc, P. A., et al. 1999, A&AS, 136, 539
- (8) Duc, P. A., et al. 2001, A&A, 369, 763
- (9) Edmunds, M. G., & Pagel, B. E. J. 1984, MNRAS, 211, 507
- (10) Ellison, S. L., et al. 2009, MNRAS, 396, 1257
- (11) Ferguson, H. C. 1989, AJ, 98, 2, 367
- (12) Fitchett, M. & Merritt, M. 1988, ApJ, 335, 18
- (13) Freedman, W. L., et al. 2001, ApJ, 553, 47
- (14) Gavazzi, G., et al. 1999, MNRAS, 304, 595
- (15) Gavazzi, G., et al. 2005, A&A, 429, 439
- (16) Guseva, N. G., et al. 2009, A&A, 505, 63
- (17) James, O. A. 1994, MNRAS, 269, 176
- (18) Jensen, J. B., Tonry, J. L., Luppino G. A. 1999, ApJ, 510, 71
- (19) Karachentsev, I., et al. 2004, AJ, 127, 2031
- (20) Kehrig, C., et al. 2008, A&A, 477, 813
- (21) Kobulnicky, H. A., & Skillman, E. D. 1996, ApJ, 471, 211
- (22) Kobulnicky, H. A., Kennicutt, R. C., Jr., Pizagno, J. L. 1999, ApJ, 514, 544
- (23) Kunth, D. and Ostlin, G. 2000, Astronomy and Astrophysics Rev., 10, 1
- (24) Lee, H., et al. 2003, AJ, 125, 146
- (25) Madore, B. F., et al. 1998, Nature, 395, 47
- (26) McCall, M. L., Vaduvescu, O., Pozo, F., et al. 2011, submitted to A&A
- (27) McGaugh, S. S. 1991, ApJ, 380, 140
- (28) McGaugh, S. S. 1994, ApJ, 426, 135
- (29) McMahon, P. M. 1993, PhD thesis, Columbia University
- (30) Michielsen, D., et al. 2004, MNRAS, 353, 1293
- (31) Miller, B. W., & Hodge, P. 1996, ApJ, 458, 467
- (32) Monet, D. G., et al. 2003, AJ, 125, 984
- (33) NASA HEASARC: Education and Public Information website, http://heasarc.gsfc.nasa.gov/docs/objects/clusters/hydra.html
- (34) Olofsson, K. 1997, A&A, 321, 29
- (35) Osterbrock, D. E. 1989, Astrophsyics of Gaseous Nebulae and Active Galactic Nuclei (Mill Valley: University Science Books)
- (36) Pagel, B. E. J., et al. 1979, MNRAS, 189, 95
- (37) Pagel, B. E. J. 1997, Nucleosynthesis and the Chemical Evolution of Galaxies (Cambridge: Cambridge University Press)
- (38) Paturel, G., et al. 2003, A&A, 412, 45
- (39) Paz, A. G., Madore, B. F., Pevunova, O. 2003, ApJS, 147, 29
- (40) Petropoulou, V., et al. 2011, ApJ, 734, 32
- (41) Pettini, M., & Pagel, B. E. J. 2004, MNRAS, 348, L59
- (42) Pilyugin, L. S. 2000, A&A, 362, 325
- (43) Pilyugin, L. S.,Thuan, T. X., Vilchez, J. M. 2006, MNRAS, 367, 1139
- (44) Pilyugin, L. S., Vilchez, J. M. Thuan, T. X. 2010, ApJ, 720, 1738
- (45) Richer, M. G. & McCall, M. L. 1995, ApJ, 445, 642
- (46) Saviane, I., et al. 2008, A&A, 487, 901
- (47) Schroder, A., Drinkwater, M. J., Richter, O. G. 2001, A&A, 376, 98
- (48) Searle, L., & Sargent, W. L. W. 1972, ApJ, 173, 25
- (49) Shaw, R. A., & Dufour, R. J. 1994, Astronomical Data Analysis Software and Systems III, 61, 327
- (50) Seth, A., et al. 2004, AJ, 127, 798
- (51) Thuan, T. X., & Martin, G. E. 1981, ApJ, 247, 823
- (52) Thuan, T. X. 1985, ApJ, 299, 881
- (53) Vaduvescu, O. & McCall, M. L. 2004, PASP, 116, 640
- (54) Vaduvescu, O., McCall, M., Richer, M., Fingerhut, R. 2005, AJ, 130, 1593
- (55) Vaduvescu, O., Richer, M., McCall, M. 2006, AJ, 131, 1335
- (56) Vaduvescu, O., McCall, M. L., Richer, M. G. 2007, AJ, 134, 604
- (57) Vaduvescu, O. & McCall, M. L. 2008, A&A, 487, 147
- (58) van Zee, L., et al. 1998, AJ, 116, 2805
- (59) Vilchez, J. M. 1995, AJ, 110, 1090
- (60) Vilchez, J. M. & Esteban, C. 1996, MNRAS, 280, 720
- (61) Vilchez, J. M. & Iglesias-Paramo, J. 2003, ApJS, 145, 225
- (62) Zwicky, F. 1965, ApJ, 142, 1293
- (63) Zwicky, F. 1970, Advances in Astronomy and Astrophysics, Vol. 7 (New York: Academic)
- (64) Zwicky, F. & Zwicky, M. A. 1971, Catalogue of Selected Compact Galaxies and of Post-Eruptive Galaxies (Zurich: Offsetdruck)
| Galaxy | (J2000) | (J2000) | Date (UT) | Filter | Exp (s) |
|---|---|---|---|---|---|
| FCC 32 | 03:24:52.4 | -35:26:08 | Sep 13, 2007 | Ha_G0336 | 540 |
| … | … | … | Sep 13, 2007 | r_G0326 | 180 |
| … | … | … | Jan 12, 2008 | B600/480 | 1800 |
| … | … | … | Jan 10, 2008 | R400/780 | 600 |
| … | … | … | Sep 17, 2008 | K | 720 |
| FCC 33 | 03:24:58.4 | -37:00:34 | Sep 13, 2007 | Ha_G0336 | 540 |
| … | … | … | Sep 13, 2007 | r_G0326 | 180 |
| … | … | … | Jan 06, 2008 | B600/480 | 1800 |
| … | … | … | Jan 06, 2008 | R400/780 | 600 |
| … | … | … | Sep 17, 2008 | K | 720 |
| FCC 35 | 03:25:04.2 | -36:55:39 | Sep 13, 2007 | Ha_G0336 | 540 |
| … | … | … | Sep 13, 2007 | r_G0326 | 180 |
| … | … | … | Dec 28, 2007 | B600/480 | 600 |
| … | … | … | Dec 28, 2007 | R400/780 | 1800 |
| … | … | … | Sep 17, 2008 | K | 720 |
| FCC 98 | 03:31:39.2 | -36:16:35 | Sep 13, 2007 | Ha_G0336 | 540 |
| … | … | … | Sep 13, 2007 | r_G0326 | 180 |
| … | … | … | Sep 24, 2008 | K | 720 |
| FCC 102 | 03:32:10.7 | -36:13:15 | Sep 11, 2007 | Ha_G0336 | 540 |
| … | … | … | Sep 11, 2007 | r_G0326 | 180 |
| … | … | … | Jan 12, 2008 | B600/480 | 1800 |
| … | … | … | Jan 16, 2008 | R400/780 | 600 |
| … | … | … | Sep 17, 2008 | K | 720 |
| FCC 120 | 03:33:34.2 | -36:36:21 | Sep 11, 2007 | Ha_G0336 | 540 |
| … | … | … | Sep 11, 2007 | r_G0326 | 180 |
| … | … | … | Jan 06, 2008 | B600/480 | 1800 |
| … | … | … | Jan 06, 2008 | R400/780 | 600 |
| … | … | … | Sep 17, 2008 | K | 720 |
| FCC 128 | 03:34:07.1 | -36:27:57 | Sep 12, 2007 | Ha_G0336 | 540 |
| … | … | … | Sep 12, 2007 | r_G0326 | 180 |
| … | … | … | Sep 18, 2008 | K | 720 |
| FCC 129 | 03:34:07.7 | -36:04:11 | Sep 13, 2007 | Ha_G0336 | 540 |
| … | … | … | Sep 13, 2007 | r_G0326 | 180 |
| … | … | … | Sep 24, 2008 | K | 720 |
| FCC 130 | 03:34:09.2 | -35:31:00 | Sep 13, 2007 | Ha_G0336 | 540 |
| … | … | … | Sep 13, 2007 | r_G0326 | 180 |
| … | … | … | Sep 24, 2008 | K | 720 |
| FCCB 905 | 03:33:57.2 | -34:36:43 | Sep 12, 2007 | Ha_G0336 | 540 |
| … | … | … | Sep 12, 2007 | r_G0326 | 180 |
| … | … | … | Dec 29, 2007 | B600/480 | 1800 |
| … | … | … | Dec 29, 2007 | R400/780 | 600 |
| … | … | … | Sep 17, 2008 | K | 720 |
| H1031-2818 | 10:34:16.6 | -28:34:05 | Feb 03, 2008 | Ha_G0336 | 1080 |
| … | … | … | Feb 03, 2008 | r_G0326 | 360 |
| … | … | … | May 08, 2008 | B600/480 | 5400 |
| … | … | … | Apr 26, 2008 | R400/780 | 1800 |
| … | … | … | Nov 29, 2008 | K | 720 |
| H1031-2632 | 10:34:20.6 | -26:47:31 | Feb 04, 2008 | Ha_G0336 | 1080 |
| … | … | … | Feb 04, 2008 | r_G0326 | 360 |
| … | … | … | Apr 13, 2008 | B600/480 | 5400 |
| … | … | … | May 12, 2008 | R400/780 | 1800 |
| … | … | … | Dec 1, 2008 | K | 720 |
| H1032-2638 | 10:34:40.5 | -26:54:33 | Feb 03, 2008 | Ha_G0336 | 1080 |
| … | … | … | Feb 11, 2008 | r_G0326 | 360 |
| … | … | … | Dec 4, 2008 | K | 720 |
| H1034-2758 | 10:37:19.9 | -28:14:20 | Feb 08, 2008 | Ha_G0336 | 1080 |
| … | … | … | Feb 08, 2008 | r_G0326 | 360 |
| … | … | … | Dec 4, 2008 | K | 720 |
| H1035-2756 | 10:37:38.6 | -28:12:25 | Feb 03, 2008 | Ha_G0336 | 1080 |
| … | … | … | Feb 03, 2008 | r_G0326 | 360 |
| … | … | … | May 01, 2008 | B600/480 | 5400 |
| … | … | … | Dec 4, 2008 | K | 720 |
| H1035-2605 | 10:37:41.0 | -26:20:55 | Feb 03, 2008 | Ha_G0336 | 1080 |
| … | … | … | Feb 03, 2008 | r_G0326 | 360 |
| … | … | … | Apr 14, 2008 | B600/480 | 5400 |
| … | … | … | Apr 29, 2008 | R400/780 | 1800 |
| … | … | … | Nov 29, 2008 | K | 720 |
| H1035-2502 | 10:37:51.3 | -25:18:07 | Feb 03, 2008 | Ha_G0336 | 1080 |
| … | … | … | Feb 03, 2008 | r_G0326 | 360 |
| … | … | … | May 12, 2008 | B600/480 | 5400 |
| … | … | … | Apr 27, 2008 | R400/780 | 1800 |
| … | … | … | Dec 4, 2008 | K | 720 |
| H1035-2740 | 10:38:11.9 | -27:56:14 | Feb 03, 2008 | Ha_G0336 | 1080 |
| … | … | … | Feb 03, 2008 | r_G0326 | 360 |
| … | … | … | Apr 26, 2008 | B600/480 | 5400 |
| … | … | … | Dec 8, 2008 | K | 720 |
| H1038-2733 | 10:40:26.6 | -27:48:52 | Feb 03, 2008 | Ha_G0336 | 1080 |
| … | … | … | Feb 03, 2008 | r_G0326 | 360 |
| … | … | … | Dec 3, 2008 | K | 720 |
| H1038-2730 | 10:40:59.4 | -27:45:42 | Feb 04, 2008 | Ha_G0336 | 1080 |
| … | … | … | Feb 04, 2008 | r_G0326 | 360 |
| … | … | … | Dec 8, 2008 | K | 720 |
| Ref | log M∗ | log MG | log Mbary | ||||||||||||
| FCC 32 | 0.3 | -25 | 11.92 | — | — | — | — | 14.50 | (-19.59) | — | — | (9.06) | — | — | — |
| FCC 33 | 0.6 | +80 | 10.60 | — | — | — | — | 13.56 | (-21.91) | 63 | (1) | (9.99) | 8.46 | 9.56 | 0.08 |
| FCC 35 | 0.6 | +15 | 13.11 | 12.41 | 19.51 | 9.3 | 27.77 | 14.97 | -19.10 | 56 | (1) | 8.86 | — | — | — |
| FCC 102 | 0.3 | -45 | 14.37 | 14.22 | 20.61 | 6.7 | 13.10 | 15.73 | -17.29 | — | — | 8.14 | — | — | — |
| FCC 120 | 0.5 | +35 | 14.00 | 13.93 | 20.66 | 9.3 | 17.70 | 15.74 | -17.58 | 141 | (1) | 8.26 | — | — | — |
| FCC 128 | 0.2 | +30 | 14.27 | 14.16 | 20.09 | 5.1 | 12.39 | 16.06 | -17.35 | — | — | 8.16 | — | — | — |
| FCCB 905 | 0.3 | +30 | 14.34 | 14.46 | 20.36 | 5.3 | 11.69 | 15.73 | -17.05 | — | — | 8.04 | — | — | — |
| H1031-2818 | 0.3 | +70 | 12.27 | 12.29 | 17.00 | 3.1 | 16.35 | 14.76 | -21.02 | 102 | (2) | 9.63 | 8.51 | 9.66 | 0.07 |
| H1031-2632 | 0.2 | +20 | 14.40 | 14.40 | 20.37 | 5.2 | 11.26 | 15.79 | -18.91 | 81 | (2) | 8.79 | 8.40 | 8.94 | 0.29 |
| H1032-2638 | 0.5 | +75 | 15.64 | 15.62 | 20.23 | 3.5 | 8.08 | 16.52 | -17.69 | 128 | (3) | 8.30 | — | — | — |
| H1034-2758 | 0.3 | -50 | 13.30 | — | — | — | — | 15.00 | (-20.01) | 136 | (2) | (9.23) | 8.81 | 9.46 | 0.23 |
| H1035-2756 | 0.2 | -30 | 15.10 | 15.11 | 21.49 | 6.2 | 6.53 | 16.42 | -18.20 | 94 | (2) | 8.50 | 8.95 | 9.08 | 0.74 |
| H1035-2605 | 0.8 | +25 | 12.88 | — | — | — | — | 15.29 | (-20.43) | 84 | (3) | (9.40) | 9.32 | 9.67 | 0.45 |
| H1035-2502 | 0.1 | +90 | 15.47 | 15.33 | 20.64 | 3.6 | 6.92 | 16.72 | -17.98 | 88 | (2) | 8.42 | 8.53 | 8.78 | 0.57 |
| H1035-2740 | 0.7 | +35 | 15.77 | 15.53 | 20.28 | 4.8 | 10.87 | 16.85 | -17.78 | 84 | (3) | 8.34 | — | — | — |
| H1038-2733 | 0.5 | +90 | 15.76 | 15.73 | 20.64 | 4.0 | 7.70 | 16.56 | -17.58 | 67 | (2) | 8.26 | 8.85 | 8.95 | 0.80 |
| H1038-2730 | 0.6 | -55 | 14.59 | — | — | — | — | 16.10 | (-18.72) | 173 | (2) | (8.71) | 8.94 | 9.14 | 0.62 |
| Wavelength | FCC 32 | FCC 33 | FCC 35 | FCCB 905 | H1031-2632 | H1031-2818 | H1035-2502 | H1035-2605 | H1035-2740 | H1035-2756 |
| 3727 [O II] | 3.91 0.26 | 1.26 0.03 | 2.52 0.13 | 5.73 0.92 | 5.44 1.18 | 1.51 0.04 | 5.08 1.61 | 3.00 0.45 | 4.08 0.66 | 3.61 0.64 |
| 3868 [Ne III] | — | — | 0.75 0.07 | — | — | — | — | — | — | — |
| 3968H7+[Ne III] | — | — | 0.31 0.02 | — | — | — | — | — | — | — |
| 4100 H | — | — | 0.30 0.02 | — | — | — | — | — | — | — |
| 4340 H | — | — | 0.47 0.01 | 0.48 0.04 | — | — | 0.49 0.10 | — | 0.49 0.05 | 0.47 0.05 |
| 4860 H | 1.00 0.02 | 1.00 0.01 | 1.00 0.01 | 1.00 0.03 | 1.00 0.05 | 1.00 0.01 | 1.00 0.04 | 1.00 0.04 | 1.00 0.03 | 1.00 0.07 |
| 4959 [O III] | — | — | 1.88 0.02 | 0.66 0.02 | 1.03 0.10 | — | 0.48 0.03 | — | 1.15 0.04 | 1.05 0.03 |
| 5007 [O III] | 0.32 0.02 | — | 5.57 0.05 | 1.96 0.06 | 2.75 0.21 | 0.24 0.01 | 1.31 0.07 | 0.46 0.04 | 3.27 0.10 | 3.20 0.08 |
| 6563 H | 2.87 0.10 | 2.89 0.05 | 2.86 0.10 | 2.86 0.38 | 2.93 0.27 | 2.87 0.04 | 2.86 0.70 | 2.95 0.14 | — | — |
| 6584 [N II] | 0.85 0.04 | 0.75 0.01 | 0.036 0.002 | 0.17 0.03 | — | 0.94 0.01 | 0.18 0.05 | 0.76 0.04 | — | — |
| 6678 He I | — | — | 0.027 0.001 | — | — | — | — | — | — | — |
| 6717 [S II] | 0.82 0.03 | 0.39 0.01 | 0.104 0.004 | 0.39 0.06 | 0.77 0.09 | 0.68 0.01 | 0.44 0.13 | 0.76 0.04 | — | — |
| 6731 [S II] | 0.63 0.03 | 0.36 0.01 | 0.072 0.003 | 0.25 0.04 | 0.62 0.07 | 0.44 0.01 | 0.29 0.09 | 0.53 0.03 | — | — |
| 0.01 0.04 | 0.18 0.02 | 0.08 0.05 | 0.51 0.19 | 0.74 0.08 | 0.11 0.01 | 0.91 0.41 | 0.78 0.05 | 0.68 0.20 | 0.18 0.21 | |
| 116 | 417 | 100 | 100 | 198 | 100 | 100 | 100 | — | — | |
| 12+log(O/H)N2333O/H derived from Petini & Pagel pp04 (2004) - N2 method | 8.60 | 8.55 | 7.87 | 8.19 | — | 8.65 | 8.19 | 8.56 | — | — |
| log R23444For all the objects showing log 0.90, 12+log(O/H) = 8.20 is adopted in the method (see section 3.2.2 for details) | 0.64 | — | 1.00 | 0.92 | 0.96 | 0.26 | 0.84 | 0.56 | 0.93 | 0.90 |
| 12+log(O/H)R23upper555O/H derived from the theoretical abundance calibration of according to McGaugh (1991): upper branch as parametrized in Kobulnicky et al. (k99 (1999)); values in parantheses were rejected. | 8.68 | — | 8.20 | 8.20 | 8.20 | 8.98 | (8.47) | 8.78 | 8.20 | 8.20 |
| 12+log(O/H)R23lower666O/H derived from the theoretical abundance calibration of according to McGaugh (1991): lower branch as parametrized in Kobulnicky et al. (k99 (1999)); values in parantheses were rejected. | (8.15) | — | 8.20 | 8.20 | 8.20 | (7.53) | 8.28 | (7.93) | 8.20 | 8.20 |
| 12+log(O/H)ONS777O/H derived from Pilyugin, Vilchez and Thuan (2010) - ONS calibration | 8.52 | — | 7.81 | 8.09 | — | 8.59 | 7.99 | 8.50 | — | — |
| 12+log(O/H)adopted 888The adopted O/H corresponds to the mean value obtained from the different derivations (see Section 4.2 for details) | 8.60 | 8.55 | 8.00 | 8.16 | 8.20 | 8.78 | 8.17 | 8.63 | 8.20 | 8.20 |
| 12+log(O/H) | log MG | log Mbary | log log(1/) | |||||
|---|---|---|---|---|---|---|---|---|
| H1033-2707 | 15.02 | 18.56 | -18.31 | 116 | 8.01 | 8.93 | 9.08 | -0.82 |
| H1034-2758 | 14.61 | 19.00 | -18.72 | 136 | 7.90 | 8.83 | 9.07 | -0.61 |
| H1038-2733 | 15.73 | 20.64 | -17.60 | 67 | 8.04 | 8.87 | 8.96 | -1.01 |
| H1032-2638 | 15.62 | 20.23 | -17.71 | 128 | 7.82 | — | — | — |
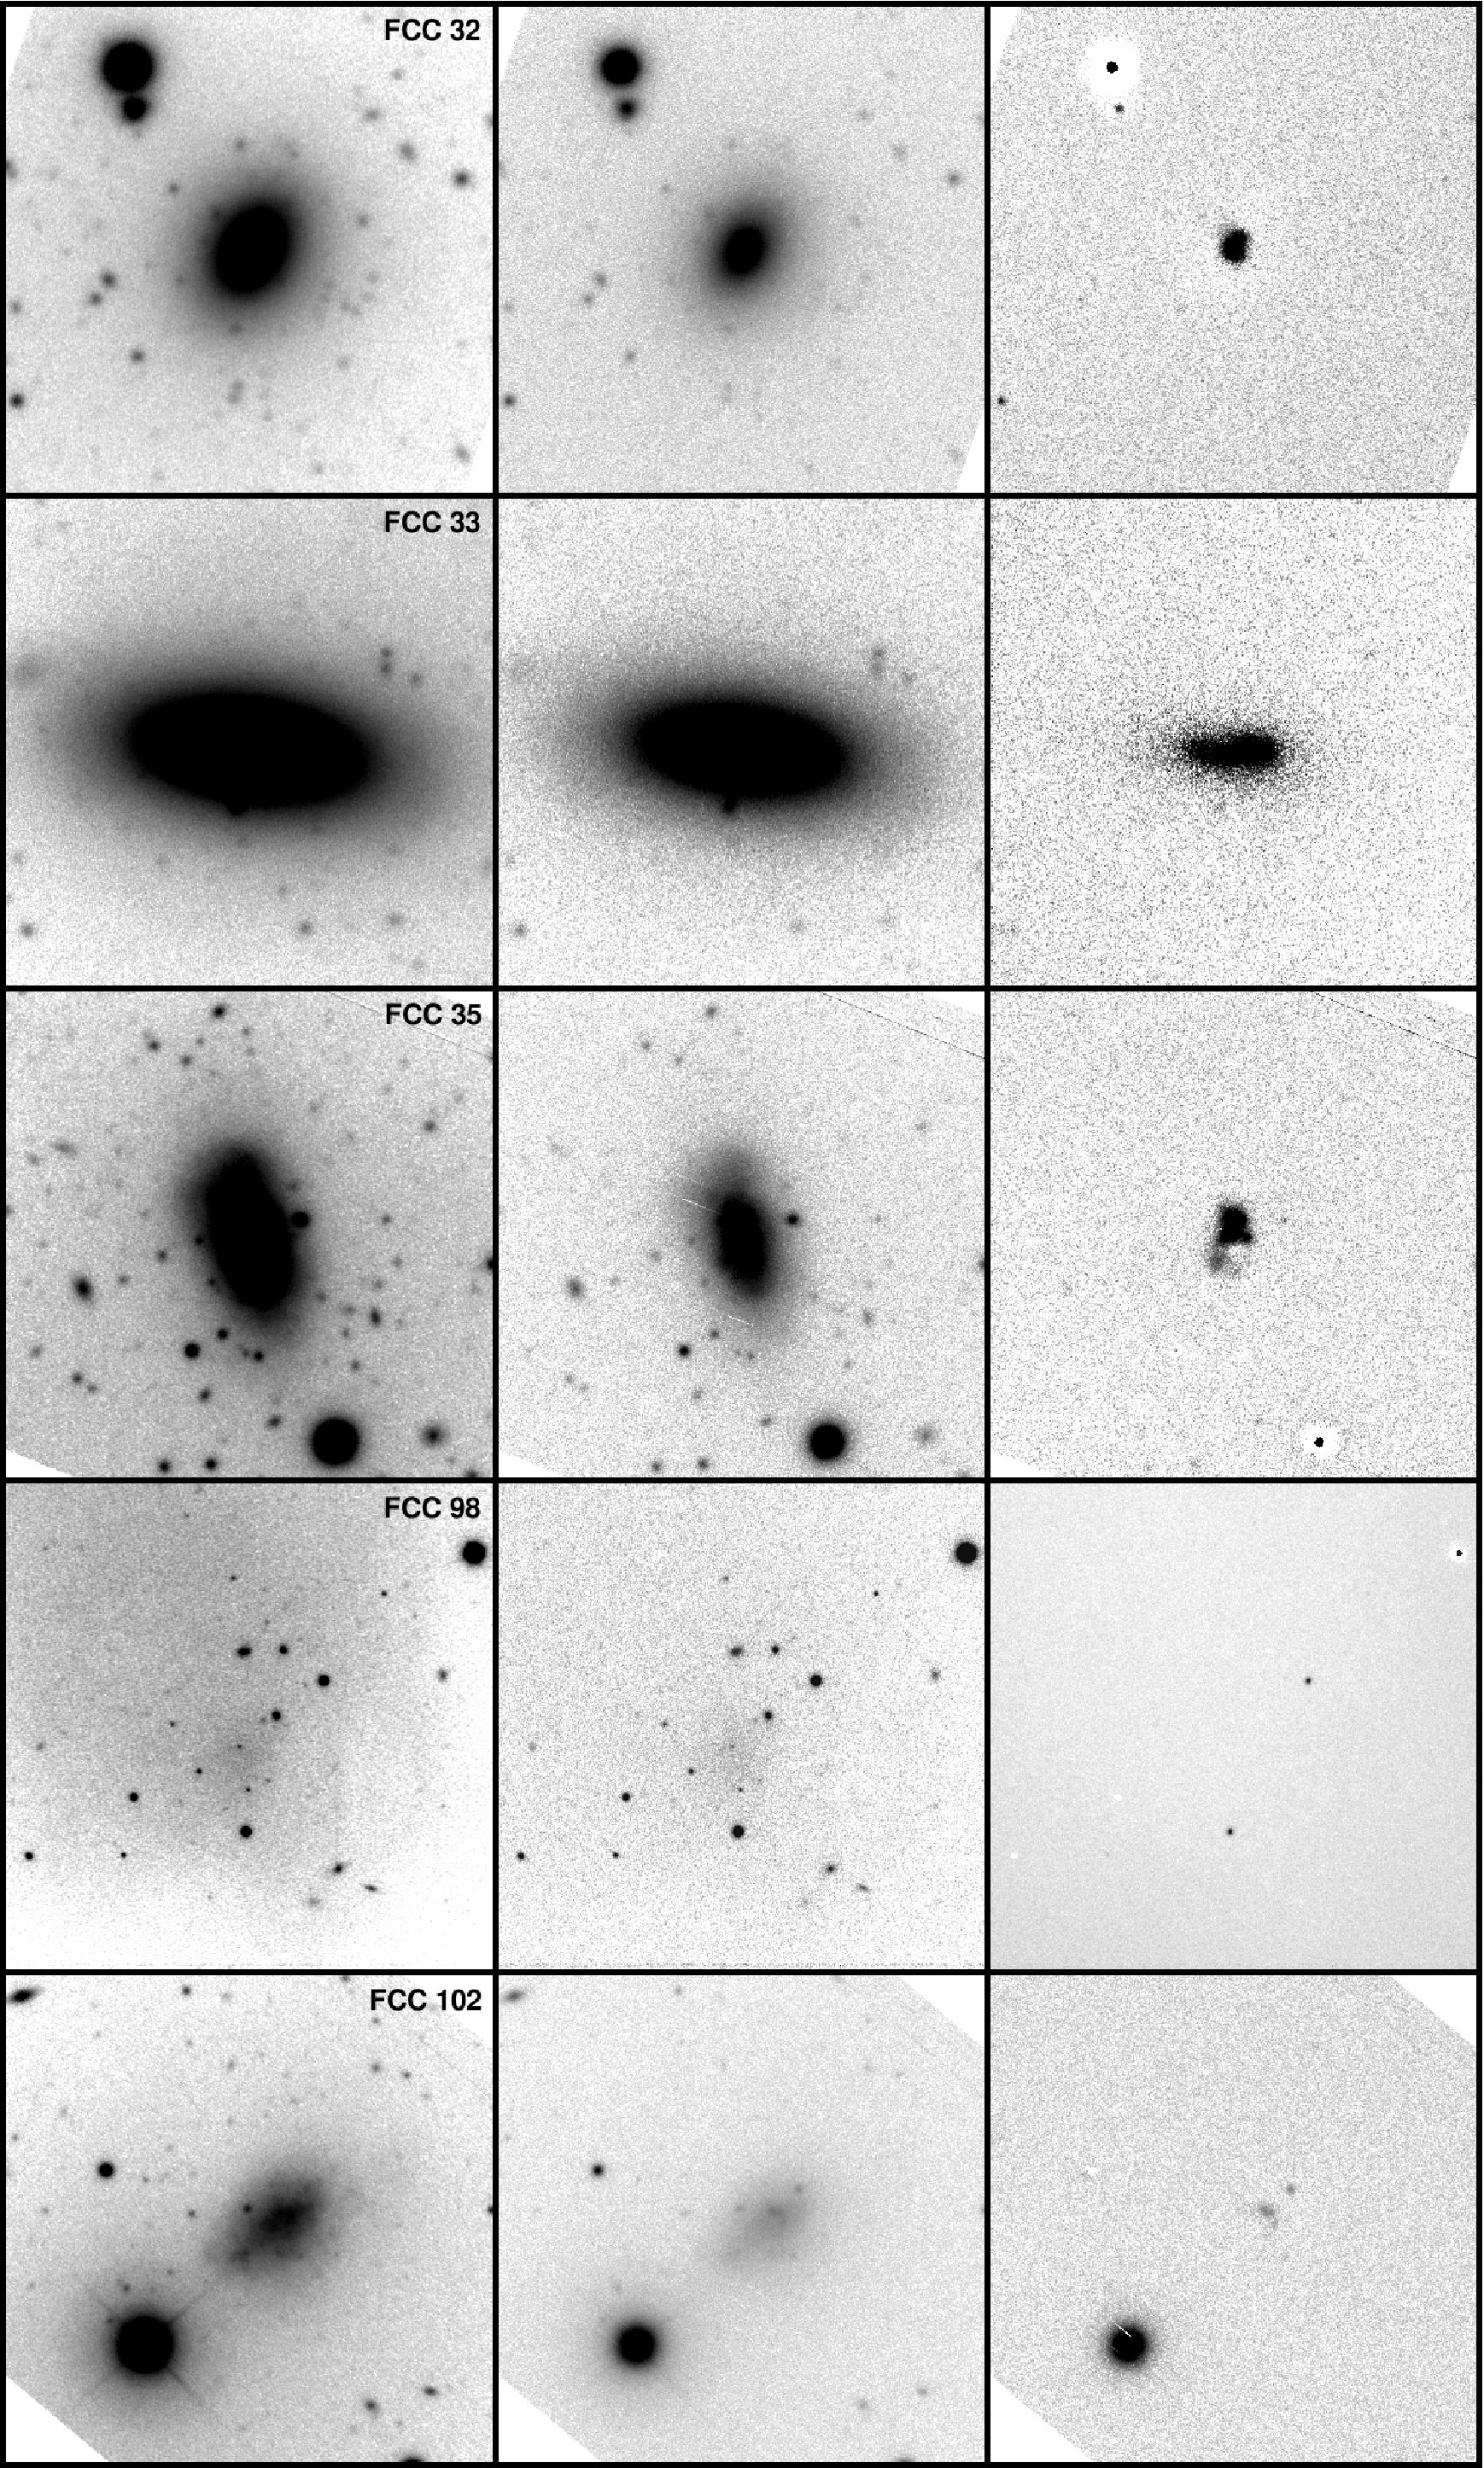
![[Uncaptioned image]](/html/1108.5772/assets/fig1b.jpg)
Figure 1 (continued - Fornax galaxies)
![[Uncaptioned image]](/html/1108.5772/assets/fig1c.jpg)
Figure 1 (continued - Hydra galaxies)
![[Uncaptioned image]](/html/1108.5772/assets/fig1d.jpg)
Figure 1 (continued - Hydra galaxies)
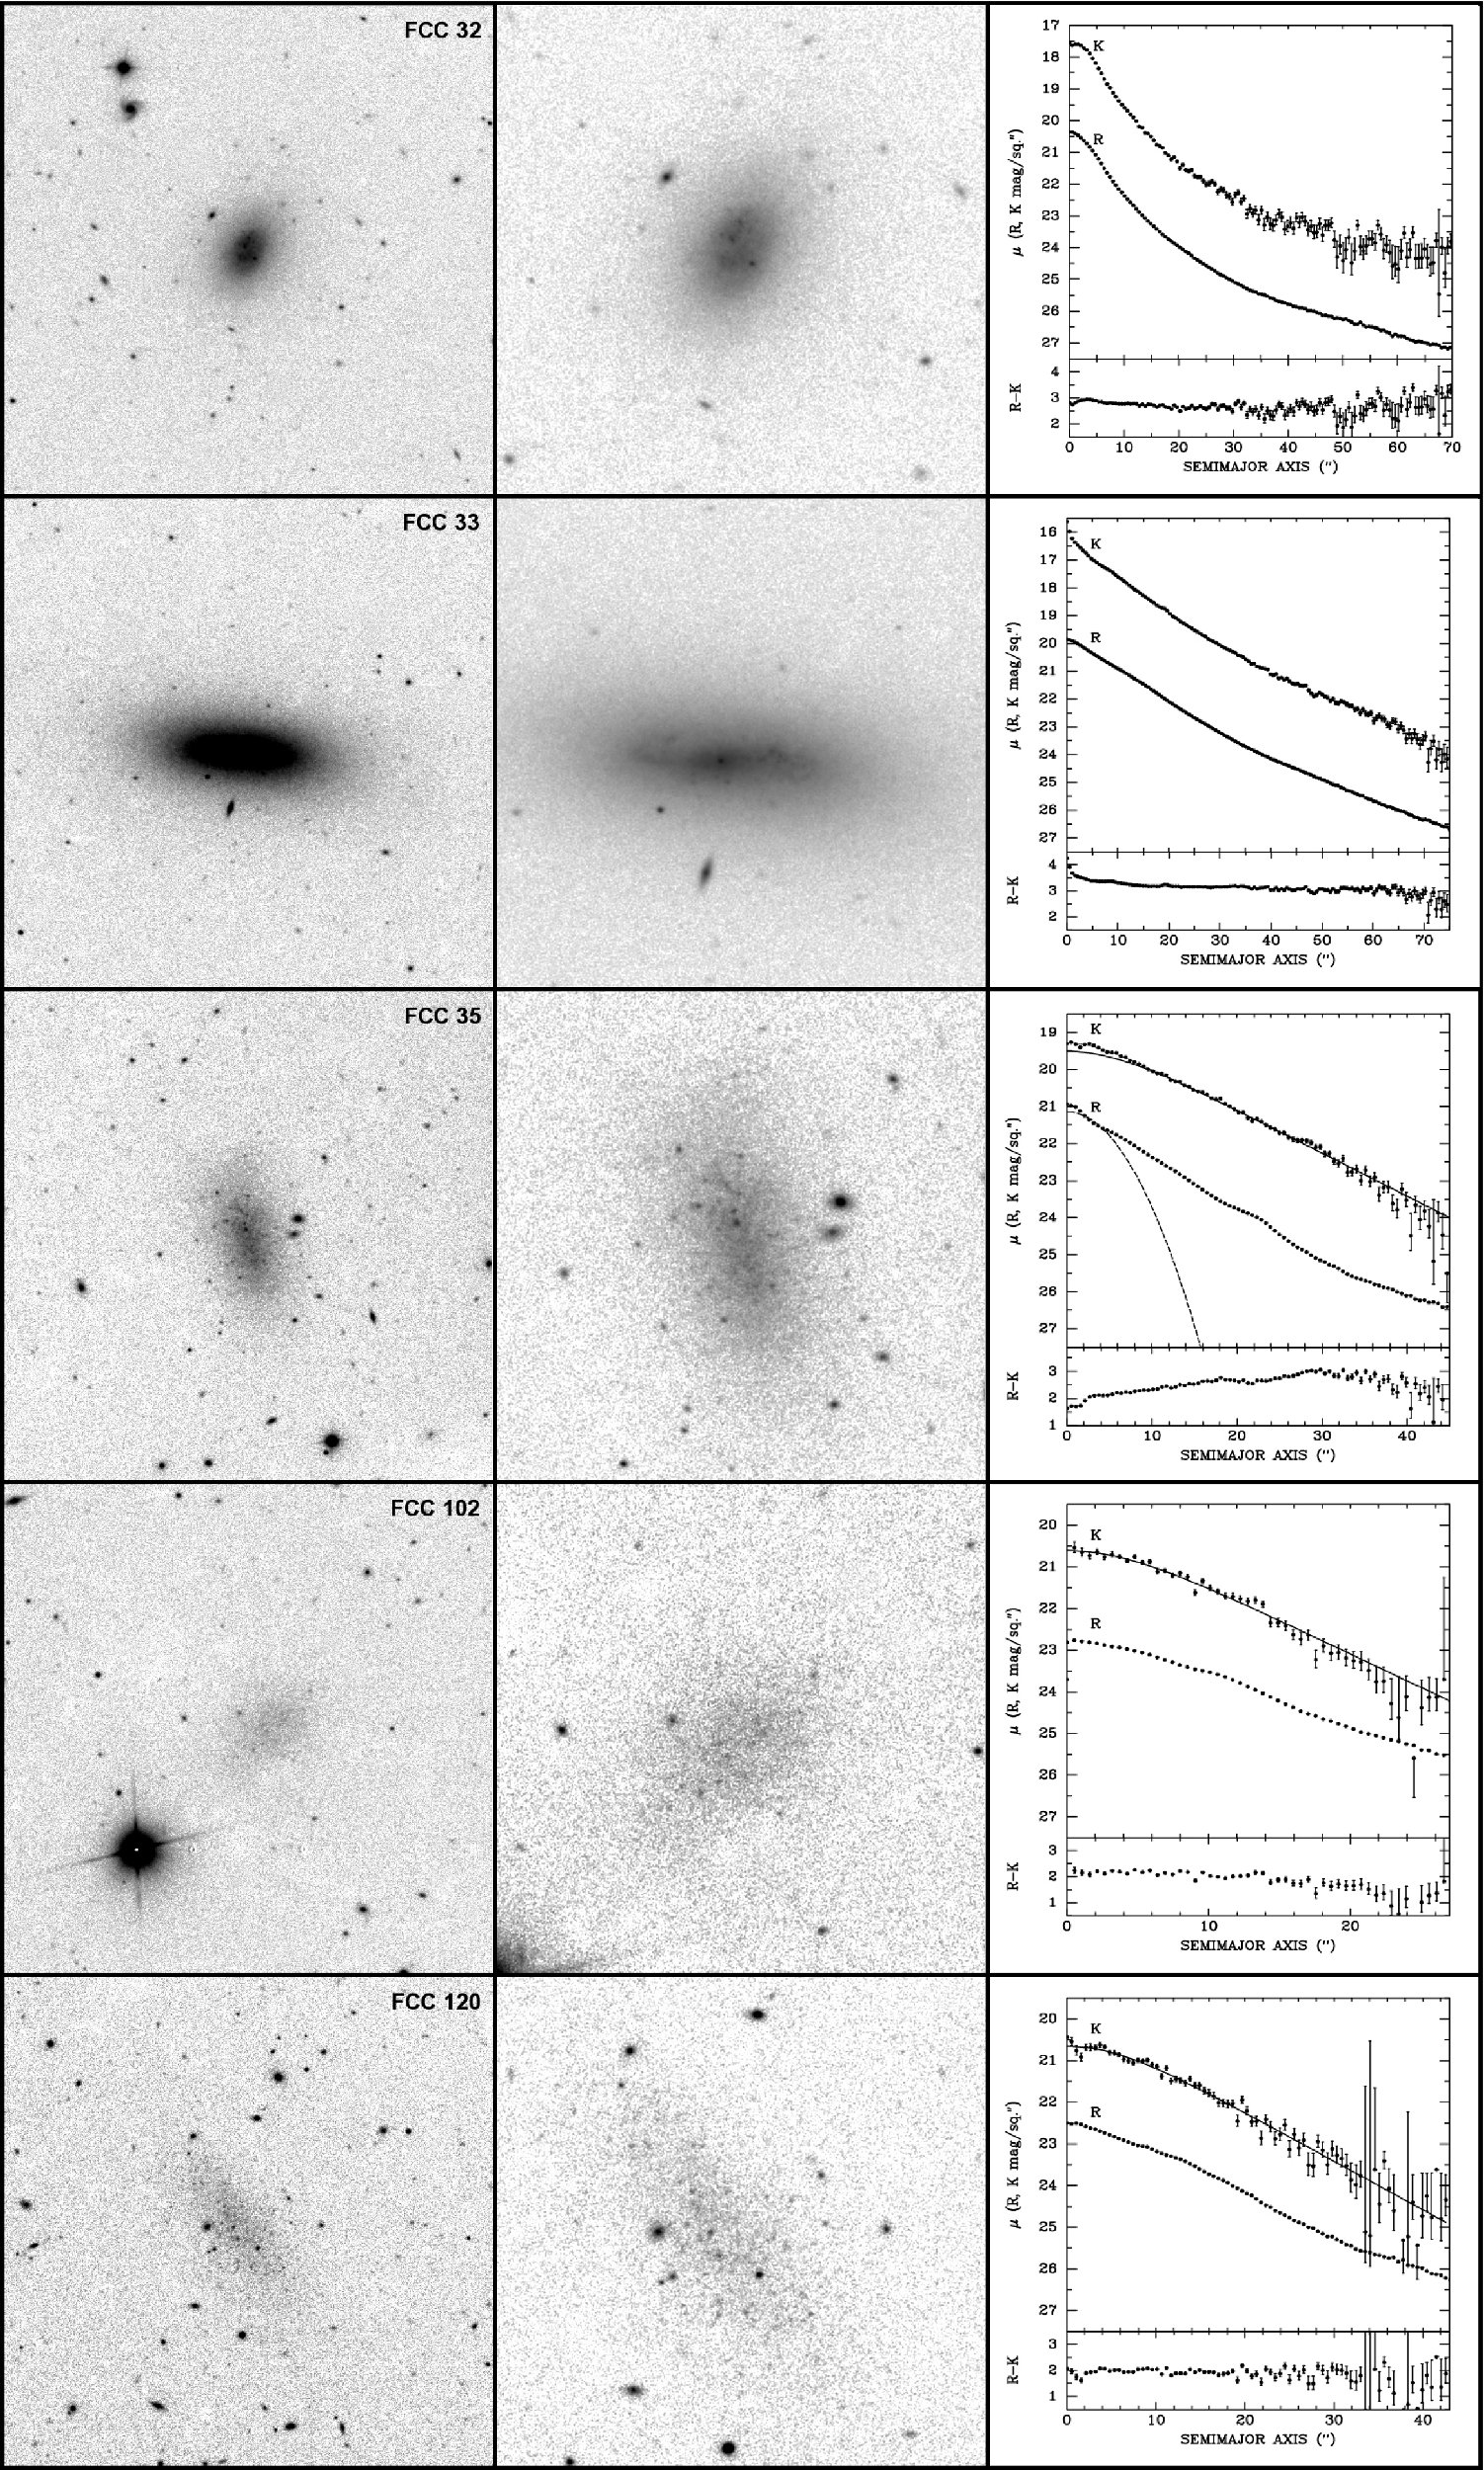
![[Uncaptioned image]](/html/1108.5772/assets/fig2b.jpg)
Figure 2 (continued - Fornax galaxies). The last three objects could not be detected.
![[Uncaptioned image]](/html/1108.5772/assets/fig2c.jpg)
Figure 2 (continued - Hydra galaxies)
![[Uncaptioned image]](/html/1108.5772/assets/fig2d.jpg)
Figure 2 (continued - Hydra galaxies)
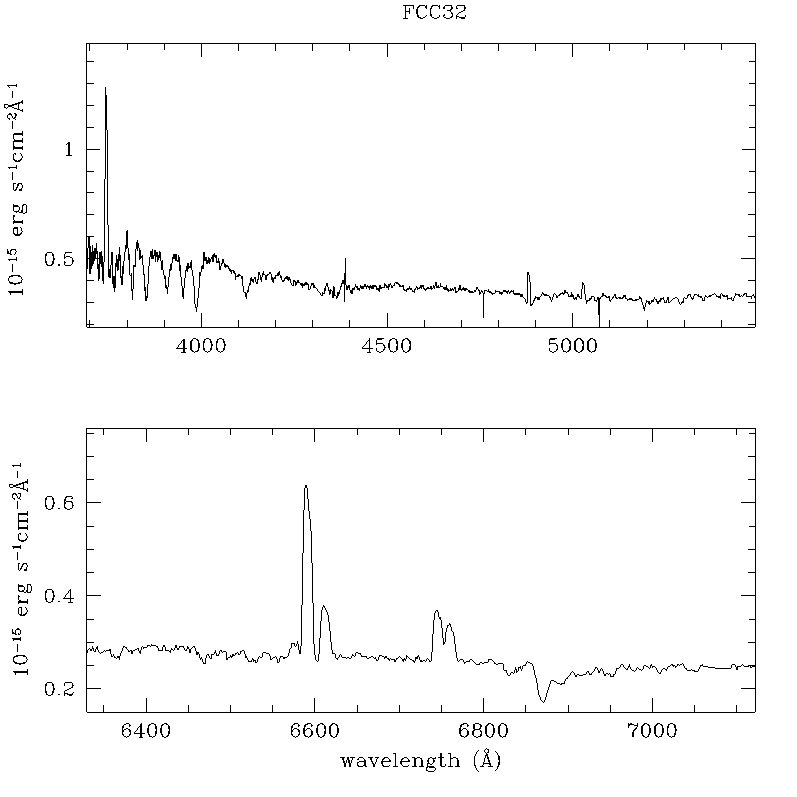
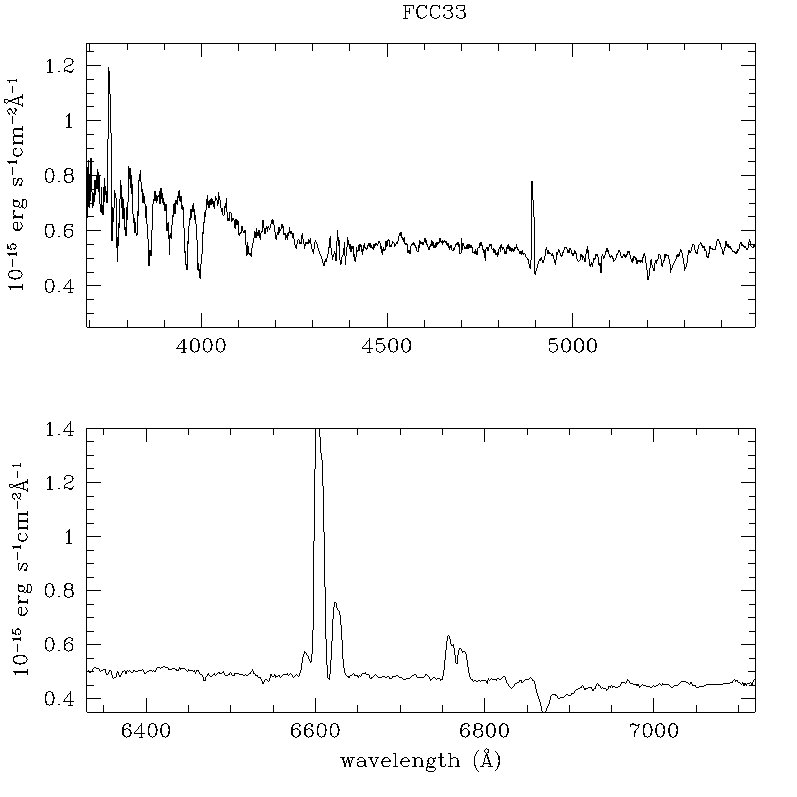
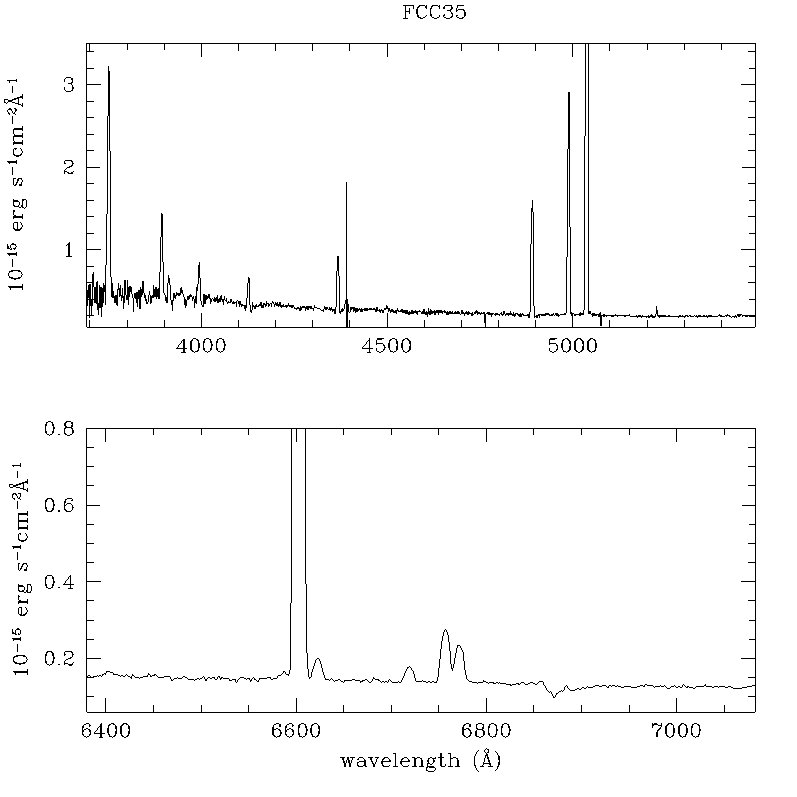
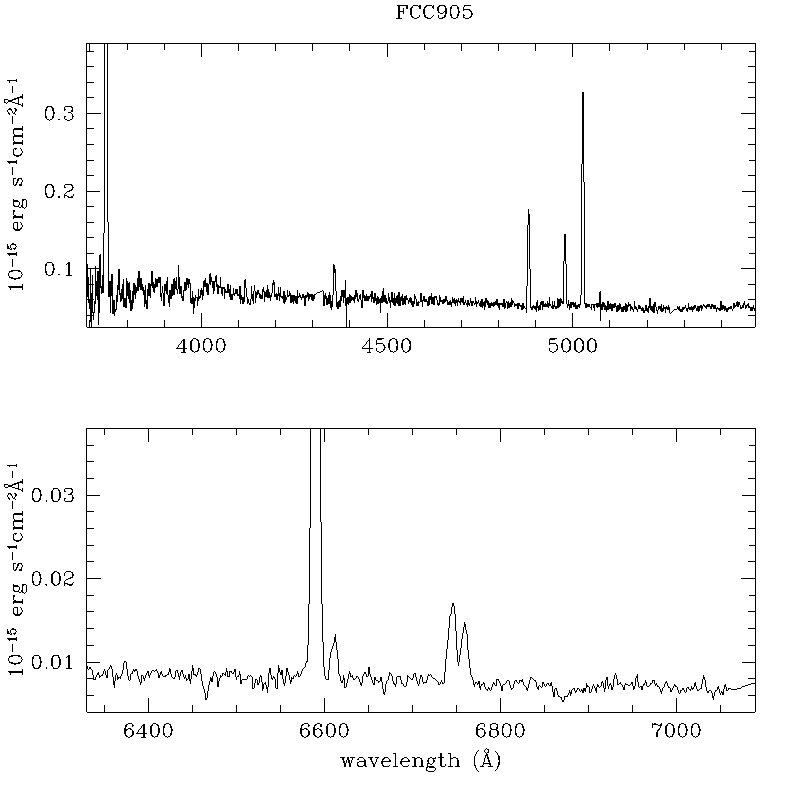
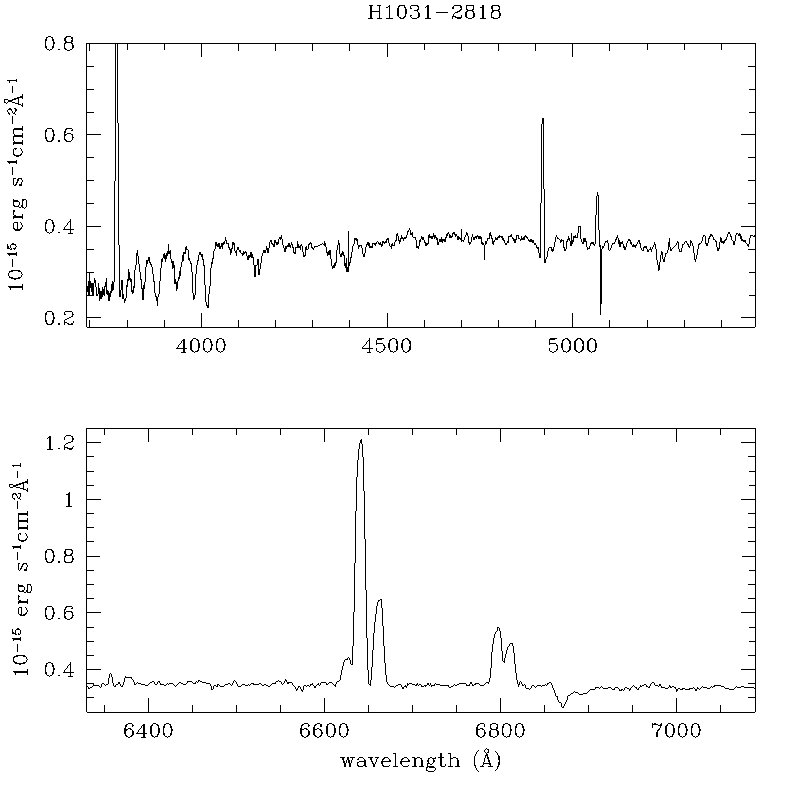
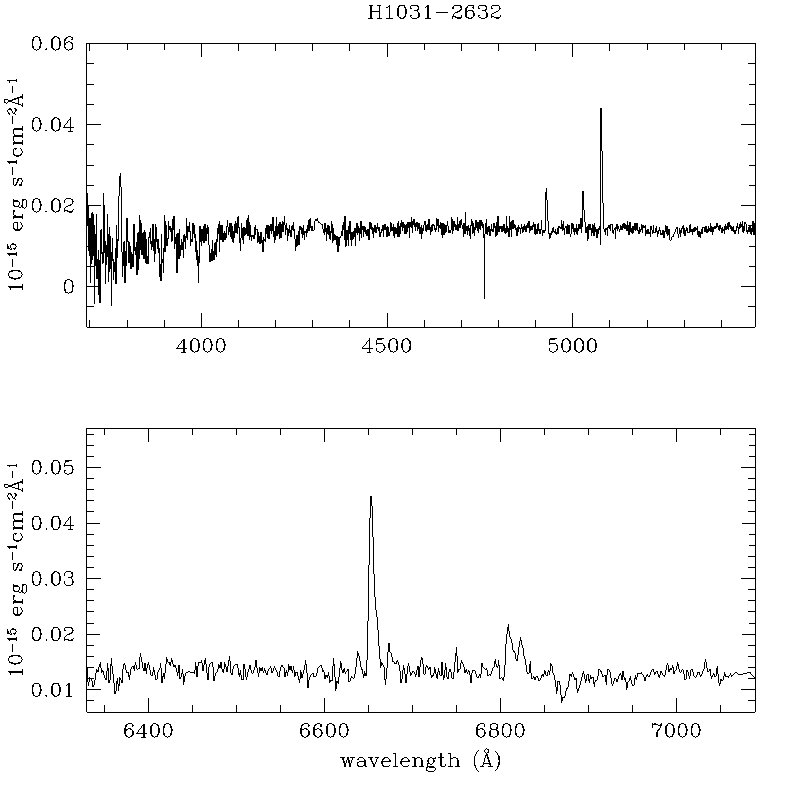
![[Uncaptioned image]](/html/1108.5772/assets/fig3g.jpg)
![[Uncaptioned image]](/html/1108.5772/assets/fig3h.jpg)
![[Uncaptioned image]](/html/1108.5772/assets/fig3i.jpg)
![[Uncaptioned image]](/html/1108.5772/assets/fig3j.jpg)
Figure 3 (continued)