A tale of many cities: universal patterns in human urban mobility
Abstract
The advent of geographic online social networks such as Foursquare, where users voluntarily signal their current location, opens the door to powerful studies on human movement. In particular the fine granularity of the location data, with GPS accuracy down to 10 meters, and the worldwide scale of Foursquare adoption are unprecedented. In this paper we study urban mobility patterns of people in several metropolitan cities around the globe by analyzing a large set of Foursquare users. Surprisingly, while there are variations in human movement in different cities, our analysis shows that those are predominantly due to heterogeneous distribution of places across different urban environments. Moreover, a universal law for human mobility is identified, which isolates the rank distance as a key component, factoring in the number of places between origin and destination, rather than pure physical distance, as considered in previous works. Building on our findings, we also show that a rank-based movement accurately captures real human movements in different cities. Our results shed new light on the driving factors of urban human mobility, with potential applications to urban planning, location-based advertisement and even social studies.
Since the seminal works of Ravenstein ravenstein , the movement of people in space has been an active subject of research in the social and geographical sciences. It has been shown in almost every quantitative study and described in a broad range of models that a close relationship exists between mobility and distance. People do not move randomly in space, as we know from our daily lives. Human movements exhibit instead high levels of regularity and tend to be hindered by geographical distance. The origin of this dependence of mobility on distance, and the formulation of quantitative laws explaining human mobility remains, however, an open question, the answer of which would lead to many applications, e.g. improve engineered systems such as cloud computing and location-based recommendations zheng2009 ; zheng ; quercia ; scellato , enhance research in social networks onnela ; crandall ; scellato2011 ; leskovec and yield insight into a variety of important societal issues, such as urban planning and epidemiology nicholson ; hufnagel ; colizza .
In classical studies, two related but diverging viewpoints have emerged. The first camp argues that mobility is directly deterred by the costs (in time and energy) associated to physical distance. Inspired by Newton’s law of gravity, the flow of individuals is predicted to decrease with the physical distance between two locations, typically as a power-law of distance gr1 ; gr3 ; gr5 . These so-called “gravity-models” have a long tradition in quantitative geography and urban planning and have been used to model a wide variety of social systems, e.g. human migration gravity1b , inter-city communication krings and traffic flows gravity2 . The second camp argues instead that there is no direct relation between mobility and distance, and that distance is a surrogate for the effect of intervening opportunities stouffer . The migration from origin to destination is assumed to depend on the number of opportunities closer than this destination. A person thus tends to search for destinations where to satisfy the needs giving rise to its journey, and the absolute value of their distance is irrelevant. Only their ranking matters. Displacements are thus driven by the spatial distribution of places of interest, and thus by the response to opportunities rather than by transport impedance as in gravity models. The first camp appears to have been favoured by practitioners on the grounds of computational ease easa , despite the fact that several statistical studies have shown that the concept of intervening opportunities is better at explaining a broad range of mobility data miller ; haynes ; wadicky ; Freymeyer ; cheung .
This long-standing debate is of particular interest in view of the recent revival of empirical research on human mobility. Contrary to traditional works, where researchers have relied on surveys, small-scale observations or aggregate data, recent research has taken advantage of the advent of pervasive technologies in order to uncover trajectories of millions of individuals with unprecedented resolution and to search for universal mobility patterns, such to feed quantitative modelling. Interestingly, those works have all focused on the probabilistic nature of movements in terms of physical distance. As for gravity models, this viewpoint finds its roots in Physics, in the theory of anomalous diffusion. It tends to concentrate on the distributions of displacements as a function of geographic distance. Recent studies suggest the existence of a universal power-law distribution , observed for instance in cell tower data of humans carrying mobile phones marta or in the movements of “Where is George” dollar bills Brockmann2006 . This universality is, however, in contradiction with observations that displacements strongly depend on where they take place. For instance, a study of hundreds of thousands of cell phones in Los Angeles and New York demonstrate different characteristic trip lengths in the two cities isaacman . This observation suggests either the absence of universal patterns in human mobility or the fact that physical distance is not a proper variable to express it.
In this work, we address this problem by focusing on human mobility patterns in a large number of cities across the world. More precisely, we aim at answering the following question: “Do people move in a substantially different way in different cities or, rather, do movements exhibit universal traits across disparate urban centers?”. To do so, we take advantage of the advent of mobile location-based social services accessed via GPS-enabled smartphones, for which fine granularity data about human movements is becoming available. Moreover, the worldwide adoption of these tools implies that the scale of the datasets is planetary. Exploiting data collected from public check-ins made by users of the most popular location-based social network, Foursquare foursquare , we study the movements of 925,030 users around the globe over a period of about six months, and study the movements across 5 million places in 34 metropolitan cities that span four continents and eleven countries.
After discussing how at larger distances we are able to reproduce previous results of marta and Brockmann2006 , we also offer new insights on some of the important questions about human urban mobility across a variety of cities. We first confirm that mobility, when measured as a function of distance, does not exhibit universal patterns. The striking element of our analysis is that we observe a universal behavior in all cities when measured with the right variable. We discover that the probability of transiting from one place to another is inversely proportional to a power of their rank, that is, the number of intervening opportunities between them. This universality is remarkable as it is observed despite cultural, organizational and national differences. This finding comes into agreement with the social networking parallel which suggests that the probability of a friendship between two individuals is inversely proportional to the number of friends between them liben , and depends only indirectly on physical distance. More importantly, our analysis is in favour of the concept of intervening opportunities rather than gravity models, thus suggesting that trip making is not explicitly dependent on physical distance but on the accessibility of objectives satisfying the objective of the trip. Individuals thus differ from random walkers in exploring physical space because of the motives driving their mobility.
Our findings are confirmed with a series of simulations verifying the hypothesis that the place density is the driving force of urban movement. By using only information about the distribution of places of a city as input and by coupling this with a rank-based mobility preference we are able to reproduce the actual distribution of movements observed in real data. These results open new directions for future research and may positively impact many practical systems and application that are centered on mobile location-based services.
I Results
I.1 Urban Movements and Power-laws
We draw our analysis upon a dataset collected from the largest Location-based Social Network, Foursquare foursquare . The dataset features 35,289,629 movements of 925,030 users across 4,960,496 places collected during six months in 2010. By movements we express the indication of presence at a place that a user gives through the system (in the language of Location-based Social Networks, a location broadcast is referred as a checkin). For each place we have exact GPS coordinates.
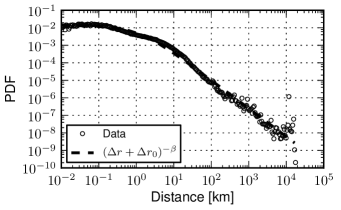
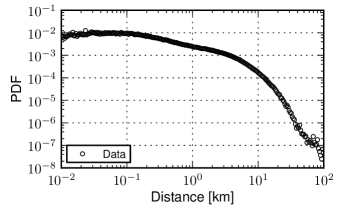
In order to confirm the large scale results reported in marta ; Brockmann2006 , we have computed the distribution of human displacements in our dataset (Figure 1): we observe that the distribution is well approximated by a power law with exponent (). This is almost identical to the value of the exponent calculated for the dollar bills movement () Brockmann2006 and very proximate to the estimated from cellphones calls analysis of human mobility marta . With respect to these datasets, we note that the Foursquare dataset is planetary, as it contains movements at distances up to 20,000 kilometres (we measure all distances using the great-circle distance between points on the planet). On the other extreme, small distances of the order of tens of meters can also be approximated thanks to the fine granularity of GPS technology employed by mobile phones running these geographic social network applications. Indeed, we find that the probability of moving up to 100 meters is uniform, a trend that has also been shown in Brockmann2006 for a distance threshold . Each transition in the dataset happens between two well defined venues, with data specifying the city they belong to. We exploit this information to define when a transition is urban, that is, when both start and end points are located within the same city. Figure 1 depicts the probability density function of the about 10 million displacements within cities across the globe. We note that a power-law fit does not accurately capture the distribution. First of all, a large fraction of the distribution exhibits an initial flat trend; then, only for values larger than 10 km the tail of distribution decays, albeit with a very large exponent which does not suggest a power-law tail. Overall, power-laws tend to be captured across many orders of magnitude, whereas this is not true in the case of urban movements. The estimated parameter values are and exponent ().
I.2 Movements across cities.
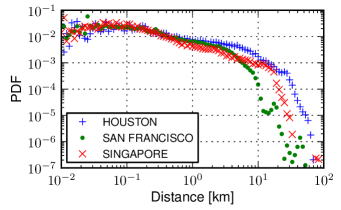
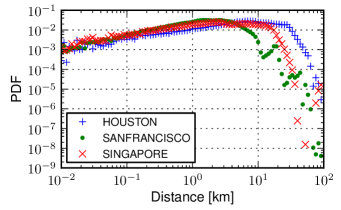
Since the distribution of urban human movements cannot be approximated with a power law distribution nor with a physically relevent functional relation, how can we represent displacements of people in a city more appropriately? We start by comparing human movements across different cities. In Figure 2, we plot the distribution of human displacements for a number of cities. The shapes of the distributions, albeit different, exhibit similarities suggesting the existence of a common underlying process that seems to characterize human movements in urban environments. There is an almost uniform probability of traveling in the first 100 meters, that is followed by a decreasing trend between 100 meters and a distance threshold km, where we detect an abrupt cutoff in the probability of observing a human transition. The threshold could be due to the reach of the borders of a city, where maximum distances emerge.
While the distributions exhibit similar trends in different cities, scales and functional relation may differ, thus suggesting that human mobility vary from city to city. For example, while comparing Houston and San Francisco (see Figure 2), different thresholds are observed. Moreover, the probability densities can vary across distance ranges. For instance, it is more probable to have a transition in the range 300 meters and 5 kilometers in San Francisco than in Singapore, but the opposite is true beyond 5 kilometers. This difference could be attributed to many potential factors, ranging from geographic ones such as area size, density of a city, to differences in infrastructures such as transportation and services or even socio-cultural variations across cities. In the following paragraphs we present a formal analysis that allow to dissect these heterogeneities.
I.3 The importance of place density.
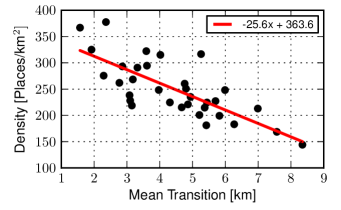
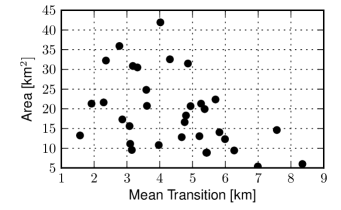
Inspired by Stouffer’s theory of intervening opportunities stouffer which suggests that the number of persons traveling a given distance is directly proportional to the number of opportunities at that distance and inversely proportional to the number of intervening opportunities, we explore to what extend the density of places in a city is related to the human displacements within it. As a first step, we plot the place density of a city, as computed with our checkin data, against the average distance of displacements observed in a number of cities. In Figure 3 one observes that the average distance of human movements is inversely proportional to the city’s density. Hence, in a very dense metropolis, like New York, there is a higher expectation of shorter movements. We have measured a coefficient of determination . Intuitively, this correlation suggests that while distance is a cost factor taken into account by humans, the range of available places at a given distance is also important. This availability of places may relate to the availability of resources while performing daily activities and movements: if no super markets are around, longer movements might be more probable in order to find supplies. As a next step, we explore whether the geographic area size covered by a city affects human mobility by plotting the average transition in a city versus its area size (see Fig. 3). Our data indicates no apparent linear relationship, with a low correlation , thus indicating that density is a more informative measure.
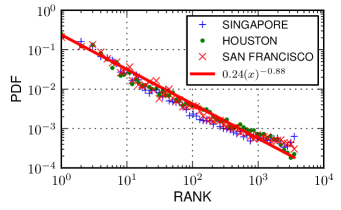
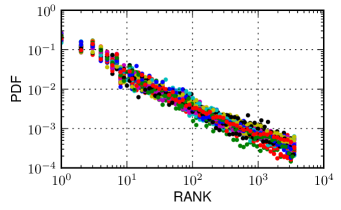
To shed further light on the hypothesis that density is a decisive factor in human mobility, for every movement between a pair of places in a city we sample the rank value of it. The rank for each transition between two places and is the number of places that are closer in terms of distance to than is. Formally: The rank between two places has the important property to be invariant in scaled versions of a city, where the relative positions of the places is preserved but the absolute distances dilated. In Figure 4 we plot for the three cities the rank values observed for each displacement. The fit of the rank densities on a log-log plot, shows that the rank distribution follows linear trend similar to that of a power-law distribution. This observation suggests that the probability of moving to a place decays when the number of places nearer than a potential destination increases. Moreover, the ranks of all cities collapse on the same line despite the variations in the probability densities of human displacements. We have fit the rank distribution for the thirty-four cities under investigation and have measured an exponent . This is indicative of a universal pattern across cities where density of settlements is the driving factor of human mobility. We superimpose the distribution of ranks for all cities in Figure 4.
Interestingly enough, a parallel of this finding can be drawn with the results in liben , where it is found that the probability of observing a user’s friend at a certain distance in a geographic social network is inversely proportional to the number of people geographically closer to the user.
I.4 Modelling urban mobility.
The universal mobility behaviour emerging across cities paves the way to a new model of movement in urban environments. Given a set of places in a city, the probability of moving from place to a place is formally defined as
where
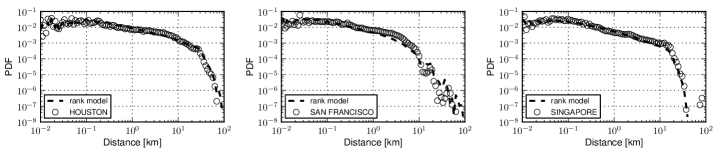
We run agent based simulation experiments (see detailed description in supporting ) where agents transit from one place to another according to the probabilities defined by the model above. Averaging the output of the probability of movements by considering all possible places of a city as potential starting points for our agents, we present the human displacements resulting from the model in Figure 5: as shown, despite the simplicity of the model, this is able to capture with very high accuracy the real human displacements in a city. Our model does not take into account other parameters such as individual heterogeneity patterns marta or temporal ones Brockmann2006 that have been studied in the past in the context of human mobility and yet it offers very accurate matching of the human traces of our dataset. A common parameter (empirical average) has been set for the simulations of all cities. We have observed movement fits to deteriorate as we move away from values measured empirically. In general, large values overestimate trips to nearby places and inversely very low values blur the effect of distance in human movements.
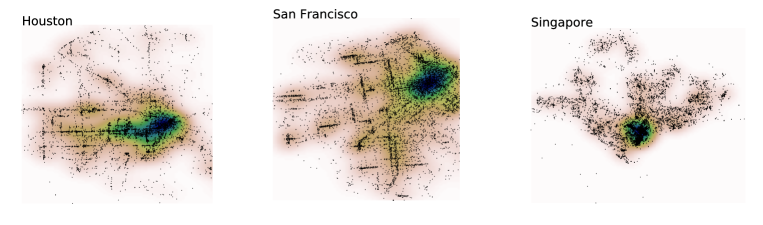
Moreover, our analysis provides empirical evidence that while human displacements across cities may differ, these variations are mainly due to the spatial distribution of places in a city instead of other potential factors such as social-cultural or cognitive ones. Indeed, the agent based simulations are run with the same rules and parameters in each city, except for the set of places that is taken from the empirical dataset. The variation across the spatial organization of cities is illustrated in Fig. 6, where we plot thermal maps of the density of places within cities and in Fig. 7, where we plot the probability density function that two random places are at a distance . Our analysis highlights the impact of geography, as expressed through the spatial distribution of places, on human movements, and confirms at a large-scale the seminal analysis of Stouffer stouffer who studied how the spatial distribution of places in the city of Cleveland affected the migration movements of families. Our analysis does not indicate that distance does not play a deterring role, but that it is not sufficient to express human mobility through universal laws. A proper modeling should account for place distribution, as rank does or possibly by complementing distance with information about place locations, as in constrained gravity models gr3 . Plots for all thirty four cities that we have evaluated can be found in SI supporting .
II Discussion
The empirical data on human movements provided by Foursquare and other location-based services allows for unprecedented analysis both in terms of scale and the information we have about the details of human movements. The former means that mobility patterns in different parts of the world can be analyzed and compared surpassing cultural, national or other organizational borders. The latter is achieved through better location specification technologies such as GPS-enabled smartphones, but also with novel online services that allow users to layout content on the geographical plane such as the existence of places and semantic information about those. As those technologies advance our understanding on human behavior can only become deeper.
In this article, we have focused on human mobility in a large number of metropolitan cities around the world to perform an empirical validation of past theories on the driving factors of human movements. As we have shown, Stouffer’s stouffer theory of intervening opportunities appears to be a plausible explanation to the observed mobility patterns. The theory suggests that the distance covered by humans is determined by the number of opportunities (i.e., places) within that distance, and not by the distance itself. This behaviour is confirmed in our data where we observed that physical distance does not allow for the formulation of universal rules for human mobility, whereas a universal pattern emerges across all cities when movements are analyzed through their respective rank values: the probability of a transition to a destination place is inversely proportional to the relative rank of it, raised to a power , with respect to a starting geographical point. Moreover, presents minor variations from city to city.
We believe that our approach opens avenues of quantitative exploration of human mobility, with several applications in urban planning and ICT. The identification of rank as an appropriate variable for the deterrence of human mobility is in itself an important observation, as it is expected to lead to more reliable measurements in systems where the density of opportunities is not uniform, e.g. in a majority of real-world systems. The realization of universal properties in cities around the globe also goes along the line of recent research bettencourt2007 ; bettencourt2010 on urban dynamics and organization, where cities have been shown to be scaled versions of each other, despite their cultural and historical differences. Contrary to previous observations where size is the major determinant of many socio-economical characteristics, however, density and spatial distribution are the important factors for mobility. Moreover, the richness of the dataset naturally opens up new research directions, such as the identification of the needs and motives driving human movements, and the calibration of the contact rate, e.g. density- vs frequency-dependent, in epidemiological models smith .
III Methods
The mobility dataset used in this work is comprised from checkins made by Foursquare users and become publicly available through Twitter’s Streaming API. The collection process lasted from the 27th of May 2010 until the 3rd of November of the same year. During this period we have observed 35,289,629 checkins from 925,030 unique users over 4,960,496 venues. In addition, locality information together with exact GPS geo-coordinates for each venue has become available through the Foursquare website allowing us to associate a given venue with a city. By considering only consecutive checkins that take place within the same city we have extracted almost 10 million intracity movements analysed in Figure 1. Detailed statistics including the number of checkins and venues in each city can be found in supporting .
We have employed the methods detailed in clauset to apply goodness-of-fit tests on the Probability Density Functions of global and urban transitions observed in Figures 1 and 1. In particular, we have measured the corresponding using the Kolmogorov-Smirnov test by generating 1000 synthetic distributions, while the Maximum-Likelihood Estimation technique has been used to estimate the parameters of the power-laws. Exceptionally, we have resorted to a least squares based optimization to measure the exponent of the rank values shown in Figure 4. While power-laws are not well defined for exponents smaller than , we are confident of the values estimated due to the excellent movement fits produced during our simulations.
Acknowledgements.
RL thanks M. Gonzales for mentioning him the original work of Stouffer. This research was supported in part by the National Science Foundation under Grant No. NSF PHY05-51164.References
- (1) E.G. Ravenstein (1885) The Laws of Migration, Journal of the Royal Statistical Society 48,167–227.
- (2) Y. Zheng, L. Zhang, X. Xie, W.-Y. Ma (2009) Mining interesting locations and travel sequences from GPS trajectories, Proceedings of WWW’ 09, 791-800.
- (3) V. W. Zheng, Y. Zheng, X. Xie, and Q. Yang (2010) Collaborative location and activity recommendations with GPS history data, Proceedings of WWW ’10, 1029-1038.
- (4) D. Quercia, N. Lathia, F. Calabrese, G. Di Lorenzo and J. Crowcroft (2010) Recommending Social Events from Mobile Phone Location Data, Proceedings of IEEE ICDM 2010
- (5) S. Scellato, C. Mascolo, M. Musolesi, J. Crowcroft (2011) Track globally, deliver locally: Improving content delivery networks by tracking geographic social cascades., WWW’ 11.
- (6) J.-P. Onnela, J. Saramäki, J. Hyvönen, G. Szabó, D. Lazer, K. Kaski, J. Kertész, A.-L. Barabási (2006) Structure and tie strengths in mobile communication networks. Proceedings of the National Academy of Sciences, 104(18):7332–7336.
- (7) D. Crandall, L. Backstrom, D. Cosley, S. Suri, D. Huttenlocher, J. Kleinberg (2010) Inferring Social Ties from Geographic Coincidences. Proceedings National Academy of Sciences 107(52) 22436-22441.
- (8) S. Scellato, A. Noulas, R. Lambiotte, C. Mascolo (2011) Socio-spatial Properties of Online Location-based Social Networks. Proceedings of ICWSM 2011.
- (9) E. Cho, S. A. Mayers, J. Leskovec (2011) Friendship and Mobility: User Movement in Location-based Social Networks. Proceedings of KDD’ 11
- (10) K. Nicholson and R.G. Webster, Textbook of Influenza (Blackwell, Malden, Massachusetts, 1998)
- (11) L. Hufnagel, D. Brockmann and T. Geisel (2004) Forecast and control of epidemics in a globalized world, Proc Natl Acad Sci USA 101, 15124.
- (12) V. Colizza, A. Barrat, M. Barthélemy and A. Vespignani (2007) Predictability and epidemic pathways in global outbreaks of infectious diseases: The SARS case study, BMC Med. 5, 34.
- (13) V. Carrothers (1956) A Historical Review of the Gravity and Potential Concepts of Human Interaction, J. of the Am. Inst. of Planners 22, pp. 94-102.
- (14) A.G. Wilson (1967) A statistical theory of spatial distribution models, Transportation Research 1, pp. 253-269. 54, pp. 68-78
- (15) S. Erlander and N. F. Stewart (1990) The Gravity Model in Transportation Analysis: Theory and Extensions, Brill Academic Publishers, Utrecht.
- (16) M. Levy (2010) Scale-free human migration and the geography of social networks, Physica A 389, 4913-4917.
- (17) G.M. Krings, F. Calabrese, C. Ratti and V. D. Blondel (2009) Urban gravity: a model for inter-city telecommunication flows, Journal of Statistical Mechanics: Theory and Experiment, L07003.
- (18) W.-S. Jung, F. Wang and H.E. Stanley (2008) Gravity model in the Korean highway, Europhys. Lett. 81, 48005.
- (19) S. Stouffer (1940) Intervening opportunities: A theory relating mobility and distance, American Sociological Review 5, 845-867
- (20) S.M. Easa (1993) Urban Trip Distribution in Practice. I: Conventional Analysis, Journal of Transportation Engineering 119, 793-815
- (21) E. Miller (1972) A note on the role of distance in migration: costs of mobility versus intervening opportunities, J. Reg. Sci. 12, 475–478.
- (22) K.E. Haynes, D. Poston and P. Sehnirring (1973) Inter-metropolitan migration in high and low opportunity areas: indirect tests of the distance and intervening opportunities hypotheses, Econ. Geogr. 49, 68-73.
- (23) W.J. Wadycki (1975) Stouffer’s Model of Migration: A Comparison of Interstate and Metropolitan Flows, em Demography 12, 121-128.
- (24) R.H. Freymeyer and P.N. Ritchey (1985) Spatial Distribution of Opportunities and Magnitude of Migration: An Investigation of Stouffer’s Theory, Sociological Perspectives 28, 419-440.
- (25) C. Cheung and J. Black (2005) Residential location-specific travel preferences in an intervening opportunities model: transport assessment for urban release areas, Journal of the Eastern Asia Society for Transportation Studies 6, 3773-3788.
- (26) M. C. Gonzalez, C. A. Hidalgo and A.-L. Barabási (2008) Understanding individual human mobility patterns, Nature 453, 779-782.
- (27) D. Brockmann, L. Hufnagel and T. Geisel (2006) The scaling laws of human travel, Nature 439, 462-465.
- (28) S. Isaacman, R. Becker, R. Caceres, S. Kobourov, J. Rowland, A. Varshavsky (2010) A Tale of Two Cities, 11th Workshop on Mobile Computing Systems and Applications
- (29) http://www.foursquare.com.
- (30) D. Liben-Nowell, J. Novak, R. Kumar, P. Raghavan, A. Tomkins (2005) Geographic routing in social networks, Proceedings of the National Academy of Sciences, 102(33):11623–11628.
- (31) L. Bettencourt, J. Lobo, D. Helbing, C. Kühnert and G.B. West (2007) Growth, innovation, scaling, and the pace of life in cities, Proc. Natl Acad. Sci. USA 104, 7301-7306.
- (32) L. Bettencourt and G. West (2010) A unified theory of urban living, Nature 467, 912-913.
- (33) M.J. Smith, S. Telfer, E.R. Kallio, S. Burthe, A.R. Cook, X. Lambin and M. Begon (2009) Host-pathogen time series data in wildlife support a transmission function between density and frequency dependence, Proc. Natl Acad. Sci. USA 106, 7905-7909.
- (34) A. Clauset, C.R. Shalizi, M.E.J. Newman (2009) Power-law distributions in empirical data. arXiv:physics:/07061062.
- (35) Supporting information: http://www.cl.cam.ac.uk/an346/supporting.pdf.