Dust properties and disk structure of evolved protoplanetary disks in Cep OB2: Grain growth, settling, gas and dust mass, and inside-out evolution
Abstract
We present /IRS spectra of 31 TTS and IRAM/1.3mm observations for 34 low- and intermediate-mass stars in the Cep OB2 region. Including our previously published data, we analyze 56 TTS and the 3 intermediate-mass stars with silicate features in Tr 37 (4 Myr) and NGC 7160 (12 Myr). The silicate emission features are well reproduced with a mixture of amorphous (with olivine, forsterite, and silica stoichiometry) and crystalline grains (forsterite, enstatite). We explore grain size and disk structure using radiative transfer disk models, finding that most objects have suffered substantial evolution (grain growth, settling). About half of the disks show inside-out evolution, with either dust-cleared inner holes or a radially-dependent dust distribution, typically with larger grains and more settling in the innermost disk. The typical strong silicate features require nevertheless the presence of small dust grains, and could be explained by differential settling according to grain size, anomalous dust distributions, and/or optically thin dust populations within disk gaps. M-type stars tend to have weaker silicate emission and steeper SEDs than K-type objects. The inferred low dust masses are in a strong contrast with the relatively high gas accretion rates, suggesting global grain growth and/or an anomalous gas to dust ratio. Transition disks (TD) in the Cep OB2 region display strongly processed grains, suggesting that they are dominated by dust evolution and settling. Finally, the presence of rare but remarkable disks with strong accretion at old ages reveals that some very massive disks may still survive to grain growth, gravitational instabilities, and planet formation.
1 Introduction
Evolved protoplanetary disks are among the most interesting objects to understand how (and if) planet formation occurs in the disks around solar-type stars. Although there is well-accepted evidence suggesting that most IR excesses from protoplanetary disks have dissipated by 6-10 Myr (e.g. Haisch et al. 2001; Sicilia-Aguilar et al. 2006a, from now on SA06; Hernández et al. 2007), the way disks become optically thin and disperse after a (brief or long) transition phase is not clear. Different disk dispersal processes have been proposed, and observational evidence suggests that they all happen to some extent, but the relative importance and the interplay between them is unknown.
Grain growth/settling to the midplane without fragmentation would render the disk optically thin in a timescale too short to be consistent with observations (Dullemond & Dominik 2005; Brauer et al. 2008). Nevertheless, evidence for grain growth to millimeter-sized particles is found in (sub)millimeter observations as flatter dust emissivity curves and reduced disk masses compared to gas observations (Andrews & Williams 2005, 2007; Rodmann et al. 2006; Natta et al. 2007). High accretion rates observed in objects with negligible near-IR excess also point to strong grain growth/settling (Sicilia-Aguilar et al. 2010). Planet formation would substantially affect the disk structure, removing large amounts of mass and affecting the viscous evolution and accretion (Najita et al. 2007). UV/X-ray photoevaporation by the host star may not be able to fully disperse the disk in a reasonable time if it is too massive or too strongly accreting, but it can remove a large amount of mass, leading to inner holes and fast disk dispersal with the help of viscous evolution (Clarke et al. 2001; Alexander et al. 2006; Gorti et al. 2009; Ercolano et al. 2009). In addition, the presence of stellar companions may contribute to the disk clearing (Bouwman et al. 2006; Ireland & Kraus 2008), although it may not be the leading cause of inner holes (Pott et al. 2010).
The observations of objects with no near-IR excess and strong mid-IR fluxes and thus optically thin/clean inner disks a few AU in size and optically thick outer disks, also called transition disks (TD; Skrutskie et al. 1990), suggests inside-out evolution to be an important disk dispersal mechanism, as predicted by Hayashi et al. (1985). Nevertheless, revealed systems where the disk dispersal processes seem to operate over larger radial distances, resulting in disks with global dust depletion (Currie et al. 2009). The connection between the different disk dispersal mechanisms is complex. Photoevaporation is efficient at dispersing the full disk only once the disk mass and accretion rate have dropped below certain levels, and it is also favored by grain growth, which decreases the shielding of the gas to the FUV radiation (Gorti et al. 2009). Grain growth and settling are suppressed by gas turbulence (Schräpler & Henning 2004), and may thus be important in the disk dead zones, but dead zones may disappear once the disk mass decreases, or never exist if the initial disk mass is too low (Hartmann et al. 2006). In addition, the relative importance of the various dispersal processes is expected to vary with time (Alexander & Armitage 2009).
Although even the youngest star-forming regions contain evolved and transitional protoplanetary disks (e.g. Hartmann et al. 2005; Fang et al. 2009), such objects with reduced IR excess seem to become increasingly frequent with cluster age (Megeath et al. 2005; SA06; Lada et al. 2006; Hernández et al. 2007; Sicilia-Aguilar et al. 2009; Currie et al. 2009; Muzerolle et al. 2010). Nevertheless, there is still substantial debate regarding the definition of transition and evolved disks and where to place the limits to distinguish them from primordial ones, as quantifying mass depletion and the presence of inner holes is not easy without complete multiwavelength data and spatially resolved observations (Luhman et al. 2010; Currie & Sicilia-Aguilar 2011). The changes in the spectral energy distribution (SED) and thus, in the dusty disk component, observed with age are accompanied by a decrease in the accretion rate (Hartmann et al. 1998; Sicilia-Aguilar et al. 2006b, 2010), which even drops to undetectable or zero levels for roughly half of the transition objects (Sicilia-Aguilar et al. 2006b, 2010; Muzerolle et al. 2010). The optically thin emission of silicate grains (Calvet et al. 1992; Natta et al. 2000) also indicates dust evolution from ISM-like to larger and crystalline grains (Meeus et al. 2001; Bouwman et al. 2001; van Boekel et al. 2003; Kessler-Silacci et al. 2005; Furlan et al. 2005; Watson et al. 2009). Global disk structure (Lommen et al. 2010) and accretion/turbulence in the disk (Sicilia-Aguilar et al. 2007; from now on SA07) are thought to affect the grains we observe in the disk atmosphere (Dullemond & Dominik 2008; Zsom et al. 2011). Therefore, dust mineralogy can be used as a tracer of the energetic processes in the disk and the effect of turbulence and transport in the innermost regions.
Evolved clusters and star-forming regions constitute an ideal laboratory to explore the characteristics and effects of disk dispersal, studying dust properties and disk structure for statistically significant samples of objects. One of the most interesting and well studied evolved regions is the Cep OB2 association (Patel et al. 1995; Patel et al. 1998), located at 900 pc distance (Contreras et al. 2002) and containing the clusters Tr 37 and NGC 7160 (Platais et al. 1998). These clusters have been extensively studied at optical wavelengths in order to determine the membership, spectral types, extinction, the presence of accretion, and the accretion rate for a large number of solar-type members. The approximate median ages derived from the solar-type members are 4 and 12 Myr for Tr 37 and NGC 7160, respectively (Sicilia-Aguilar et al. 2004, 2005). Our observations (SA06; SA07) revealed strong disk evolution. The disk fractions for the solar-type stars are 45% in Tr 37 and 4% in NGC 7160, and a large fraction of the objects present IRAC fluxes systematically lower than younger regions (e.g. Taurus; Hartmann et al. 2005) that suggest important grain growth/dust settling. Although among the objects with MIPS detections the number of evolved disks in Tr 37 is not much different than what is seen in Taurus (Luhman et al. 2010), the cluster lacks very massive and strongly accreting objects (with GM Cep being the only one in the region, Sicilia-Aguilar et al. 2008a) and a substantial fraction of objects have very low IRAC excesses and MIPS fluxes below the detection limits, characteristics of transitional or very evolved (strongly settled and likely dust depleted) disks. Up to 20% of the disks have no or very small near-IR excesses at 6m ([3.6]-[4.5]0.2), being thus empirically classified as TD111Note that there is still lack of consensus regarding the definition of TD. We apply here the definition we used previously in SA06, while some authors include as TD those showing global or homologous dust depletion (e.g. Currie et al. 2009), or use stronger near-IR constrains to ensure the presence of a cleared inner hole (e.g. Luhman et al. 2010). We also put our focus on discussing the different disk structures and the physical processes to which they can be related, rather than on the naming conventions.. Accretion rates or strong constraints on the accretion (via high-resolution H spectroscopy) are available for a large number of members (Sicilia-Aguilar et al. 2005, 2006b, 2010), and previous IRS observations revealed a large variety in the shape of the silicate emission and a weak correlation between grain size and accretion (SA07).
Here we present 31 new IR spectra of T Tauri stars (TTS) in the Cep OB2 region obtained with IRS, and 1.3 millimeter observations obtained for 34 objects with the IRAM 30m telescope, both intended to study and constrain the structure of evolved disks. In Section 2, we introduce the new observations and also reanalyze our previous IRS/IRAC/MIPS results. In Section 3, we model the properties of the silicate features and the global SEDs in order to derive the mineralogy and disk structure. We then discuss the different implications of the observed dust mineralogy and disk structure for disk dispersal evolution in Section 4, summarizing the results in Section 5.
2 Observations and data reduction
2.1 IRS data
We obtained m low-resolution spectra () of 31 members of the clusters Tr 37 and NGC 7160, within the Cep OB2 association, with the Infrared Spectrograph (IRS, Houck et al. 2004) on-board of . Our data were obtained within our GO program 30523, observed between 2006 and 2008. To improve the statistics, adding up to 59 objects (56 of them solar-type stars), we also include here the data from our program 8 (already published; SA07), and five objects from program 3137, already public, (14-141, 72-875, 72-1427, 21364762, 21362507222The ID of objects listed in this work correspond to the numbering used in our previous optical papers (see Sicilia-Aguilar et al. 2005; SA06)). The objects in program 30523 were selected among the more than 100 disked objects detected with IRAC and/or MIPS by SA06, avoiding those that presented a complicated background or nearby bright sources. We did not intend to obtain a complete collection, but to sample the different types of disk morphology (from flared, Taurus-like disks, to TD with inner holes) and accretion rates (ranging from 10-7 to few times 10-10 M⊙/yr, and including some non-accreting TD) revealed by our Spitzer photometry and optical study. The complete sample with the basic properties of the objects is listed in Table 1. Many of the disks are substantially evolved, with IR fluxes well below the Taurus median, although we also include a few very active disks, one of which is the variable star 13-277 (also known as GM Cep). GM Cep, together with the brightest among the TD, 21392541, were also observed with the high resolution IRS modules. The targets for programs 8 and 30523 were positioned in the slit using the high accuracy PCRS peak-up before the observations.
Our reduced low-resolution spectra are based on the droopres products processed through the S15.3.0 (program 30523) and S18.6.0 (program 3137) version of the data pipeline. For consistency, we also re-reduced the data from program 8 using a more recent pipeline, S16.1.0, finding no significant differences with our previous data reduction333Reduced spectra can be provided upon request by contacting the authors.. Pixels flagged by the data pipeline or by visual inspection of the images as “bad” were replaced with a value interpolated from an 8 pixel perimeter surrounding the errant pixel. Our data were further processed using spectral extraction tools developed for the “Formation and Evolution of Planetary Systems” (FEPS) science legacy project (see also Bouwman et al. 2008), based on the SMART software package (Higdon et al. 2004). The spectra were extracted using a 6.0 pixel and 5.0 pixel fixed-width aperture in the spatial dimension for the observations with the first order of the short- ( m) and the long-wavelength ( m) modules, respectively. The low-level fringing at wavelengths m was removed using the irsfinge package (Lahuis & Boogert 2003). To remove any effect of pointing offsets, we matched orders based on the point spread function of the IRS instrument, correcting for possible flux losses (see Swain et al. 2008 for further details). This was especially important for the objects from program 3137, which systematically presented offsets up to 2” from the real position. The background was subtracted using associated pairs of imaged spectra from the two nodded positions along the slit for most of the objects, also eliminating stray light contamination and anomalous dark currents. A few stars are embedded in nebulosity (73-472, 14-141, 21-998, 21364762), having a background that suffers from variations on small spatial scales. For them, the standard method (subtracting the nodded spectra from each other) could not be used for the background correction, and we applied a customized routine for background subtraction. After bad pixel correction and flatfielding, the two–dimensional spectra for each of the nod–positions were extracted. The source positions in both nods were matched (they are typically at 1/3 and 2/3 of the spatial dimension) and the spectra combined. The source is then in the center of the spatial axis of the combined spectrum. For each wavelength resolution element a second- or third-oder polynomial was fitted to the regions to the left and right of the source spectrum, carefully avoiding the edges of the detector. These polynomials are evaluated in the central (source) region and subtracted as background. While this procedure results in increased uncertainty for the faintest sources, the extracted SEDs are in excellent agreement with the IRAC and MIPS photometry.
The spectra were calibrated using a spectral response function derived from multiple IRS spectra of the calibration star Doradus and a marcs stellar model provided by the Science Center. The spectra of the calibration target were extracted in an identical way as our science targets. The relative errors between spectral points within one order are dominated by the noise on each individual point and not by the calibration. We estimate a relative flux calibration across an order of % and an absolute calibration error between orders/modules of %, which is mainly due to uncertainties in the scaling of the marcs model.
The high-resolution data for GM Cep and 21392541 were reduced using the standard pipeline developed for the C2D data (Lahuis et al. 2006, 2007). The C2D pipeline is based on the SMART routines (Higdon et al. 2004), and includes advanced reduction and calibration routines developed for the C2D and FEPS data in order to perform the full aperture and optimal PSF extraction and pointing correction. The observations included separate sky observations, in order to improve the background subtraction. The data reduction starts with the SSC pipeline RSC products, which are corrected for crosstalk, in addition to the other corrections of the Basic Calibrated Data (BCD). The spectrum is extracted by using an optimal, wavelength-dependent PSF fitting. The full aperture spectrum is also extracted separately, in order to check for extended emission. The flux calibration is based on a large number of high-S/N calibrator stars and the marcs stellar model provided by the Science Center. The extracted spectra were corrected for fringing (Lahuis & Boogert 2003), the orders were matched, and the data were corrected for the flux loses due to pointing offsets. The bright star GM Cep is well detected with the high-resolution IRS modules, but the object 21392541 is too faint, and its spectrum could not be extracted.
2.2 IRAM 30m observations
A total of 34 members of Cep OB2 were observed at 1.3mm with the bolometer at the IRAM 30m telescope (see Table 2). The observations included most of the objects with IRS spectra, and took place within 3 different programs carried out between 2006 and 2009 (142-06, 132-07, 145-08) as part of the MAMBO Pool Observations, using the MAMBO2 117 channel bolometer. In addition, GM Cep had been previously observed with IRAM and the MAMBO1 37 channel bolometer (Sicilia-Aguilar et al. 2008).
All observations were performed as standard ON-OFF scans, with each scan including 10 min on-source and 10 min off-source integrations, divided in 1 min integrations following the ON-OFF-OFF-ON sequence. For each source, we obtained between 1 and 10 scans, varying the position (by observing at different times) and distance (30-70”) of the off-source pointing for repeated observations. The beam of the telescope at 1.3mm is 11”. While for most of the objects this is enough to avoid contamination by nearby sources or nebular emission, the bolometer observations revealed extended emission in a couple of cases (see Table 2), which are therefore excluded from this study. Skydip observations were performed every 2-3 hours or more frequently, depending on the weather, in order to determine the sky opacity, . The pointing and flux calibration were done using the nearby sources LK H 234 and NGC 7538, from the IRAM Pool catalog, and the planet Uranus.
The data were reduced using the MOPSIC pipeline, specially developed by R. Zylka for the reduction of ON-OFF observations. The MOPSIC pipeline uses the RSD (Resampled Signal and then the Difference) to subtract the atmospheric emission from the data while minimizing the sky noise444See http://iram.fr/IRAMFR/ARN/dec05/node9.html, which is measured from the correlated signal of adjacent pixels. The total emission is calculated taking into account the measured in the skydip observations and the elevation of the source, and calibrated according to the flux calibrators above mentioned. The final result is the weighted mean of all the scans. For each source, we started reducing all individual scans, in order to detect potential problems. In particular, observations taken during the winter 2007 (program 132-07) suffered from sporadic technical problems due to malfunctions in the preamplifier. The affected scans, together with other scans suffering from poor weather or spikes, were labeled and removed. Finally, the good scans were reduced together for each source. The final fluxes (or 3 upper limits in case of non-detection) are given in Table 2, together with the estimated disk mass based on the Beckwith et al. (1990) prescription, for an opacity ν=2 cm2 g-1 at 1.3mm. Interestingly, we do not find any correlation between the estimated disk masses and the accretion rates, except for the fact that the most massive disk corresponds to the strongest accretor, GM Cep.
2.3 IRAC/MIPS
The IRAC and MIPS data for the cluster members had been presented in SA06. Given the improvement of the pipeline and calibration since then, we have re-reduced the data and redone the photometry for the objects analyzed here. In addition to our IRAC/MIPS data (AORs 3959040 and 4316416 for Tr 37, 3959296 and 4320000 for NGC 7160), we have also analyzed the archive data from AORs 6051840, which include a few of the objects to the west of Tr 37 that were out of our original field.
The data reduction was done with the Mosaicking and Point-source Extraction pipeline (MOPEX555http://ssc..caltech.edu/dataanalysistools/tools/mopex/). The mosaics were created from the BCD data, using standard parameters for each band and including the masks for detector artifacts and associated status masks. The process included pointing refinement and background matching to produce uniform mosaics. Short and long exposures were treated separately. AORs 3959040 and 3959296 contained 5 individual images per pointing in both the short (1s) and long (26.4s) exposures, while the total exposure time of AOR 6051840 was 4.8s. MIPS AORs 4316416 and 4320000 mapped the region with median exposure times 78s. Aperture photometry was done with the APEX multiframe pipeline within MOPEX for IRAC channels 1,2, and 3. The presence of substantial extended emission in IRAC channel 4 and MIPS 24m in Tr 37 precluded the use of APEX for the photometry at these wavelengths, which was then done using IRAF standard tasks within the and packages. The apertures and sky annuli were 3 and 12-20 pixels for IRAC, and 13” and 20-32” for MIPS, which are standard values. The corresponding aperture corrections were taken from the IRAC and MIPS Handbook, being 1.112, 1.113, 1.125, 1.218, and 1.167 for the 3.6, 4.5, 5.8, 8.0, and 24m bands, respectively. Given that long-exposure images suffer more often from scattered-light artifacts and extended nebular emission, we preferentially use the short-exposure photometry for objects detected in the short-exposure mosaics with high signal to noise ratio (S/N). Nevertheless, in most cases the differences for objects detected in both short and long exposure mosaics are negligible.
The newly reduced data (see Table 3) agree very well with our previous results, and the use of smaller apertures improves the observations of the objects with complicated background within the Tr 37 globule, whose IRAC and MIPS magnitudes are now in better agreement with the IRS spectra. The new MIPS data for NGC 7160 also shows a better agreement with the IRS spectrum of 01-580, due to a better background treatment. The IRAC photometry of two objects (21364762 and 72-875) is strongly contaminated by nebular emission, being thus excluded from the analysis.
3 Analysis
3.1 SEDs and silicate features
For the solar-type stars that conform most of our sample, the region from 5.4m to 35 m traces disk material located at 0.1 to 30 AU (Calvet et al. 1992; Chiang & Goldreich 1997), and 1.3mm observations are sensitive to the bulk of the disk mass (Beckwith 1990). In order to complete our picture of the objects, we include the available optical photometry (see Sicilia-Aguilar et al. 2004, 2005, 2010). The spectral types and extinctions are known for most of the members (Sicilia-Aguilar et al. 2005). In the few cases where this information is not available, we take the initial extinction to be the cluster average (AV=1.670.45 mag; Sicilia-Aguilar et al. 2005) and obtain an approximate spectral type and a corrected extinction by fitting the SED to different marcs models (Gustafsson et al. 2008). The SED fitting also lead to better extinction estimates for a few objects (72-875 and 21362507 have slightly higher extinctions than estimated before, A2 and 3.5 mag, respectively). The offsets between optical/2MASS/ data in a few objects are typically related to known strong variability (e.g. 82-272, GM Cep). The SEDs, compared to the photospheric emission given by the marcs models (for the low-mass stars) and to the stellar photospheres in Kenyon & Hartmann (1995; for the intermediate-mass stars) are displayed in Figures 1-12 (arranged according to their SED types, see Section 3.3). Tables 4 and 5 offer a summary of the previously published optical and 2MASS JHK data.
Figures 13 to 17 show the details of the 10m silicate features. Most of the sources present the characteristic silicate emission found in TTS, due to the presence of a mixture of small (0.1-6m), warm (150-450 K) silicate grains with amorphous and crystalline components (e.g. Natta et al. 2000; Bouwman et al. 2001; Meeus et al. 2003). Although silicate emission is present in most disks, it is not evident in a few cases. In addition to the intermediate-mass stars CCDM+5734 and KUN-196, the 10m silicate emission is not visible in 72-875 nor in 11-2322. The first object is a TD with very low accretion rate (the lack of IRAC data does not allow to check the presence of near-IR excess, but the shape of the IRS spectrum suggest photospheric flux down to 5-6 m), so the lack of silicate emission could be due to a real depletion of small grains in the innermost disk. On the other hand, 11-2322 is a M1 star with IR excess at all wavelengths, so the lack of silicate emission could be due to strong grain growth and settling (in fact, due to the S/N limitations, we cannot exclude the presence of some few-micron grains in this object), as has been suggested for the Coronet cluster (Sicilia-Aguilar et al. 2008b). A few more disks have weak (or no) silicate emission, including some TD (92-393, 24-1796) and normal disks (11-1209, 11-2131, 21-998, 21-33).
A few other objects show atypical silicate emission. One of the TD (24-515) shows only evidence of crystalline silicates, suggesting that most of the amorphous grains are in large (few-microns) aggregates. The spectroscopic binary 82-272 presents prominent emission at 11 m, suggestive of a dominating forsterite dust component, as has been observed for RECX-5 in the Cha cluster (Bouwman et al. 2010), and 21380979 could be another forsterite source. A few other sources have strong enstatite emission at 9.3 m (e.g. 13-236, 21395813, 23-570). The emission of 21-2006 and 21384350 is mostly consistent with amorphous silica (note that 21384350 is also partially affected by the strong emission of a bright nearby object), and 12-2519 may be another silica source. Nevertheless, due to the complex shape of the continuum, extracting the silicate emission from the spectrum is complicated in TD and in objects with small near-IR excesses whose SEDs show a change in the slope around 6–12um (what we call ”kink” disks, see SA06). The features observed in 24-1796 and 12-2519 could be affected by the strong change in the SED slope occurring at these wavelengths, although the crystalline features in 12-2519 reveal that at least some small crystalline grains are present in this disk.
3.2 Disk mineralogy and grain size derived from the silicate feature
In order to study the disk mineralogy, we fit the optically thin silicate emission using the Two Layers Temperature Distribution (TLTD) method, developed by Juhász et al. (2009), from now on J09. We exclude from the fitting procedure and subsequent mineralogy analysis the objects with low S/N (S/N20), those with no evidence of silicate emission, and those suffering from strong contamination by nearby sources or nebular emission in the 10m region (e.g. 21384350). Although the silicate emission at 10m and 20m traces only a small part of the dust content in the disk (small grains in the optically thin disk atmosphere with temperatures T150-450 K; Calvet et al. 1992; Natta et al. 2000), the presence or absence of crystalline grains and the grain size can reveal information about heating processes in the disk, irradiation, transport and turbulence (Meeus et al. 2001; Honda et al. 2003; Dullemond et al. 2006; Dullemond & Dominik 2004, 2008; Watson et al. 2009; Zsom et al. 2011).
The TLTD method (see J09 for details) reproduces the silicate feature using a multicomponent continuum, including emission from the stellar photosphere, an inner rim, and the optically thick disk midplane. It considers a collection of four different dust species with sizes 0.1, 1.5, and 6.0 m: amorphous silicates with olivine and pyroxene stoichiometry (Dorschner et al. 1995), forsterite (Sogawa et al. 2006), amorphous silica (Henning & Mutschke 1997); and, in addition, enstatite grains (Jäger et al. 1998) with sizes 0.1 and 1.5 m (since the emission of 6m enstatite grains is indistinguishable from the continuum in cases of low S/N; see J09). The mass absorption coefficients are calculated from the material optical constants assuming that the crystalline grains can be assimilated to a Distribution of Hollow Spheres (Min et al. 2005), and considering standard Mie theory for spherical particles for the amorphous dust. The main difference with standard one- or two-temperature fitting methods is that the TLTD model considers that the emission originates in regions characterized by a continuous distribution of temperatures. Therefore, the flux can be written as (see J09 for further details):
| (1) |
where the flux in the continuum is:
| (2) | |||||
| (3) |
Here, and are the radius and effective temperature of the star. The temperatures of the disk atmosphere, rim, and midplane (, , and ) are parameterized as power laws of the radius (with exponents qa, qr, and qm, respectively) and vary between a minimum and a maximum value. The exponents of the temperatures (qa, qr, qm) and the coefficients of each contribution (, , , and ) are fitted to the data using a genetic optimization algorithm (PIKAIA, Charbonneau 1995; see J09). The uncertainties in the IRS spectra are estimated by adding random Gaussian noise to the original spectrum at the noise level, and then repeating the fit 100 times. The final silicate composition, the total crystalline fraction, and the average grain sizes are obtained as the average of the whole set, and the errors are derived from the standard deviation in the positive and negative direction. Since the mineralogy at different radial distances is not necessarily the same and the S/N of our spectra is also strongly wavelength-dependent, we fitted separately the 7-14 and 17-35m ranges, as we have done before for similar sets of data (Sicilia-Aguilar et al. 2008b). In the long-wavelength region (17-35m), the emission of large amorphous grains strongly resembles the continuum, so the crystalline fractions may have a tendency to being overestimated.
The results are displayed in Tables 6-9 and the fits to the silicate features are shown in Figures 13-18. As in our previous studies, we find that the TLTD model with the assumed grain compositions and size distribution reproduces very well the observed features at both short and long wavelengths. The residuals do not suggest the presence of other additional components, and the main source of uncertainty in the models is the S/N of the spectra. The sensitivity to large grains depends strongly on the S/N of the spectrum: The emission from grains larger than 6m is not very different from the continuum emission in this wavelength range, so separating the emission of large grains from the continuum is only possible in objects with high S/N, and the maximum grain size detectable in noisy spectra (S/N20-50) may be underestimated. Therefore, in order to extend the study of the grain size to all spectra, we also measured the peak of the silicate feature by normalizing the spectra to the continuum obtained by fitting a straight line between the average values in the regions 7.2-7.4m and 12.6-12.7m (the peak values are listed in Table 1). This is a similar procedure to what we used in SA07, and provides a good estimate of the grain size in objects with low S/N. The normalized peak is strongly correlated with the grain size (see Bouwman et al. 2008), as objects with larger grains show shallower and broader features. For our sample, the correlation between measured silicate peak and fitted grain size is very strong, with a Spearman rank coefficient -0.57 (range -0.77 — -0.26) and a probability p=910-5 that the two quantities are uncorrelated, even though the continuum fit used to measure the normalized peak is not the same defined by the TLTD models. The disk mineralogy derived here is further analyzed in Sections 4.1 and 4.2, where we compare the dust characteristics with the stellar and disk properties.
3.3 Tracing the global disk structure with RADMC
In order to explore in more detail not only the disk mineralogy, but also the global disk structure, we have performed detailed modeling using a full 2D radiative transfer code. Our aim with this analysis is not to produce accurate fits to the SEDs of the individual objects in the region, but to understand the types of disk structures that reproduce the observed SEDs. Detailed, full-disk models offer an advantage over simple silicate-feature fitting procedure, which is that the whole disk structure is taken into account, allowing to explore the global disk details together with the grain size distributions. This is particularly important in objects where the SED slope changes at the wavelengths where the silicate emission appears, for which defining the continuum level with a simple model can be uncertain and lead to variations in the strength and width of the extracted silicate feature and thus errors in the estimated grain size. Given the various morphologies of the disks in our sample, up to 20% of our objects could be affected by this continuum uncertainty (see Figures 13-17 and comments in Table 8).
We explored what are the minimal changes that need to be performed to a normal CTTS disk structure in order to reproduce the observed SEDs. For this purpose, we have selected 10 prototype disks with different SED morphologies that represent the main types of objects observed in the Cep OB2 region (see Table 10 for a detailed summary of the prototypes and their properties). The prototype disks include: a normal TTS disk with silicate emission (model 1, prototype 11-2037), a very massive and flared disk (model 2, prototype GM Cep), a dust-depleted CTTS (model 3, prototype 13-236), a strongly depleted and settled disk (model 4, prototype 11-1209), a “kink” or pre-transitional disk (model 5, prototype 13-1250666This object had been previously classified as TD, but the new IRAC photometry produces a color slightly over our TD cutoff, being rather an example of a pre-transitional (Espaillat et al. 2010) or “kink” disk, according to its IR colors.), a depleted but strongly accreting disk with strong silicate emission (model 6, prototype the old disk around 01-580 in NGC 7160), a classical (large 24m flux or “turn-up”) TD with weak silicate emission (model 7, prototype 24-1796), a classical TD with strong silicate emission (model 8, prototype 14-11), a TD with no silicate and low 24m flux or settled TD (model 9, prototype 92-393), and a settled TD with strong silicate emission (model 10, prototype 13-52).
All disks, with some variations due to differences in stellar luminosity and mineralogy, can be classified within one of these subtypes. Note that we exclude from this classification the 3 intermediate-mass stars (CCDM+5734, KUN-196, and DG-481) since they are most likely TD with very large inner holes and low dust masses, or debris disks. The SEDs in Figures 1-11 have been arranged according to this classification, and the SED type is also listed in Table 1 for each object. Figure 19 helps to visualize the SED type, which is based on the SED shape and the silicate feature. We do not attempt to define a unique set of indices for SED classification, but to organize the SEDs observed in Cep OB2 in order to explore the underlying physics and disk structures. Given that the disk slope is far from constant in the IR, especially for the disks with inside-out evolution, we checked the SED slope, , at different wavelengths, considering for this the 2MASS, IRAC, MIPS, and IRS data. From the IRS data, we derive the fluxes at 5.8, 8, 12, and 17m by integrating the flux in a 0.8 m interval around these wavelengths. For longer wavelengths, we also derived the flux by integrating within a 2m interval centered at 23 and 33m. Although both the 23 and 33m photometric points could be affected by forsterite emission, strong crystalline features are only present in very few sources, so general trends should remain unaffected. In general, for the plots and the analysis, we give priority to the IRS-derived slopes, using the IRAC and MIPS values whenever no IRS data was available. In any case, IRAC, MIPS, and IRS data are in excellent agreement. The SED slope values are listed in Table 11. For the SED classification, we note that we consider as TD those with [3.6]-[4.5]0.2 and small or negligible near-IR excess, since also a few normal CTTS (e.g. 14-183) have [3.6]-[4.5]0.2. We also list as TD some objects with [3.6]-[4.5]0.2-0.25 and strong turn-ups (72-1427, 73-472, 21392541, 21392570), since their SEDs are more similar to our TD prototypes than to other models (e.g., “kink” disks or depleted CTTS).
We used the RADMC radiative transfer code package777See http://www.mpia.de/homes/dullemon/radtrans/radmc/ (Dullemond & Dominik 2004) for modeling 3-D axisymmetric circumstellar dust configurations. This package was described and first used in Dullemond & Dominik (2004), and has been extensively used and tested over the last 7 years for continuum radiative transfer in protoplanetary disks and for computing the disk structure (see for instance Pascucci et al. 2004; Pinte et al. 2009). Although the code assumes axially symmetric density distribution (2D), photon packages are followed in 3D. The code uses a variant of the Monte Carlo method of Bjorkman & Wood (2001) to compute how the stellar photons penetrate the disk and determine the dust temperature and scattering source function everywhere in the disk. Using volume ray-tracing the spectra and images can then be determined at any inclination. For evolved disks, which can be very geometrically thin, special care is taken of the grid, ensuring that the vertical structure of the disk is always well resolved. RADMC can handle multiple dust size and/or composition populations, each having its own spatial distribution. This makes the code well suited for studying how dust growth/fragmentation/settling affect the SED of the disk. In case of different dust distributions (e.g., for the innermost and outer disk), the temperature of each one is treated separately, although for simplification all the grains contained in a collisional equilibrium size distribution are assumed to have the same temperature, independently of their size.
We run different RADMC models in order to reproduce the full SED of the prototype disks, using the stellar parameters effective temperature, stellar radius, and stellar mass Teff, R∗, M∗ derived from the spectral types and optical photometry (see Table 10). The disks are modeled in the simplest way, assuming a pressure scale height (Hp) that varies as a power-law with the radius, Hp/RR1/7 . We observed that models with well-mixed dust and gas in hydrostatic equilibrium failed to reproduce the disks, so the scale height at the outer disk radius, Hrdisk/Rdisk, had to be set for each case. This procedure is equivalent to including some degree of settling in the model. Although settling is likely to affect differently grains of different sizes, our simple model assumes that all the grains have the same scale height and are well mixed. We also assume a negligible accretion rate, which is true for most of the objects in Cep OB2, given their typical Ṁ10-8–10-9M⊙/yr rates. The disk surface density is estimated from the total disk mass, assuming that it follows a power law of the radius with exponent -1. In all cases, we take the gas-to-dust ratio to be 100, and the total disk mass is varied to fit the millimeter emission and the shape of the mid-IR flux as seen in the IRS spectra. This method allows to better reproduce the dust content in evolved disks where we may expect strong grain growth, anomalous gas to dust ratios, and variable viscosity and accretion rate with the radial distance. We note that for most objects, the total disk masses inferred from the millimeter and 20-30m data are below the values one would expect to account for the typical accretion rates of 10-8–-9M⊙/yr, which is suggestive of strong grain growth and/or anomalous gas-to-dust ratios. The outer disk radius is relatively unconstrained, as the main parameter is the total assumed disk mass. For each case, we explored different sizes for the inner hole by setting the temperature of the disk inner rim, from no hole or dust distribution starting at the dust destruction radius, T1500 K, up to few-AU cleared holes, or inner rim temperature 150-200 K. We explored different silicate grain size distributions, assuming a collisional power-law distribution with an exponent -3.5 and a minimum and a maximum grain size, which vary between 0.1-10m and 100-10000m, respectively. A total of 25% of amorphous carbon dust was also included in all the models, assuming the same grain size distribution for carbon as we do for silicate grains. Since the inclination of the objects is unknown, we assume always a 45 degrees angle.
We regulated the amount of crystalline silicates in the disk by assuming that the innermost disk is fully crystalline up to a given (variable) radius (rcrys), after which the amount of crystals decays as predicted by simple mixing models (see Pavlyuchenkov & Dullemond 2007) until the grains are totally amorphous. Given that our models are to be understood as a representation of a large collection of objects that have different silicate features, we did not try to reproduce exactly the silicate profiles of the prototypes nor to derive their mineralogy, but to obtain roughly similarly strong or weak features. Therefore, we gave priority to studying the amorphous grain population, excluding crystalline grains in the cases where their presence is not important/evident. For simplicity, we also do not assume any radial dependency of the chemical composition of the dust, since our analysis of the short- and long-wavelength regimes of the IRS spectra does not provide conclusive evidence for it. In most models, dust populations with different grain sizes for the innermost and outer disk are required in order to fit the SED. Here we followed a similar approach as for the crystalline grains, assuming a given uniform composition up to a radius rcomp, after which it is progressively replaced by the outer disk composition (Pavlyuchenkov & Dullemond 2007). Table 12 lists the properties of the best-fit models, which are displayed in Figures 20-24.
3.3.1 Model 1: Normal CTTS
A normal CTTS disk can be easily reproduced with a relatively massive disk (M0.01 M∗, assuming a gas to dust ratio 100) with grains varying between 0.1 and 10000 m. Large grains are required in order to fit the millimeter data within a reasonable disk mass. Nevertheless, we find that even such a disk presents some degree of settling, as the assumption of hydrostatic equilibrium between gas and dust invariably produces a too large near-IR excess to fit our prototype #1. This group is the most numerous among the objects observed here, as well as those with IRAC and MIPS data from SA06. This suggests that even the most pristine-like disks in the Cep OB2 region have already experienced substantial grain growth and settling, which is consistent with the findings of Manoj et al. (2011) in the Chamaeleon I region.
3.3.2 Model 2: Massive disk
Reproducing a very massive disk like that of GM Cep does not lack difficulties. The relatively low far-IR flux, compared to the millimeter data, is hard to reconcile unless other elements are added to the model. In Sicilia-Aguilar et al. (2008a) we tried an extra black body-like component, that could be interpreted as an increase of flaring at some 30-50 AU. With RADMC, we manage to reproduce the strong near- and mid-IR flux with a very massive (0.052 M⊙, assuming a gas to dust ratio 100) and strongly flaring or relatively thick disk (Hrdisk/Rdisk=0.2 at the outer disk radius) with a small grain population in the innermost disk (only 0.1 m grains) that turns into a mixed population (0.1-100 m) after 3 AU. Nevertheless, this model still fails to reproduce the very strong silicate feature, and its flux in the mid-IR is higher than observed. Assuming a smaller disk mass lowers the mid-IR flux, but this fails to produce the high millimeter flux. Given that its high-resolution IRS spectrum suggest that the object is extended (see Section 4.4), the most plausible solution is the presence of an envelope or surrounding nebulosity heated by the star, in which case the disk mass could be lower. Two more disks in Tr 37 appear very flared as well, with SED slopes similar to GM Cep, 21374275 and 93-720. Nevertheless, the lack of millimeter detection for 93-720 suggests a much lower disk mass, and we have no evidence of the presence of an envelope for any of them, although 21374275 is embedded in a small patch of nebulosity near CCDM+5734.
3.3.3 Model 3: Depleted CTTS
Several objects in Tr 37 show very strong near-IR excesses, comparable to typical CTTS, but comparatively low mid-IR fluxes. Their silicate features are usually small (but noticeable). Such SEDs require a slightly flattened/settled disk, with vertical scale height Hrdisk/Rdisk=0.13 and a normal dust population including submicron to millimeter grains, but the disk mass must be always extremely low (2 10-4 M∗, assuming a gas to dust ratio 100). Such a low disk mass would be consistent with a classification within the homologously depleted TD (Currie et al. 2009; Currie & Sicilia-Aguilar 2011), although their near-IR excesses are strong and their accretion rates are in general high (510-9M⊙/yr for the prototype 13-236). This last point suggests that the total gas mass is probably much higher than what we estimate from dust observations. Some extra small grains in the innermost disk, not following the collisional distribution (see option B in Table 12), a puffed inner rim, or differential settling, may account for the higher near-IR excesses observed, compared to a pure settled model, although too much differential settling would result in a silicate feature much stronger than observed (Dullemond & Dominik 2008; see also our model #6). A disk composed of only submicron grains, where grain coagulation has not been able to proceed, would also produce a similar SED. The very low mass of the disk and strong small dust depletion could also be indicative of planetesimal formation. In this case, the total gas mass of the disk could be higher, thus explaining the relatively large accretion rates observed. Note that we include within this group the star 21364762, given its steep IRS spectrum with very weak silicate features, although its flux at 14m is uncertain due to nebular emission, and from the high accretion rate suggested by its veiled spectrum (Sicilia-Aguilar et al. 2005), it could be that its disk is more massive than the rest of type #3 objects.
3.3.4 Model 4: Globally settled/depleted disk
In order to reproduce this type of SED, with nearly zero near-IR excess and strongly settled at all wavelengths, a low disk mass (0.005M∗, assuming a gas to dust ratio 100), very small vertical pressure scale height (Hrdisk/Rdisk=0.02), and relatively large minimum grain size (6 m) are required. As in model #3, the low disk masses and settled SEDs make them candidates for homologous dust depletion (Currie et al. 2009), despite their full gas masses are hard to quantify. Nevertheless, the models that reproduce the steep slope and small excess in the near- and mid-IR usually generate too little flux at around 5-6 m. Adding an extra population with small grains in the inner disk (as we do in models #5 and #10, see below) does not increase the flux in this region due to self-shadowing, and increasing the disk thickness or flaring is not possible if we want to reproduce the mid-IR SED. Therefore, we speculate that these SEDs, strongly affected by settling, may still have some variations in the vertical scale height with radius, a puffed-up inner rim or gap edge, and/or some degree of differential settling resulting in different vertical scales depending on particle size.
3.3.5 Model 5: “Kink” disk
The presence of disks with low near-IR excess and a sudden change of slope around 6–12 m is characteristic of Tr 37, as appears reflected in the median disk SED (SA06). The global structure of the disk can be well reproduced by a model with two different grain distributions, one for the innermost disk (5 AU) with a large minimum grain size (10 m), and another one for the outer disk with smaller grains. A small vertical scale height is also necessary. Nevertheless, such a distribution cannot explain the strong silicate features generally observed. An extra small dust component in the innermost disk is needed. Instead, assuming that the innermost disk (0.5-2 AU) has a small grain population (e.g. 0.1 m grains) and the rest is populated by a collisional distribution with larger grains (minimum grain size 1-10 m) can reproduce the near-IR and silicate feature quite well (with a tendency to overestimating the near-IR flux), but fails to reproduce the high mid-IR excess and the “kink” shape. We therefore believe that these objects suffer from stronger grain growth in the inner disk than in the outer disk, but the (inner) dust distribution may be anomalous. They can be considered then as a special case of Model #9 (see below) with an extra small dust population in the innermost disk. An extra population of small grains has been also included to explain the SEDs of pre-transitional disks with inner gaps (Espaillat et al. 2010), which have similarly low near-IR excesses, strong silicate features, and strong excess at 6m.
3.3.6 Model 6: Old surviving, dust-depleted disk with strong silicate
This model is based on the strongly accreting (Ṁ410-8M⊙/yr) but dust-depleted disk present around 01-580, the only accreting star in the 12 Myr-old cluster NGC 7160. The star 91-506 in Tr 37 has similar IR colors, although it is younger and its higher 24m flux and millimeter data indicate that it has a more massive disk. The SED is characterized by a low mid-IR excess as in the models of depleted disks, together with a strong near-IR and very strong silicate feature. A very low disk mass (510-4M∗, assuming a gas to dust ratio 100), together with strong settling (vertical pressure scale height Hrdisk/Rdisk=0.09 ) are needed in order to produce the flattened SED, as in models #3 and #4. But, in contrast to the mentioned models, this prototype has a very strong silicate emission, which requires the presence of small grains (0.1m) in a non-negligible portion of the inner disk (2-3 AU). Alternatively, differential settling with a disk atmosphere populated only by small grains could also explain the observed SED. Indeed, Dullemond & Dominik (2008) suggested that strong silicate emission in disks with weak mid-IR excesses would be a sign of strong size-dependent dust sedimentation. As in cases #3 and #4, our model does not provide enough near-IR excess, which also calls for flaring or vertical scale changes between the innermost and outer disk, differential (size-dependent) settling, and/or presence of extra puffed-up walls around gaps. The lack of dust mass compared to the accretion rate may also hint the formation of planetesimals or planets within the disk.
3.3.7 Model 7: Classical TD with weak silicate emission
By classical TD we understand objects with reduced near-IR excess and 24m fluxes comparable or higher than those of normal CTTS (Hernández et al. 2007). Simple models with two populations of grains for the inner and outer disk cannot reproduce both the shape and silicate emission observed for our model #7 (prototype 24-1796). In order to reproduce the general shape of the SED, we need a low disk mass and a low vertical scale height, in addition to a change in grain population around 5 AU. Assuming a collisional distribution of grains 1-10000m in the innermost 5 AU and a submicron (0.1 m) dust population at longer distances, we produce a relatively good fit to the data, but the excess at 5-12 m is too high. A model with a physical dust hole (see model #8) also produces a good fit, although in this case the excess at 5-12 m is too low. We thus speculate that this SED type may result from a disk with either an optically thin dust population in its innermost part, or a change in flaring/thickness between the innermost and outermost disk. A secondary wall at few AU may also help to reproduce the large flux in the mid-IR, which can otherwise only be attained with a submicron dust grain population in the outer disk.
3.3.8 Model 8: Classical TD with strong silicate emission
In order to reproduce this type of disk, with prototype object 14-11, a physical hole with a minimum size 2 AU (t250-150 K) is required. Settled dust distributions with small grains are unable to reproduce both the negligible near-IR excess and the high mid-IR flux with a strong turn-up around 8 m. The best results to reproduce the global shape of the spectrum are attained with holes 3.5-6 AU in size, which are roughly in agreement with our toy model presented in SA07 (consisting of a single black body with T70 K to model an inner disk rim). In order to produce the observed silicate emission, an optically thin population of small grains needs to be included in the inner rim (or inside the hole) of the disk, as it has been done by Espaillat et al. (2010) for pre-transitional disks. A change in composition (from submicron grains to large grains) around 6 AU produces good results in a model with a 5.5 AU hole. The vertical scale height of the disk is harder to determine with the available data: the large mid-IR excess can be obtained using a relatively large vertical scale height (Hrdisk/Rdisk0.3) with a large (10 m) minimum grain size, or a smaller Hrdisk/Rdisk with a dust distribution containing small grains (0.1 m minimum grain size).
3.3.9 Model 9: Settled TD with weak silicate emission
The small near-IR excess and relatively flat SED of our prototype #9 (star 92-393) can be reproduced with a two-population grain model, including large grains in the innermost disk (20-10000 m below 15 AU) and small grains only in the outermost part (0.1m). Including a collisional distribution with small grains in this part fails to reproduce the high mid-IR flux, and a single, large-grain distribution also underestimates the mid-IR excess. No clean hole is required in this case, which is also in agreement with our observations of accretion in the SED prototype 92-393. The mid-IR bump could also be explained with a change in flaring/extra wall at 10-15 AU. This type of SED is thus a good example of inside-out evolution. The relatively low disk mass (510-3M∗, assuming a gas to dust ratio of 100) could also be explained with planetesimal formation. The formation of planetesimals or planets in the innermost 10-15 AU would reduce the dust contain we see in this region, and could also cause the presence of a secondary wall or change in disk flaring/thickness at this distance.
3.3.10 Model 10: Settled TD with strong silicate emission
In order to reproduce the very small near-IR excess of a disk similar to our prototype #10 (object 13-52) we need a very small vertical pressure scale height (Hrdisk/Rdisk0.03) in combination with large grains (minimum grain size 1-10 m). Nevertheless, to produce the strong silicate feature we need to include some optically thin small dust (0.1m). This small amount of dust is also enough to produce the tiny excess over the photosphere observed. Nevertheless, assuming a collisional distribution with grains as small as 0.1m would produce too much near-IR excess and dilute the silicate feature, so the small grain component needs to be decoupled from the general dust distribution. A physical inner hole is not required in this case, as long as the main dust distribution has a large enough minimum size and the disk is very settled, although the lack of accretion in our prototype requires either a very low gas content or a physical hole or gap within the inner large-grain disk. This, together with the mass depletion inferred from the very low mid-IR fluxes, makes these type of disks good candidates to look for giant planet formation, where accretion onto a planet could explain the lack of significant Ṁ.
4 Discussion: Structure and properties of disks in evolved clusters
4.1 Dust evolution and stellar properties
In this section, we contrast the results of our mineralogy analysis (Section 3.2) with the known properties of the stars in our sample. Considering the limitations due to S/N and unresolved disk structure, we examine the correlation between different stellar and disk properties and the disk mineralogy inferred from the silicate feature. Several trends have been observed in the past. In our previous study (SA07), we found a correlation between the strength of the silicate peak (related to the grain size) and the age, in the sense that younger stars appeared to have weaker silicate peaks and thus larger grains in their disks atmospheres. This could be interpreted as an effect of turbulence stirring larger grains into the disk atmospheres of the younger and more turbulent stars, with older and more quiescent disks being more settled (such an effect has also been observed by Fang et al. 2011). We also found that the presence of flattened SEDs without silicate emission appeared more frequently among M-type stars than for K-type objects.
Examining the new data, we confirm again the trend of the sources with later spectral types (M) to have weaker silicate emission among the solar-type stars (Figure 25). Excluding the intermediate-mass (spectral types A and B) objects, which strongly differ in properties from the rest of the sample, we obtain a Spearman rank correlation coefficient of -0.37 (range -0.61 — -0.06), with a probability p=0.006 that the two quantities are uncorrelated. Given the correlation between silicate peak and grain size, this relation could be related to differences in disk structure, transport and/or grain processing depending on stellar mass, even though our sample contains objects down to spectral type M2.5 only. Weak silicate features have also been observed for later-type stars in different regions (Sicilia-Aguilar et al. 2008b, 2009; Furlan et al. 2011). The fact that in disks around colder, less luminous stars, a given wavelength traces a closer-in part of the disk than in more luminous objects could be partially responsible for these differences, but we emphasize that our sample is dominated by late-K and early-M stars, which are not so different in temperature and luminosity. In addition, we observe a tendency of M-type stars to have steeper SEDs, which has also been observed even in very young regions (e.g. the Coronet cluster; Sicilia-Aguilar et al. 2008b, see also Muzerolle et al. 2010; Szücs et al. 2010). This could be caused by a larger degree of dust settling or grain growth in the innermost disk, although further evidence is needed from detailed modeling of a larger number of low-mass objects. In addition, the differences between solar-type and M-type stars are not evident in all regions (Sicilia-Aguilar et al. 2009; Furlan et al. 2011), and other parameters (like the accretion rates) may also affect the SED appearance (Manoj et al. 2011).
Although there is still a weak trend for weaker silicate features being more frequent among the youngest disks, its significance is weaker after adding the new sample (Spearman correlation coefficient 0.21, in the range -0.11 — 0.49, with probability p=0.14 that there is no correlation between both quantities; note that we exclude for this analysis the stars with spectral types G and earlier, which have uncertain ages). Our extended sample also lacks strong correlations between the normalized silicate peak or grain size and the accretion rate, which is related to the turbulence level (using the most recent accretion rate estimates from Sicilia-Aguilar et al. 2010). Performing a Spearman rank correlation test, the probability that the accretion rate and silicate peak/grain size are uncorrelated are 0.46 and 0.67, respectively.
We had previously attributed these trends of silicate strength with age and accretion rate to the effect of turbulence, which is thought to be stronger at younger ages. (SA07). The main difference is that, instead of being focused on normal CTTS disks as that of SA07, our new dataset includes a large number of objects with settled and evolved disks, including many disks with signs of inside-out evolution. Exploring the different RADMC disk models, we find that settling combined with grain growth may also increase the large grain population in the disk atmosphere, as it happens in cases with strong turbulence, so the net effect of turbulence may not be evident nor easy to quantify. Recent theoretical (Zsom et al. 2011) and observational (Fang et al. 2011) studies suggest that the connection between disk turbulence and the grain size in the disk atmosphere is real.
When studying the age effects, we must also keep in mind that old disks (8 Myr) are typically rare, so studying the disk mineralogy over the whole disk life span is always limited by the paucity of old objects. Moreover, given that half of the disks have dispersed by the age of 4 Myr (SA06; Hernández et al. 2007), the long-surviving disks are probably those with initially large masses (that can stand long periods of viscous evolution and photoevaporation) and/or those for which coagulation and/or settling are far less efficient than in the typical objects. In this last case, very old objects may not be representative of the typical processes occurring in most aging disks.
Finally, as it has been observed before, we do not find any evident correlation between the crystalline fraction and the stellar properties. The fact that crystallinization and amorphization may occur at variable rates over the lifetime of the star (Ábrahám et al. 2009; Glauser et al. 2009) is probably the main cause of this lack of correlation. Since the example of EX-Lupi (Ábrahám et al. 2009) is the most remarkable one regarding strong and fast variation of grain properties, we have examined the mineralogy of the sources with known accretion variations (of 1 order of magnitude or more; Sicilia-Aguilar et al. 2010). Looking at these sources (72-875, 11-2146, 14-141, 11-2031, 13-1238, 82-272, GM Cep, 13-236, and 13-1250), we observe a tendency to having large (few microns) amorphous grains, but no evidence of any trend to higher or lower crystallinity fractions. We also do not observe any trend relating grain size and crystallinity fraction and, as had been previously found, crystalline grains are always small.
4.2 Dust evolution and disk structure
Here, we study the results of our mineralogy analysis (Section 3.2), contrasting them to global disk properties as derived from the SED slope at different wavelengths. Several previous studies have suggested that the silicate emission can be used as a tracer of the global disk structure. Bouwman et al. (2008) found a correlation between the amorphous silicate feature and the SED shape, suggestive of dust settling. Lommen et al. (2010) compared the millimeter emission with the strength and characteristics of the silicate feature, finding a weak correlation that could indicate global dust evolution throughout the disk, as has been suggested by Currie et al. (2009). Our IRS sample was especially selected to contain disks with very different structures, in order to study whether the grains in the disk atmosphere are tracers of more global processes affecting the whole structure of the disk. Many of the SEDs of low-mass disks in Cep OB2 are substantially different from those seen in younger regions, showing evidence of dust settling (at a global scale or with a radial dependence, as in “kink” disks), global grain growth and dust depletion, and inside-out evolution (from differential growth/settling to inner holes in the TD). Transition and “kink” disks (similar to the so-called pre-transitional; Espaillat et al. 2010), having a very low and/or negligible near-IR excess and an otherwise normal mid-IR excess, are prime candidates to look for inside-out disk evolution (as predicted by Hayashi et al. 1985) and to search for evidence of the different mechanisms that can evacuate the innermost disk of small dust (coagulation, planet formation, photoevaporation, binarity). On the other hand, fully settled disks and those with very low dust masses are suggestive of global or homologous disk evolution (Currie et al. 2009) happening in both the innermost and the outer disk.
We have explored the disk mineralogy derived from the silicate feature (in particular, the flux at the normalized silicate peak and the grain size) as a function of disk structure. Figure 26 displays the SED slopes (, see Section 3.3) at different wavelengths together with the peak height of the normalized silicate feature. Note that, for most transitional and “kink” disks, the slope changes sign between 8 and 24 m, due to the turn-up in the SED. We find that objects with the most settled inner disks (including TD) have low silicate peaks, which are typical of large grain sizes. A Spearman rank correlation test confirms a strong correlation between the peak height and the SED slope at any wavelength (see Table 13), with probabilities that the two quantities are uncorrelated varying between 610-5 and 0.04. The correlation is stronger for slopes including short and long wavelengths, which trace the disk structure over several AU. This points out that strong grain growth in the innermost disk is probably the main cause of the SED geometry of transitional and “kink” disks, and it also suggests that grain growth strongly affects the disk structure (for instance, due to increased settling). In addition, the accreting TD tend to have have comparatively weaker silicate peaks than the non-accreting ones. If their reduced IR excess is caused by grain growth in the innermost disk it could explain why those objects are still accreting, as grain growth does not need to affect the gas content (see disk model #9 and Figure 28). The presence of large (1 m) and processed grains (with normal crystalline fractions) in all the TD, including those with SEDs consistent with inner holes, offers a strong contrast to the findings of Watson et al. (2009) in Taurus, where the silicate features of TD with inner holes are nearly pristine. This is again a confirmation that the TD that are found in clusters of different ages do not necessarily correspond to the same type of physical objects (Sicilia-Aguilar et al. 2010). If the presence of pristine grains in the Taurus TD is due to dust replenishment from the outer disk, it could also indicate changes in the transport mechanisms or in the global dust processing. Differences in the structure of TD with various ages is also to be expected taking into account the different timescales of the various disk clearing mechanisms (planet formation, grain growth, photoevaporation; Alexander & Armitage 2009).
We have also explored the potential correlation between crystallinity and disk structure, finding no significant results (Table 13). There is a marginal correlation (p=0.04-0.09 in the Spearman rank test) between the forsterite to enstatite ratio and the innermost disk structure (Figure 27). This is consistent with Bouwman et al. (2008), who suggested that young disks (which have typically large near-IR excesses) would tend to form only forsterite in their inner disks due to their non-equilibrium conditions. The slopes at longer wavelengths do not show any correlation with the forsterite to enstatite ratio, so the effect seems to be exclusive of the innermost disk, although the poor S/N of most spectra at long wavelengths does not let us test this hypothesis. Nevertheless, the forsterite to enstatite ratio is never too large in Cep OB2, so the trend should be tested on a larger sample. We do not find the weak trend of Watson et al. (2009) that there are more crystals at shorter wavelengths (innermost disk regions): For the 6 objects that have enough S/N at longer wavelengths, we find a similar crystallinity fraction, with small variations, although our sample is too small for statistically robust results. In addition, detecting crystalline grains at longer wavelengths is easier than tracing the amorphous ones, so our long-wavelength crystallinity fraction may be overestimated.
4.3 Disk dispersal and survival and the nature of transition disks in Cep OB2
From the analysis of the previous sections, in particular, the comparisons with the model SEDs obtained with RADMC (Section 3.3) and the trends observed with mineralogy (Sections 4.1 and 4.2), we can draw general results about disk evolution in intermediate-aged clusters. Although we do not have millimeter observations (or detections) for all disks, our models revealed that an important deal of information about disk mass (low or high) as well as dust distribution (presence of small or large grains) in the planet-formation area can be already inferred from the 20-30m region in the IRS spectra, as it had been previously found by Currie & Sicilia-Aguilar (2011). Of course, a better constrain on grain growth and grain distributions will be only provided by deeper millimeter/submillimeter observations, or by far-IR data from Herschel.
We observe important evidence of dust and disk structure evolution. On one hand, the low millimeter fluxes and the presence of objects with low mid-IR excesses suggest that dust evolution and grain growth up to millimeter sizes (and probably larger) is generalized throughout the disk. Not only some disks require relatively large grains in the innermost part, but a substantial portion of the dust mass must be forming large grains, as expected from global dust evolution (Currie et al. 2009). The inferred disk masses are sometimes very small, assuming a normal gas to dust ratio (100), even in cases where we still detect strong accretion (e.g. 11-2146, 13-236, 13-669, 82-272, 12-1091, among others). We thus expect these disks to have far more gas than what their dust emission suggests, which would also explain the lack of correlation between the accretion rate and the dust mass derived from millimeter observations already mentioned in Section 2.2. This could indicate an anomalous gas to dust ratio, together with a probable large maximum grain size. In case of very dust depleted disks like 13-236, the very low dust masses required to fit the SEDs could even suggest the formation of planets or planetesimals within the disk. We also find that even the most pristine-like disks in Cep OB2 require some settling in order to properly fit their SEDs (in fact, GM Cep is the only one that does not require settling but rather extra flaring). Such a generalized dust settling has also been observed even in younger regions, like Chamaeleon I (Manoj et al. 2011).
In addition to this global grain growth and settling, we also observe significant evidence of inside-out dust evolution. More than half of the disks in Tr 37 show strong variations in the SED slope between the innermost part (6-10m) and the rest, consistent with inside-out evolution (SA06). In some cases, the near-IR excess is low enough to empirically classify the object as transitional ([3.6]-[4.5]0.2). Our modeling of selected objects proves that non-standard disk structures can reproduce the SEDs of “kink” and transitional disks. Objects with a strong change of slope (“kink” SED) invariably require different grain populations in the innermost and outer disk, as long as the vertical scale height is assumed to run smoothly as a single power-law throughout the disk. Surprisingly, a few of these disks do not require the grains in the innermost disk to be larger: a non-collisional distribution populated by submicron grains alone in a settled innermost disk can reproduce the near-IR excess and silicate feature quite well. Nevertheless, the large “kinks” typically require the inclusion of some several-micron grains. We can interpret this result if small and large grains are not well mixed, as could result if large grains are settled, leaving a disk atmosphere populated mostly by small dust. Other authors have also proposed adding a small dust population within a disk gap for such objects with very strong silicate features (Espaillat et al. 2010). Including such a small dust population could improve our fits in the cases where the general structure of the disk that reproduces the global SED shape fails to produce strong enough silicate features. Size-dependent dust settling (with most large grains being confined to the optically thick midplane of the disk) could also be invoked to increase the strength of the silicate emission (Dullemond & Dominik 2008). Conversely, inside-out grain growth and/or grain filtering at gap edges due to the presence of planets (Rice et al. 2006) could explain different grain populations between the inner and the outer disk. Grain filtering due to planet formation, resulting in small grains in the innermost disk, also has the interesting side effect of increasing the gas to dust ratio (Rice et al. 2006), which could explain the relatively large accretion rates observed in Tr 37.
Clean inner holes are required to reproduce the objects with smaller near-IR excesses and large turn-ups at longer wavelengths. Since many of these objects do not seem to be actively accreting (in contrast with the objects with near-IR excesses, all of which display indicators of ongoing accretion), the presence of a physical hole is indeed the best explanation. In fact, the strong silicate features observed in many of these non-accreting transition disks suggest that the disks still contain a large population of small grains, albeit at a distance larger than the dust destruction radius. The disks with inner holes and no accretion are of great relevance, since they could be produced by the recent formation of a (giant) planet at few AU (Lin & Papaloizou 1986, Bryden et al. 1999, Quillen et al 2004), which would disrupt the disk and prevent accretion by opening a gap. An alternative explanation for TD without accretion is photoevaporation by the central star (Alexander et al. 2006), although the number of non-accreting TD in Tr 37 seems in conflict with the timescales predicted for photoevaporation (Gorti et al. 2009). On the other hand, strong grain growth in the innermost disk is required to explain the transitional disks with weak or no silicate features. This result agrees well with the fact that all of these objects still show active accretion (see Figure 28), so the innermost disk must still contain a large amount of gas. In both cases (with and without hole), the flux mid-IR region reveals either inside-out evolution (objects with high mid-IR flux require the presence of small grains at a few AU distance) or global grain growth (in objects with very steep SEDs in the mid-IR).
Finally, we find two puzzling objects in the region. One of them is the massive disk around GM Cep (see Section 4.4 for a detailed discussion). Although the high-resolution IRS observations suggest that there could be some remnant of an envelope, the high disk mass and the strong (and variable) accretion rate are anomalous for a star in a 4 Myr-old cluster. The other one is the star 01-580 in NGC 7160, which despite being located in a cluster with median age 12 Myr, has a very strong silicate feature, strong near-IR excess, and an accretion rate of several times 10-8 M⊙/yr (Sicilia-Aguilar et al. 2005, 2010). Considering its accretion rate, the disk around 01-580 must have been more massive than the one around GM Cep and similar to that of GW Ori (Mathieu et al. 1995). Such objects pose strong constraints to the possibility of planet formation via gravitational instability (Boss 1997, 2003), and also suggest that strong and global grain growth may not always be efficient. Therefore, also these anomalous objects may provide important information to understand the physical processes involved in planet formation.
4.4 GM Cep: Jets, photoevaporation, and extended emission
Of the two objects observed with the high-resolution IRS modules, GM Cep and 21392541, only the former was detected. This object has the brightest mid-IR emission among all the TTS in Tr 37, being twice as bright as the Herbig Be star MVA-426 at 70 m (SA06). We examined the spectrum looking for gas lines and found evidence of [Ne II] 12.81m, [Ne III] 15.56m, and [Si II] 34.82m in emission about 5-7 over the continuum (see Figure 29) in the PSF-extracted spectrum. Examining the full aperture spectrum, we also find marginal evidence of PAH emission at 11.3m. We do not find evidence of molecular emission in the spectrum, but it must be noted that the strong mid-IR continuum emission of the source does not allow to exclude weak lines due to a contrast problem. We find significant differences between the PSF-extracted and full aperture spectra in all the [Ne II], [Ne III], and [Si II] lines (see Figure 29), suggestive of extended emission. In addition to the differences in the extraction, [Ne III] and [Si II] are more typical of H II and photodissociation regions (Osterbrock 1989), which also points in the direction of nebular contamination near the source. The relatively low contrast of the lines against the strong continuum emission does not allow for further interpretation in terms of dynamics. So far, no extended material (cloud nor envelope) has been detected around GM Cep at millimeter (Patel et al. 1998) nor wavelengths, but the presence of a remnant envelope or cloud material could explain the high millimeter fluxes observed for this source, as well as the difficulties in fitting its SED with a simple disk model (Sicilia-Aguilar et al. 2008a). Moreover, if a remnant envelope or cloud material are present, as it is seen around other relatively isolated objects in the cluster (e.g., around the group formed by the binary CCDM+5734 and the F9 star 21374275; SA06), it could indicate that GM Cep is younger than the main Tr 37 cluster, which would be more in agreement with its high and variable accretion rate.
[Ne II] emission requires X-ray/EUV ionization (Glassgold et al. 2007), which could be due to the normal stellar activity, to the presence of jets/winds, and/or to active photoevaporation (Pascucci et al. 2007; Lahuis et al. 2007; Hollenbach & Gorti 2009; Güdel et al. 2010; Pascucci & Sterzik 2009). GM Cep was one of the Tr 37 stars detected in X-ray with Chandra (Mercer et al. 2009), with observed luminosity LX=1.11030 erg s-1 (3.251030 erg s-1 after correcting for absorption). The IRS spectrum reveals an integrated [Ne II] luminosity L[NeII]=21030 erg s-1. Both LX and L[NeII] appear higher than the typical values found in CTTS (Güdel et al. 2010), except when sources with strong jets are considered. While no definite confirmation of an extended jet has been found for GM Cep, its optical spectra reveal the presence of a strong stellar wind (Sicilia-Aguilar et al. 2008a). The double-peaked O I emission at 8446Å is also suggestive of a bipolar wind/outflow, so the strong [Ne II] emission observed in GM Cep could be related to jet emission, as it has been detected toward T Tau (van Boekel et al. 2009). Active photoevaporation and puffed-up disks have also been suggested for increased [Ne II] emission. The high mid-IR fluxes observed in GM Cep suggest a very flared disk, but due to the strength of the [Ne II] emission (more than one order of magnitude of the value to be considered within the normal CTTS range for its LX; Güdel et al. 2010), the presence of a jet is the most plausible candidate.
5 Summary and conclusions
We present new /IRS spectra for 31 TTS and IRAM 1.3mm observations for 34 low- and intermediate-mass stars, all within the clusters Tr 37 and NGC 7160 in the Cep OB2 region. The observations were selected to cover a representative sample of SEDs and disk types observed in Tr 37, together with the only 2 low-mass disks detected in NGC 7160 (SA06). Including our previously published IRS spectra (SA07), we analyze a total of 56 IRS spectra of solar-type stars plus 3 of intermediate-mass objects with silicate features. We study the new data, together with the previously published optical, near- and mid-IR observations, in order to examine the correlations between silicate dust features and the stellar properties, accretion, and disk structure.
We analyze the silicate emission features with a TLTD method, finding that they are consistent with a mixture of amorphous silicates (with olivine and forsterite stoichiometry), amorphous silica, and crystalline forsterite and enstatite grains with sizes 0.1-6m. No other components are required in order to reproduce the observed features, and in general, the amount of crystals in the disk does not exceed 20%, with a typical value being 5-10%. The lack of S/N at long wavelengths in most objects does not allow to explore the radial dependence of the crystallinity fraction nor chemical composition.
A large number of disks present strong signs of dust evolution: settled SEDs, evidence of optically thin inner disks, presence of “kinks” or slope changes in the SEDs. We thus characterize the global disk structure by measuring the SED slope at different wavelengths, and create a series of prototype disks by means of the RADMC radiative transfer code. This allows us to determine what types of disk geometry and dust distributions reproduce the behaviors observed in our sample.
The comparison with the models reveal that even the most typical CTTS disks in Cep OB2 have already suffered strong grain growth and settling. This general requirement of strong settling has also been observed in younger regions (e.g. Chamaeleon I; Manoj et al. 2011), and thus seems to occur very early in the disk lifetime. In addition, we find that about half of the disks present signs of inside-out evolution, seen as a variable SED slope at different wavelengths (with a large negative slope at short wavelengths, changing to a near-zero or positive slope at longer ). Such a SED geometry can be reproduced by radially dependent grain populations or by changes in the disk flaring/thickness with radius.
We find that TD (especially, accreting ones) and “kink” disks appear strongly correlated to grain growth in the innermost disk and typically show flattened and small silicate features. Even the objects whose SEDS can be explained by inner holes show processed grains, in contrast with what is seen in the TD with holes in Taurus (Watson et al. 2009), which tend to have nearly pristine silicate features. This may indicate that TD are physically different objects at different ages, as has been previously suggested (Alexander & Armitage 2009; Sicilia-Aguilar et al. 2010). While TD in Taurus could be mostly related to giant planet formation (still subject to migration, due to the high mass of the disks), substantial grain growth and settling (and eventually, photoevaporation) can explain the older TD in Tr 37. It could also be a sign that, at older ages, the mechanisms replenishing the inner disk with pristine grains are not effective, or the outer disk has also suffered grain processing.
In order to reproduce the near- and mid-IR SEDs of transitional and “kink” disks, very settled disk structures and, in some cases, radially-dependent dust distributions are required, in addition to typically very low disk masses (M510-4 M∗, considering a standard gas to dust ratio of 100). This suggest that, although evolution seems to operate faster in the innermost disk, there is also substantial evolution and dust depletion at a more global scale, as it has been suggested by Currie et al. (2009) and Lommen et al. (2010). We also find that many of our SEDs require the presence of submicron-only (0.1m) grains in the inner disk. This could be caused either by differential settling, with larger grains being preferentially in the midplane, or by a radially dependent grain population. Populating the inner disk with small dust grains could be seen as inconsistent with inside-out evolution, but may be explained by dust filtering at the edges of the gaps formed by planets (Rice et al. 2006).
The differences in disk structure in our varied sample dilute the observed correlation between accretion rate (or turbulence) and the silicate feature, although a correlation is still seen in samples of normal CTTS disks (SA07; Fang et al. 2011). The relatively strong accretion rates observed in the stars in the Cep OB2 region (of the order of few times 10-9 M⊙/yr) are in contrast with the small dust masses inferred from millimeter data and radiative transfer models, which could be an indication of a larger-than-normal gas to (small) dust ratio. This also points out the importance of taking into account the gas content to determine the evolutionary status and the fate of disks, including the possibility of planet formation.
Finally, the IRS high-resolution spectrum obtained for the variable star GM Cep reveals that it is probably extended and thus surrounded by cloud material or a remnant envelope, which could be responsible for its strong and variable accretion rate. Its IR [Ne II] emission is also consistent with the presence of jets, which is in agreement with the strong wind signatures observed in its optical spectrum.
We would like to thank R. Zylka for his help with the IRAM observations and data reduction, in particular, his MOPSIC scripts. We are also indebted to F. Lahuis for his help with the reduction of high-resolution IRS spectra, and the Spitzer Science Center Helpdesk for their help with the MOPEX software. We also thank A. Martínez-Sansigre and V. Roccatagliata for their participation in the IRAM observations, and the referee for the careful report that helped to clarify our paper. A.S.-A. acknowledges support from the Deutsche Forschungsgemeinschaft (DFG) grant SI-1486/1-1. This work is based on observations made with the Spitzer Space Telescope, which is operated by the Jet Propulsion Laboratory, California Institute of Technology under a contract with NASA. It also makes use of data products from the Two Micron All Sky Survey, which is a joint project of the University of Massachusetts and the Infrared Processing and Analysis Center/California Institute of Technology, funded by the National Aeronautics and Space Administration and the National Science Foundation.
References
- Ábrahám et al. (2009) Ábrahám, P., Juhász, A., Dullemond, C.P., Kóspal, A.,van Boekel, R., Henning, Th., Moór, A., Mosoni, L., Sicilia-Aguilar, A., Sipos, N., 2009, Nature 459, 224
- Alexander et al. (2006) Alexander, R., Clarke, C., Pringle, J, 2006 MNRAS, 369, 229
- Alexander & Armitage (2009) Alexander, R. D., & Armitage, P. J. 2009, ApJ, 704, 989
- Andrews & Williams (2007) Andrews, S.,& Williams, J., 2007, ApJ, 671, 1800
- Beckwith et al. (1990) Beckwith, S., Sargent, A., Chini, R., Güsten, R., 1990, AJ, 99, 924
- Bjorkman & Wood (2001) Bjorkman, J. E., & Wood, K. 2001, ApJ, 554, 615
- Boss (1997) Boss, A. P. 1997, Science, 276, 1836
- Boss (2003) Boss, A. P. 2003, ApJ599, 577
- Bouwman et al. (2000) Bouwman, J., de Koter, A., van den Ancker, M., Waters, L., 2000, A&A, 360, 213
- Bouwman et al. (2001) Bouwman, J., Meeus, G., de Koter, A., Hony, S., Dominik, C., Waters, L., 2001, AA, 375, 950
- Bouwman et al. (2006) Bouwman, J.; Lawson, W. A.; Dominik, C.; Feigelson, E. D.; Henning, Th.; Tielens, A. G. G. M.; Waters, L. B. F. M., 2006, ApJ, 653, 57
- Bouwman et al. (2008) Bouwman, J., et al. 2008, ApJ, 683, 479
- Bouwman et al. (2010) Bouwman, J., et al. 2010, ApJ723, L243
- Brauer et al. (2008) Brauer, F., Dullemond, C. P., & Henning, T. 2008, A&A, 480, 859
- Bryden et al. (2000) Bryden, G, Rozyczka, M., Lin, D., Bodenheimer, P., 2000, 540, 1091
- Calvet et al. (1992) Calvet, N., et al. 1992, RMxAA 24, 27
- Cardelli et al. (1989) Cardelli, J., Clayton, G., Mathis, J., 1989, ApJ, 345, 245
- Charbonneau et al. (1995) Charbonneau, P, 1995, ApJ, 101, 309
- Chiang & Goldreich (1997) Chiang, E., Goldreich, P. 1997, ApJ, 490, 368
- Clarke et al. (2001) Clarke, C., Gendrin, A., & Sotomayor, M., 2001, MNRAS 328, 485
- Contreras et al. (2002) Contreras, M.E., Sicilia-Aguilar, A., Muzerolle, J., Calvet, N., Berlind, P., Hartmann, L. 2002, AJ, 124, 1585
- Currie et al. (2009) Currie, T., Lada, C., Plavchan, P., Robitaille, Th., Irwin, J., Kenyon, S., 2009, ApJ698, 1
- De Graeve (1983) De Graeve, E., 1983, Vatican Obs. Publ., 2, 31
- Dorschner et al. (1995) Dorschner, J, Begemann, B., Henning, T., Jäger, C., & Mutschke, H., 1995, A&A, 300, 503
- Dullemond et al. (2001) Dullemond, C., Dominik, C., Natta, A., 2001, ApJ 560, 957
- Dullemond & Dominik (2004) Dullemond, C., & Dominik, C. 2004, AA 417, 159
- Dullemond & Dominik (2005) Dullemond, C., & Dominik, C., 2005, AA, 434, 975
- Dullemond et al. (2006) Dullemond, C. P., Apai, D., & Walch, S. 2006, ApJ, 640, L67
- Dullemond & Dominik (2008) Dullemond, C., & Dominik, C., 2008, A&A, 487, 205
- Ercolano et al. (2009) Ercolano, B., Clarke,C. J., & Robitaille, T. P. 2009, MNRAS, 394, L141
- Espaillat et al. (2010) Espaillat, C., et al. 2010, ApJ, 717, 441
- Fang et al. (2009) Fang, M., van Boekel, R., Wang, W., Carmona, A., Sicilia-Aguilar, A., & Henning, T. 2009, A&A, 504, 461
- Furlan et al. (2005) Furlan, E., et al., 2005, ApJ, 621, L129
- Furlan et al. (2006) Furlan, E., et al. 2006, ApJS 165, 568
- Furlan et al. (2011) Furlan, E., et al. 2011, ApJS 195, 3
- Glassgold et al. (2007) Glassgold, A. E., Najita, J. R., & Igea, J. 2007, ApJ, 656, 515
- Glauser et al. (2009) Glauser, A. M., Güdel, M., Watson, D. M., Henning, T., Schegerer, A. A., Wolf, S., Audard, M., & Baldovin-Saavedra, C. 2009, A&A, 508, 247
- Gorti & Hollenbach (2004) Gorti, U., & Hollenbach, D. 2004, ApJ, 613, 424
- Gorti et al. (2009) Gorti, U., Dullemond, C. P., & Hollenbach, D. 2009, ApJ, 705, 1237
- Güdel et al. (2010) Güdel, M., et al. 2010, A&A, 519, A113
- Gustafsson et al. (2008) Gustafsson B., Edvardsson B., Eriksson K., Jörgensen U.G., Nordlund A., Plez B. 2008, A&A 486, 951
- Haisch et al. (2001) Haisch, K., Lada, E., & Lada, C., 2001, ApJ, 553, 153
- Hartmann et al. (2005) Hartmann, L., Megeath, S.T., Allen, L., Luhman, K., Calvet, N., D’Alessio, P., Franco-Hernández, R., Fazio, G., 2005, ApJ, 629, 881
- Hartmann et al. (2006) Hartmann, L., D’Alessio, P., Calvet, N., & Muzerolle, J., 2006, ApJ, 648, 484
- Hayashi et al. (1985) Hayashi, C., Nakazawa, K., & Nakagawa, Y. 1985, in Protostars and Planets II, eds. D. Black & M. Matthews, (Tucson: University of Arizona Press), 1100
- Henning & Stognienko (1996) Henning, Th.& Stognienko, R., 1996, A&A, 311, 291
- Henning & Mutschke (1997) Henning, Th.& Mutschke, H., 1997, A&A, 327, 743
- Hernández et al. (2007) Hernández, J., Hartmann, L., Megeath, S.T.,et al., 2007, ApJ, 662, 1067
- Higdon et al. (2004) Higdon, S., et al., 2004, PASP, 116, 975
- Hollenbach & Gorti (2004) Hollenbach, D., & Gorti, U. 2004, Revista Mexicana de Astronomia y Astrofisica Conference Series, 22, 33
- Hollenbach & Gorti (2009) Hollenbach, D., & Gorti, U. 2009, ApJ, 703, 1203
- Honda et al. (2003) Honda, M., Kataza, H., Okamoto, Y., Miyata, T., Yamashita, T., Sako, S., Takubo, S., Onaka, T., 2003, ApJ, 585, 59
- Ireland & Kraus (2008) Ireland, M., Kraus, A., 2008, ApJ, 678, 59
- Jäger et al. (1998) Jäger, C., Molster, F., Dorschner, J., et al., 1998, A&A 339, 904
- Juhász et al. (2009) Juhász, A., Henning, T., Bouwman, J., Dullemond, C. P., Pascucci, I., & Apai, D. 2009, ApJ, 695, 1024
- Kessler-Silacci et al. (2005) Kessler-Silacci, J., Hillenbrand, L., Blake, G., Meyer, M., 2005, ApJ, 622, 404
- Lahuis & Boogert (2003) Lahuis, F., Boogert, A., 2003cdsf.conf..335L
- Lahuis et al. (2006) Lahuis, F., et al. 2006, c2d Spectroscopy Explanatory Supplement (Pasadena: Science Center).
- Lahuis et al. (2007) Lahuis, F., van Dishoeck, E. F., Blake, G. A., Evans, N. J., II, Kessler-Silacci, J. E., & Pontoppidan, K. M. 2007, ApJ, 665, 492
- Lin and Papaloizou (1986) Lin, D.N.C., & Papaloizou, J., 1986, ApJ, 309, 846
- Lommen et al. (2010) Lommen, D. J. P., et al. 2010, A&A, 515, A77
- Manoj et al. (2011) Manoj, P., et al. 2011, ApJS, 193, 11
- Marschall & van Altena (1987) Marschall, L.A. & van Altena, W.F., 1987, AJ, 94,71
- Mathieu et al. (1995) Mathieu, R., Adams, F., Fuller, G., Jensen, E., Koerner, D., Sargent, A., 1995, AJ, 109, 2655
- Megeath et al. (2005) Megeath, S. T.; Hartmann, L.; Luhman, K. L.; Fazio, G. G., 2005, ApJ, 634, 113
- Mercer et al. (2009) Mercer, E. P., Miller, J. M., Calvet, N., Hartmann, L., Hernandez, J., Sicilia-Aguilar, A., & Gutermuth, R. 2009, AJ, 138, 7
- Meeus et al. (2001) Meeus, G., Waters, L.B.F.M., Bouwman, J., van den Ancker, M.E., Waelkens, C., Malfait, K., 2001, A&A 365, 476
- Meeus et al. (2003) Meeus, G., Sterzik, M., Bouwman, J., Natta, A., 2003, AA, 409, L25
- Min et al. (2005) Min, M.; Hovenier, J. W.; de Koter, A., 2005, A&A 432, 909
- Muzerolle et al. (2010) Muzerolle, J., Allen, L. E., Megeath, S. T., Hernández, J., & Gutermuth, R. A. 2010, ApJ, 708, 1107
- Natta et al. (2000) Natta, A., Grinin, V., Tambovtseva, L., 2000, ApJ, 542, 421
- Natta et al. (2007) Natta, A., Testi, L., Calvet, N., et al., 2007, Protostars and Planets V, B. Reipurth, D. Jewitt, and K. Keil (eds.), Tucson: University of Arizona Press, 767
- Osterbrock (1989) Osterbrock, D. E., “Astrophysics of gaseous nebulae and active galactic nuclei”, University Science Books, 1989
- Patel et al. (1995) Patel, N.A. , Goldsmith, P.F., Snell, R.L., Hezel, T. & Xie, T., 1995, ApJ , 447, 721
- Patel et al. (1998) Patel, N.A., Goldsmith, P.F., Heyer, M.H. & Snell, R.L., 1998, ApJ , 507, 241
- Pascucci et al. (2004) Pascucci et al. 2004, A&A, 417, 793
- Pascucci et al. (2007) Pascucci, I., et al. 2007, ApJ, 663, 383
- Pascucci et al. (2009) Pascucci, I., Apai, D., Luhman, K., Henning, Th., Bouwman, J., Lahuis, F., Natta, A., 2009, ApJ696, 143
- Pascucci & Sterzik (2009) Pascucci, I., & Sterzik, M. 2009, ApJ, 702, 724
- Pavlyuchenkov & Dullemond (2007) Pavlyuchenkov, Y., & Dullemond, C. P. 2007, A&A, 471, 833
- Pinte et al. (2009) Pinte et al. 2009, A&A, 498, 967
- Platais et al. (1998) Platais, I, Kozhurina-Platais, V., van Leeuwen, F., 1998, AJ, 116, 2423
- Pott et al. (2010) Pott, J.-U., Perrin, M. D., Furlan, E., Ghez, A. M., Herbst, T. M., & Metchev, S. 2010, ApJ, 710, 265
- Preibisch et al. (1993) Preibisch, T., Ossenkopf, V., Yorke, H., & Henning, T., 1993, A&A, 279, 577
- Rice et al. (2006) Rice, W., Armitage, P., Wood, K., Lodato, G., 2006, MNRAS 373, 1619
- Rodmann et al. (2006) Rodmann, J.; Henning, Th.; Chandler, C. J.; Mundy, L. G.; Wilner, D. J., 2006, A&A, 446, 211
- Schräpler & Henning (2004) Schräpler, R. & Henning, Th., 2004, ApJ, 614, 960
- Servoin & Piriou (1973) Servoin, J., & Piriou, B., 1973, Phys. Stat. Sol., 55, 677
- Sicilia-Aguilar et al. (2004) Sicilia-Aguilar, A., Hartmann, L., Briceño, C., Muzerolle, J.,Calvet, N., 2004, AJ128, 805
- Sicilia-Aguilar et al. (2005) Sicilia-Aguilar, A., Hartmann, L., Hernández, J., Briceño, C., Calvet, N., 2005b, AJ130, 188
- Sicilia-Aguilar et al. (2006a) Sicilia-Aguilar, A., Hartmann, L., Calvet, N., Megeath,S.T., Muzerolle, J., Allen, L., D’Alessio, P., Merín, B., Stauffer, J., Young, E., Lada, C., 2006a, ApJ 638, 897 (SA06A)
- Sicilia-Aguilar et al. (2006b) Sicilia-Aguilar, A., Hartmann, L., Fürész, G., Henning, Th., Dullemond, C., Brandner, W., 2006b, AJ 132, 2135
- Sicilia-Aguilar et al. (2007) Sicilia-Aguilar, A., Hartmann, L., Watson, D., Bohac, C., Henning, Th., et al., 2007, ApJ 659, 1637 (SA07)
- Sicilia-Aguilar et al. (2008) Sicilia-Aguilar, A.; Henning, Th.; Juhász, A.; Bouwman, J.; Garmire, G.; Garmire, A., 2008, ApJ, 687, 1145
- Sicilia-Aguilar et al. (2008a) Sicilia-Aguilar, A., et al., 2008a, ApJ 673, 382
- Sicilia-Aguilar et al. (2008b) Sicilia-Aguilar, A.; Henning, Th.; Juhász, A.; Bouwman, J.; Garmire, G.; Garmire, A., 2008b, ApJ, 687, 1145
- Sicilia-Aguilar et al. (2009) Sicilia-Aguilar, A., Bouwman, J., Juhász, A., et al., 2009, ApJ, 701, 1188
- Sicilia-Aguilar et al. (2010) Sicilia-Aguilar, A., Henning, Th., Hartmann, L., 2010, ApJ, 710, 597
- Siess et al. (2000) Siess, L., Dufour, E. & Forestini, M. 2000 A&A , 358, 593
- Skrutskie et al. (1990) Skrutskie, M., Dutkevitch, D., Strom, S., Edwards, S., & Strom, K., 1990, AJ, 99, 1187
- Sogawa et al. (2006) Sogawa, H., Koike, C., Chihara, H., Suto, H., Tachibana, S., Tsuchiyama, A., & Kozasa, T. 2006, A&A, 451, 357
- Swain et al. (2008) Swain, M., Bouwman, J., Akeson, R., Lawler, S., Beichman, C., 2008, ApJ 674, 482
- Van Boekel et al. (2003) Van Boekel, R., Waters, L., Dominik, C., Bouwman, J., de Koter, A., Dullemond, C., Paresce, F., 2003, AA, 400, L21
- Van Boekel et al. (2004) Van Boekel, R., Waters, L., Dominik, C., Dullemond, C., Tielens, A., de Koter, A., 2004, AA, 418, 177
- van Boekel et al. (2009) Van Boekel, R., Güdel, M., Henning, T., Lahuis, F., & Pantin, E. 2009, A&A, 497, 137
- Watson et al. (2009) Watson, D. M., et al. 2009, ApJS, 180, 84
- Zsom et al. (2011) Zsom, A., Ormel, C.W., Dullemond, C.P., Henning, Th., 2011, A&A in press
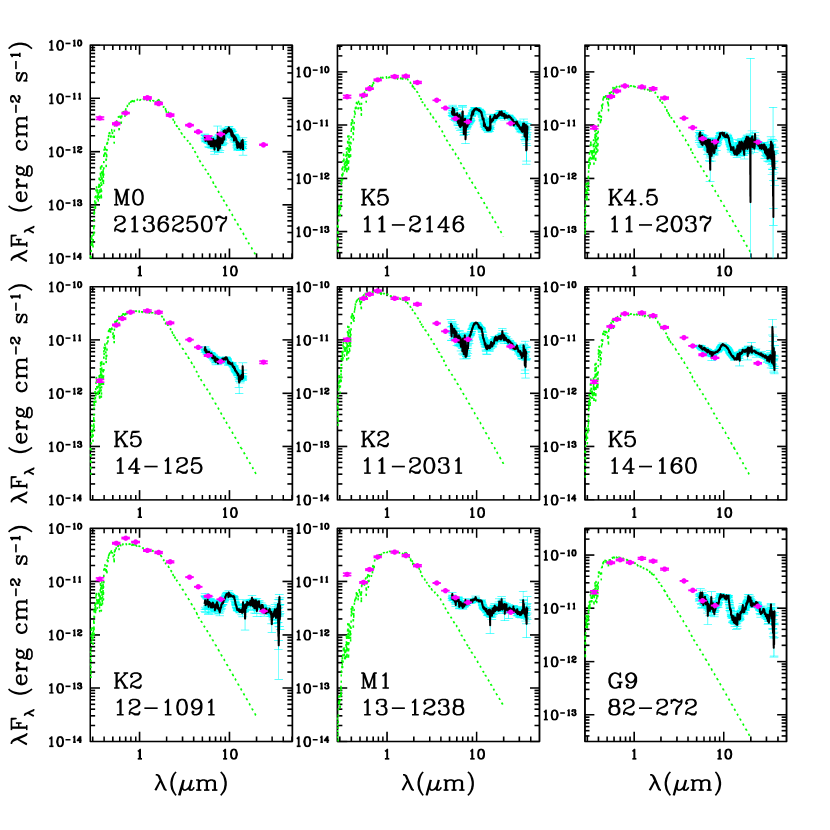
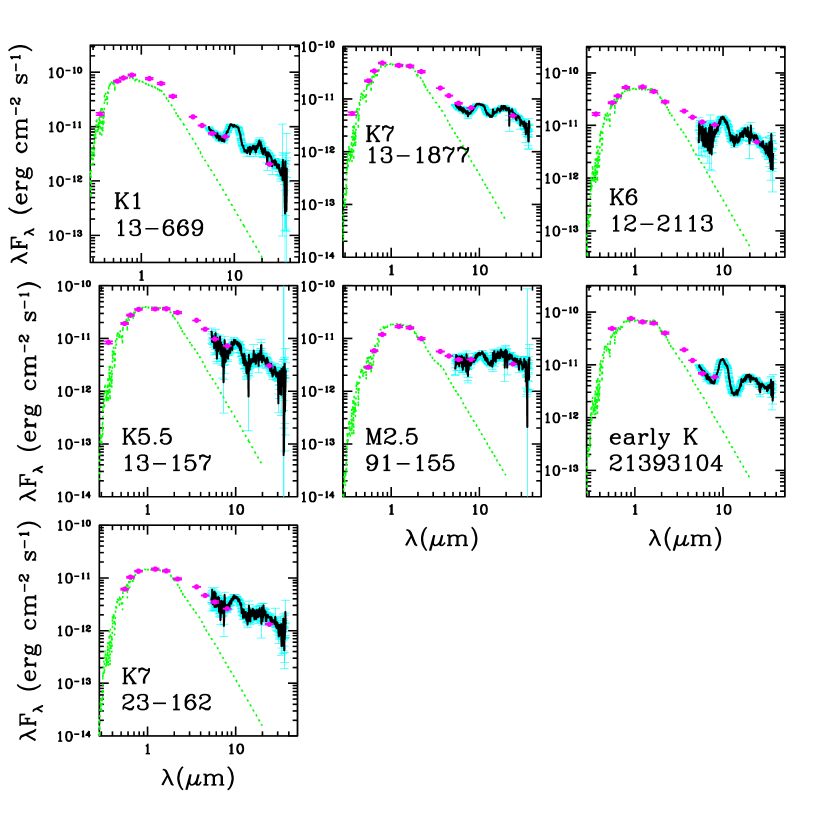
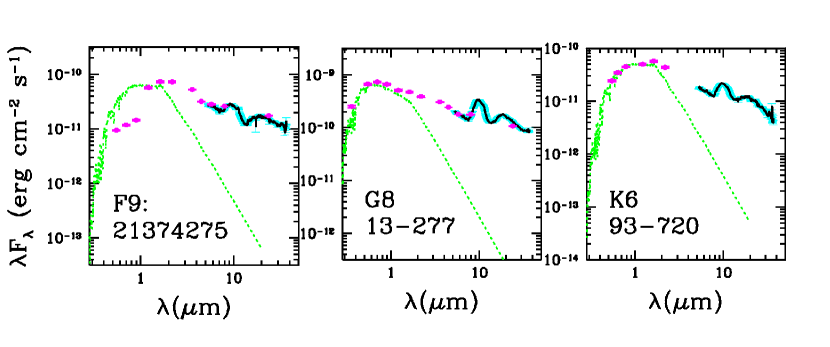
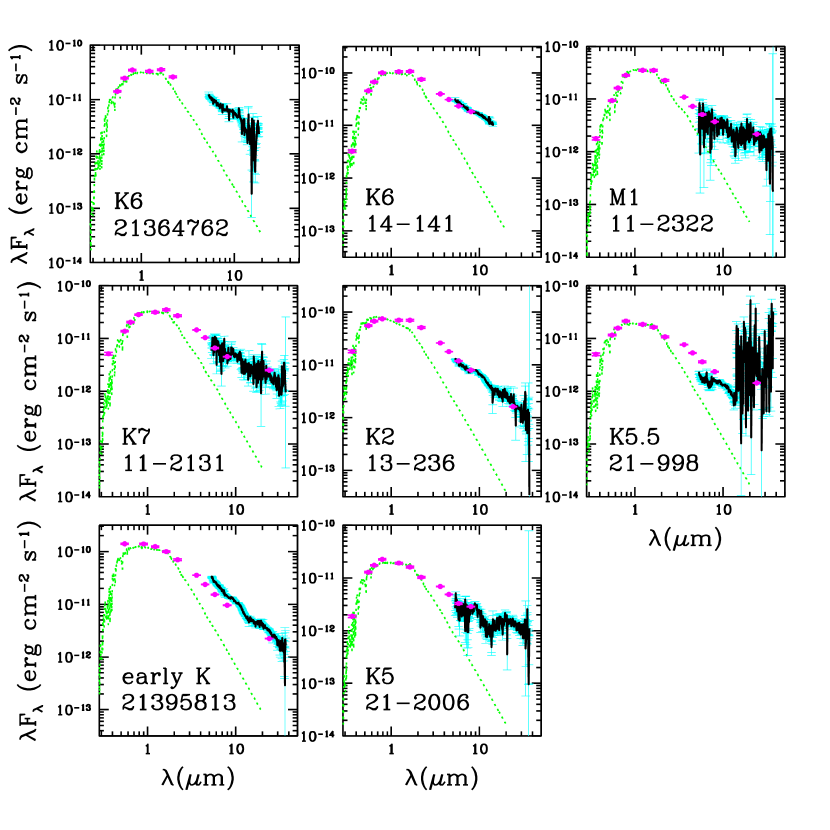
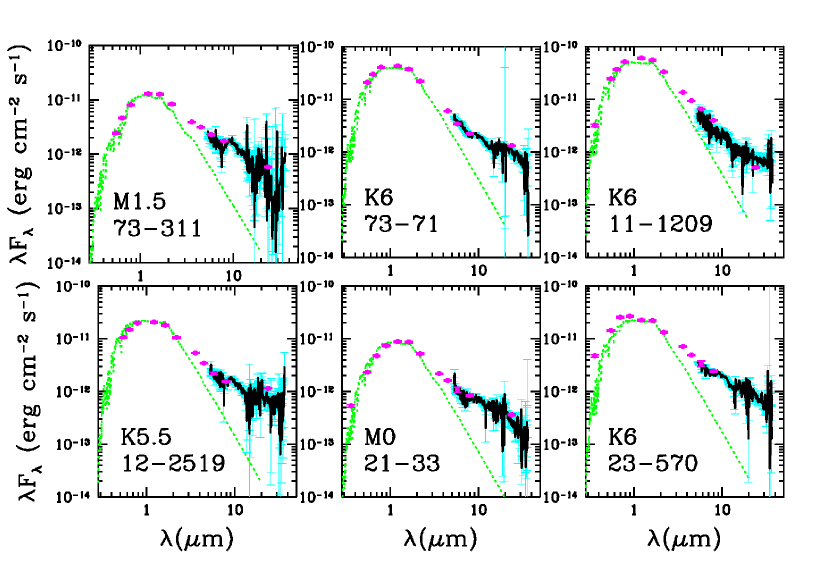
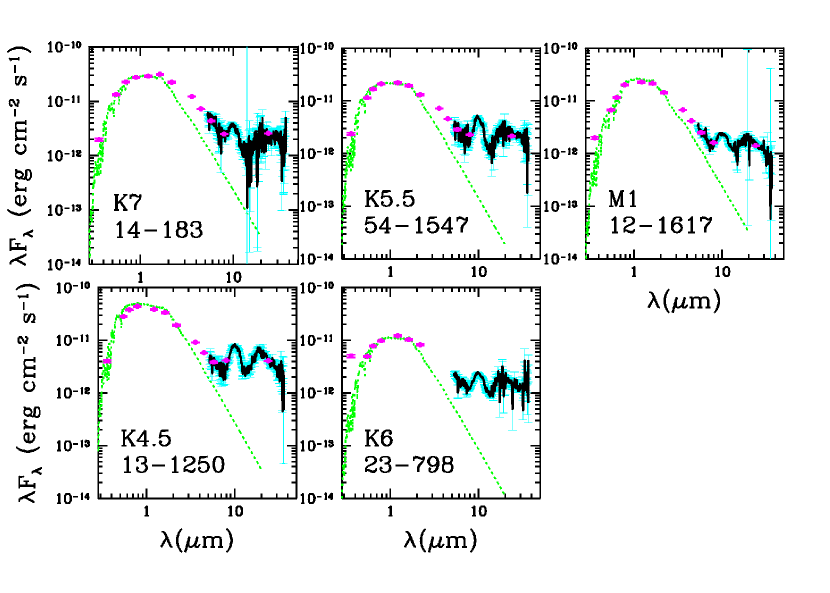
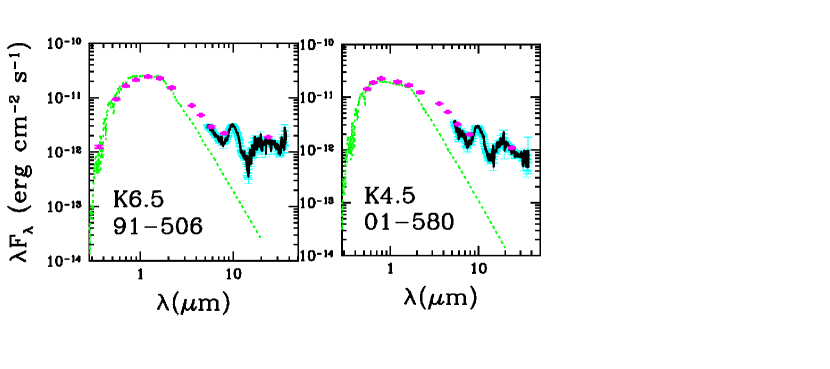
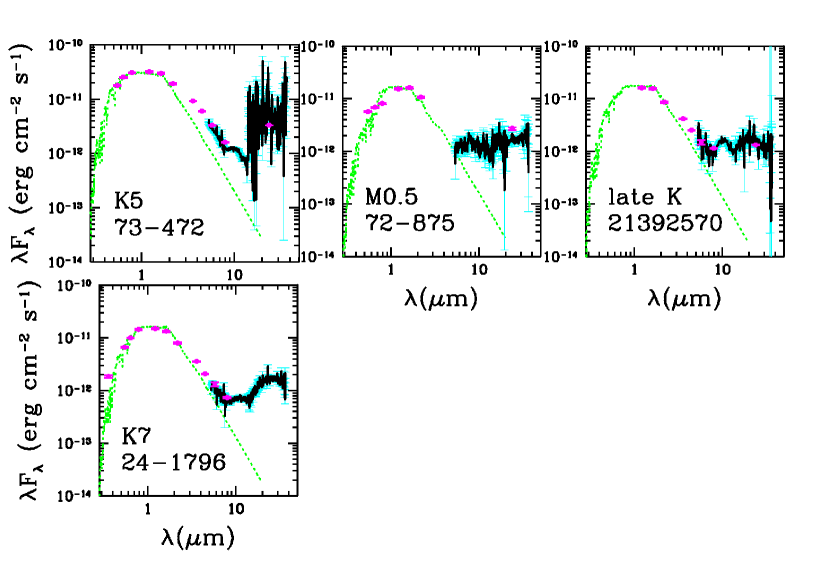
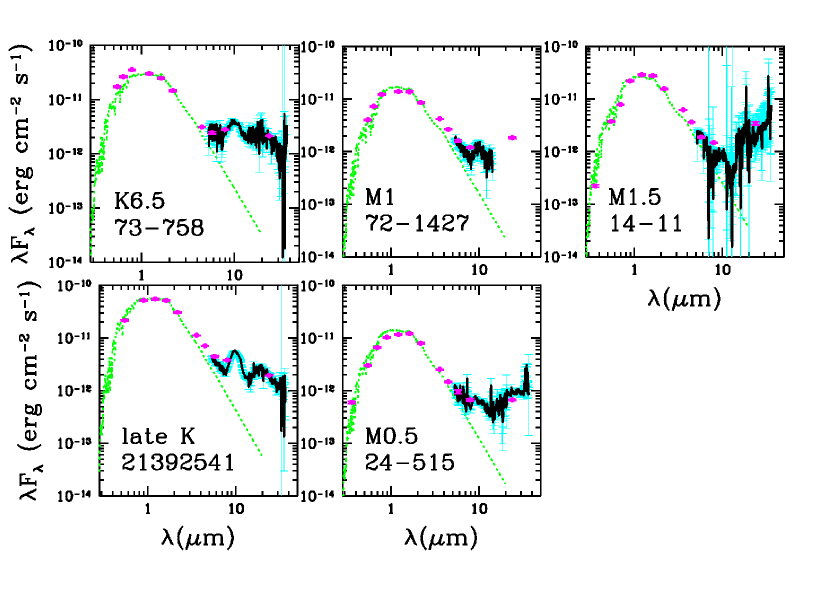
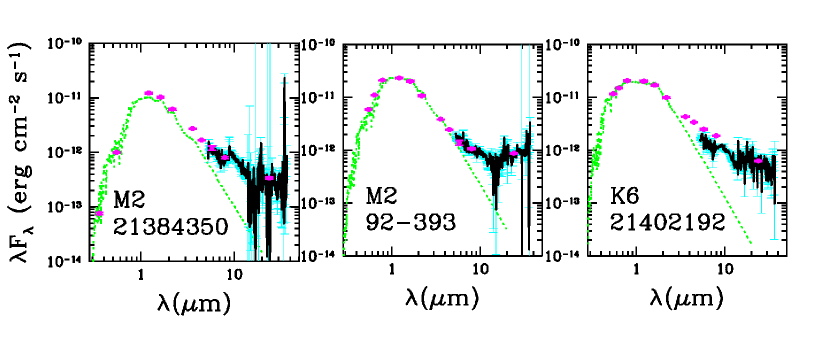
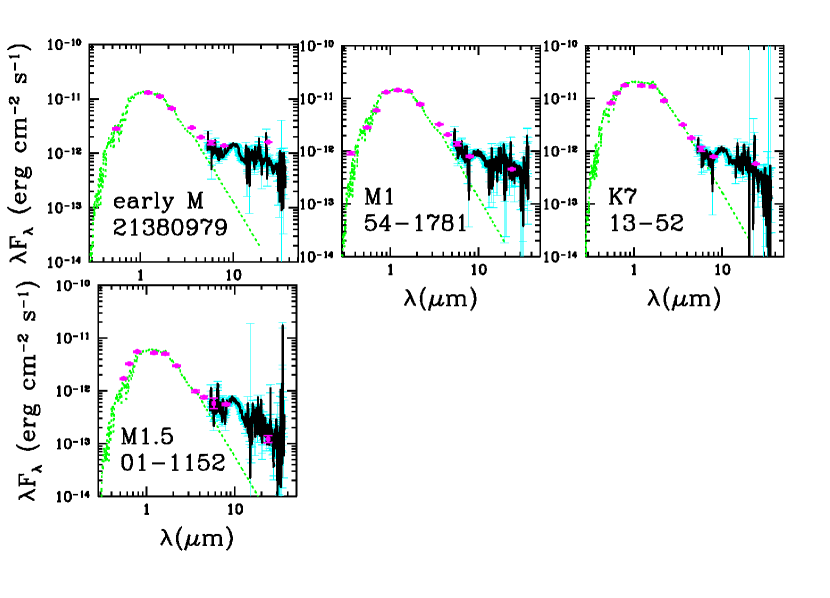
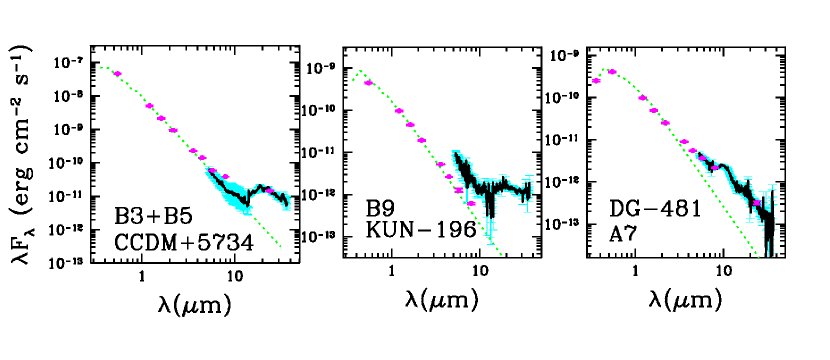
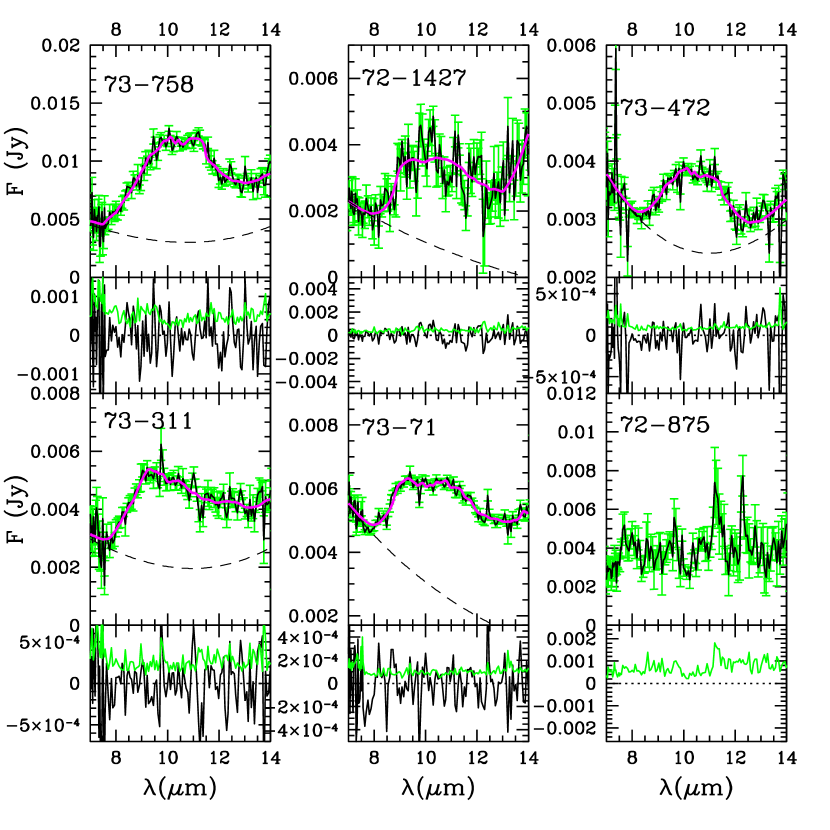
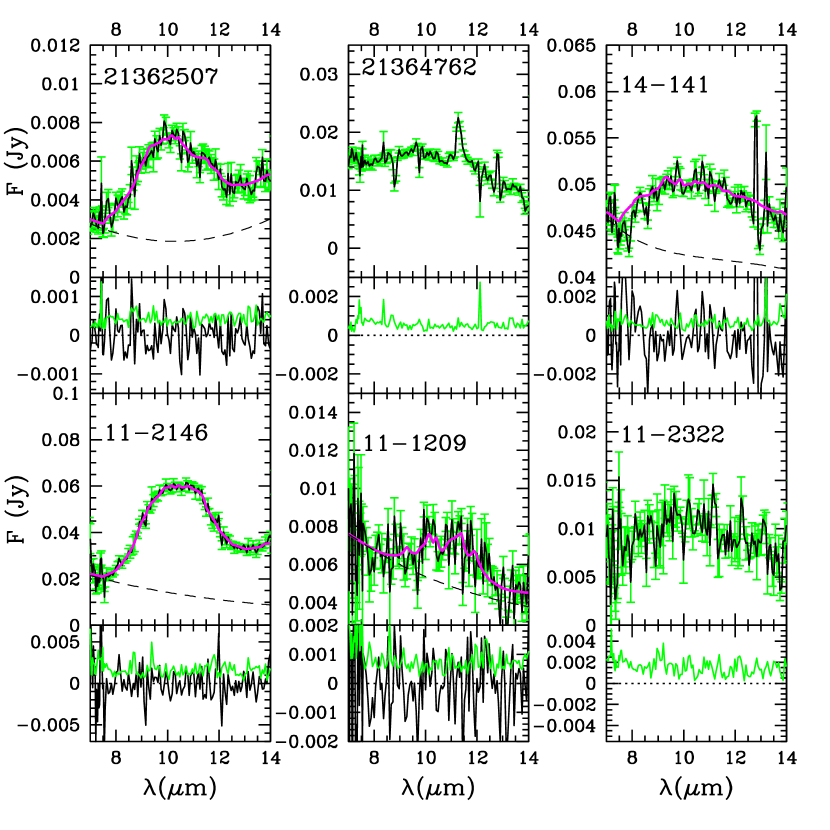
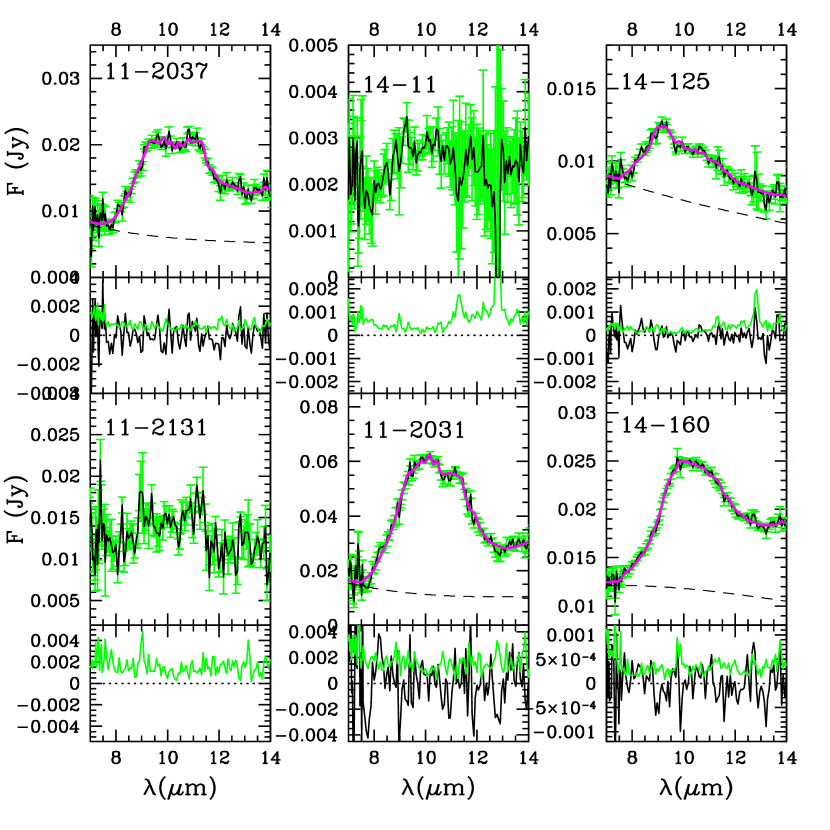
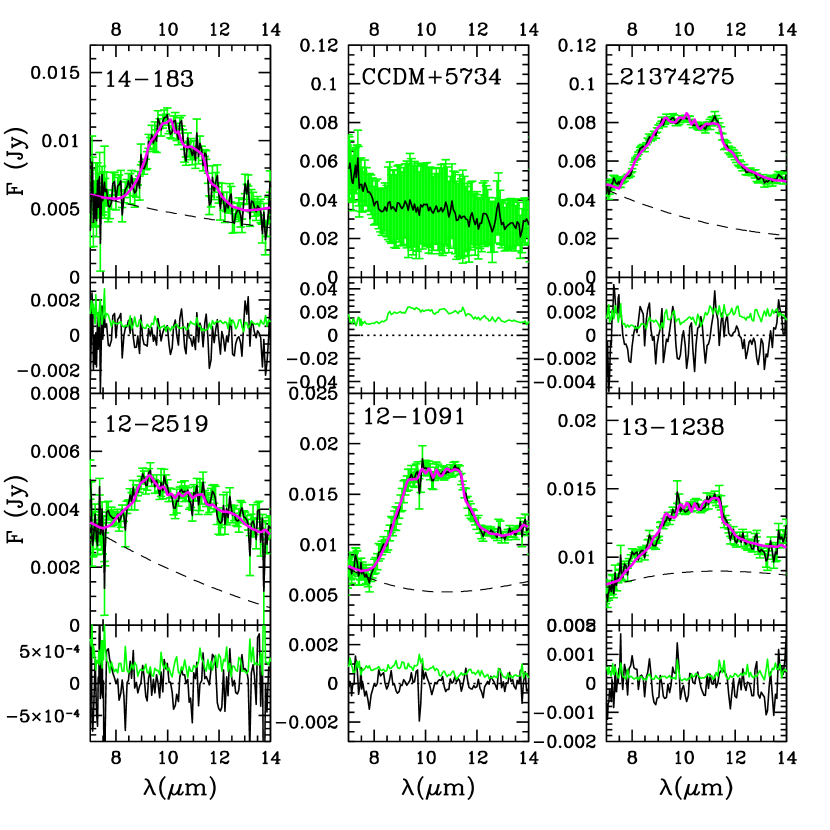
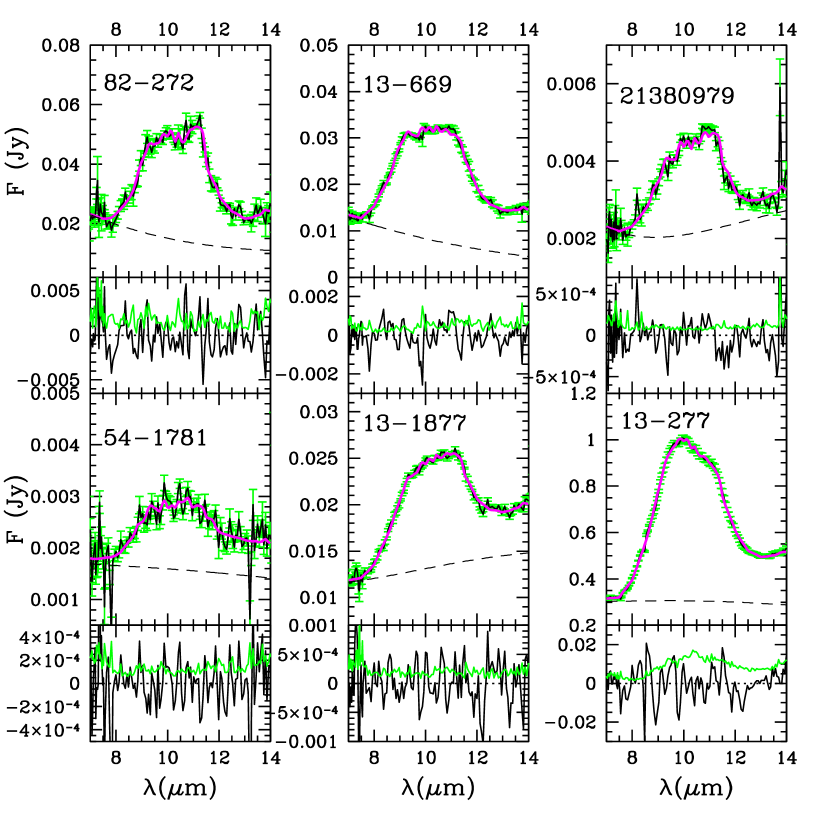
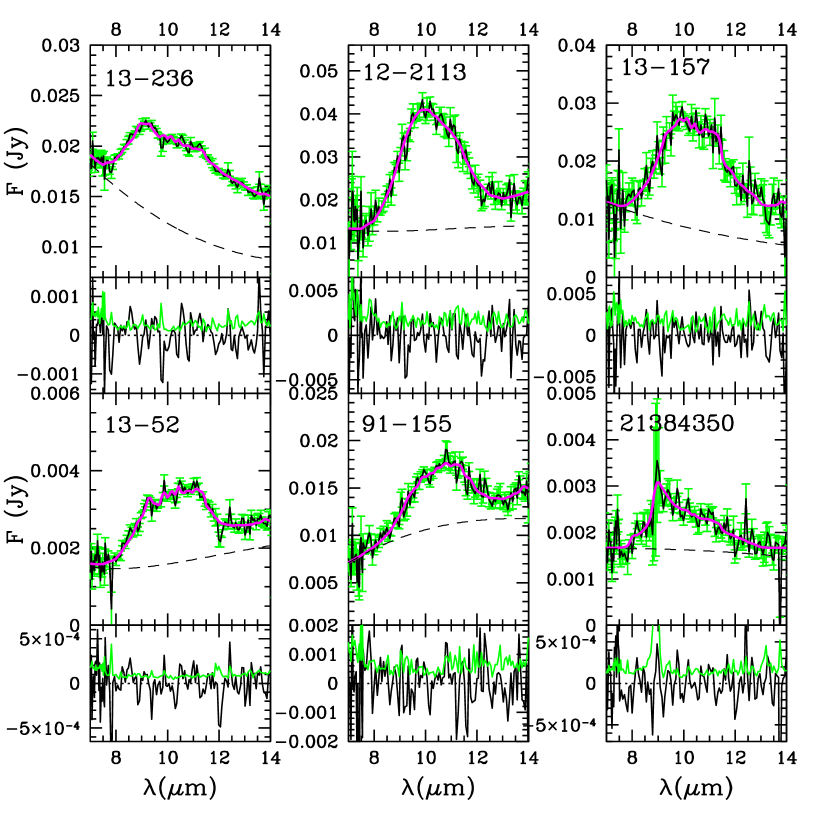
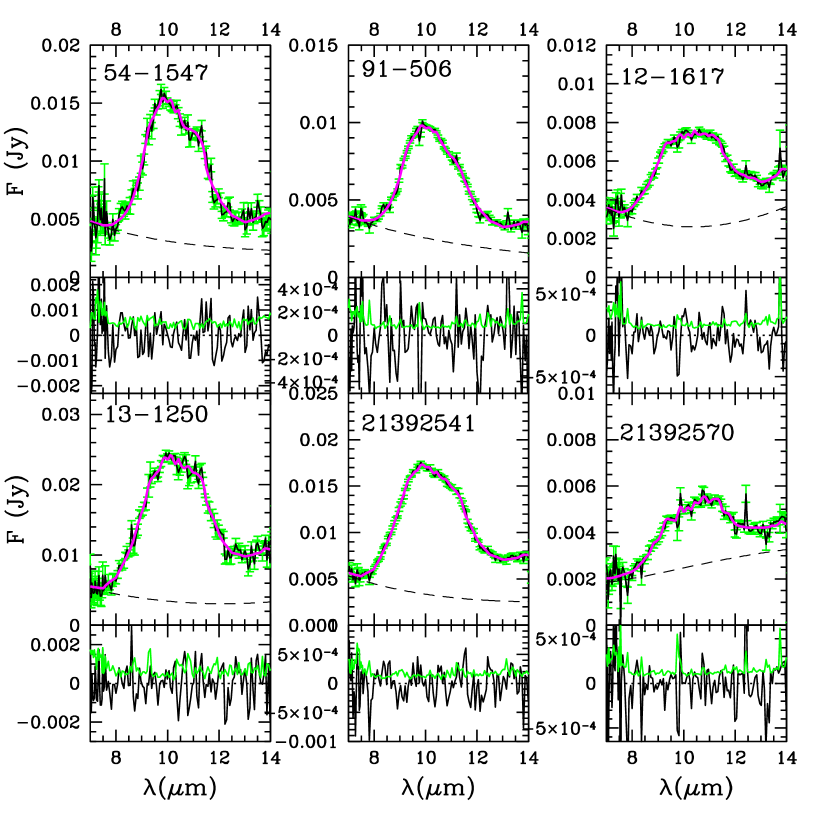
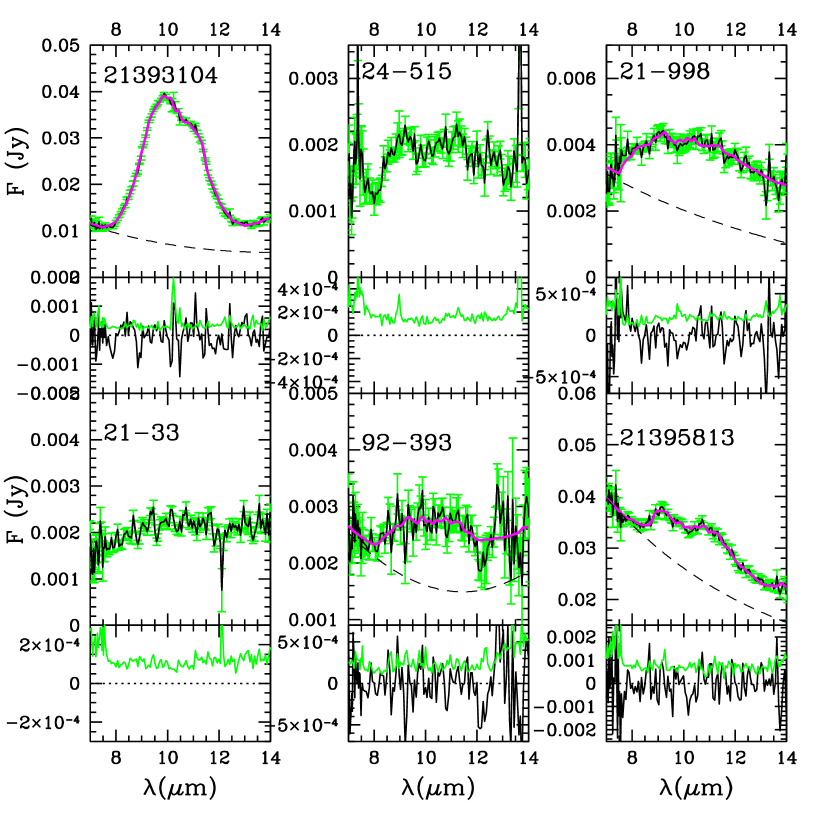
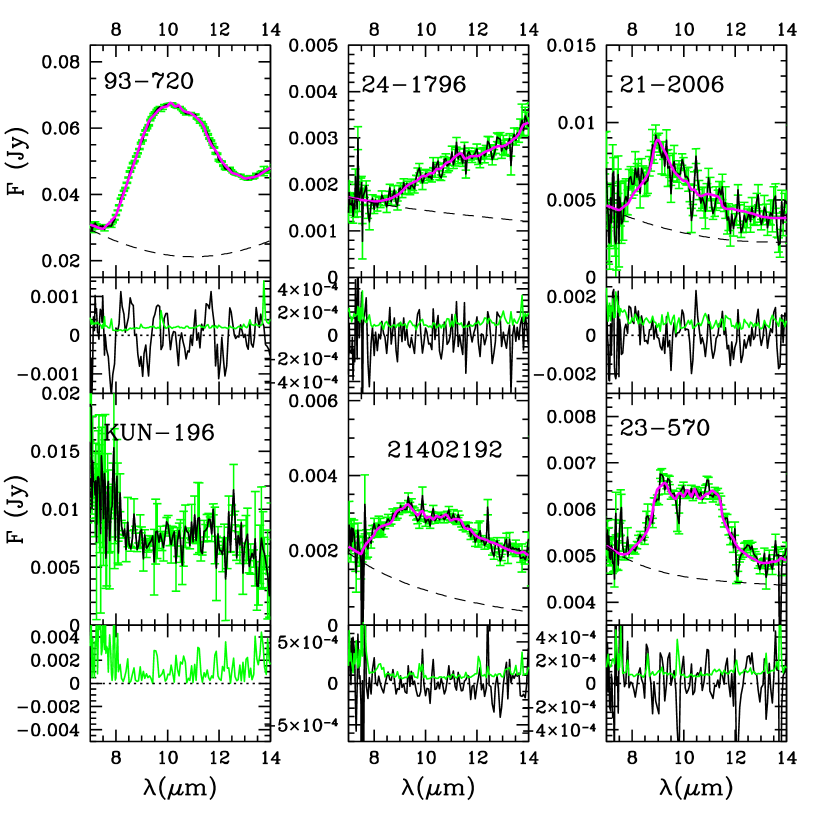
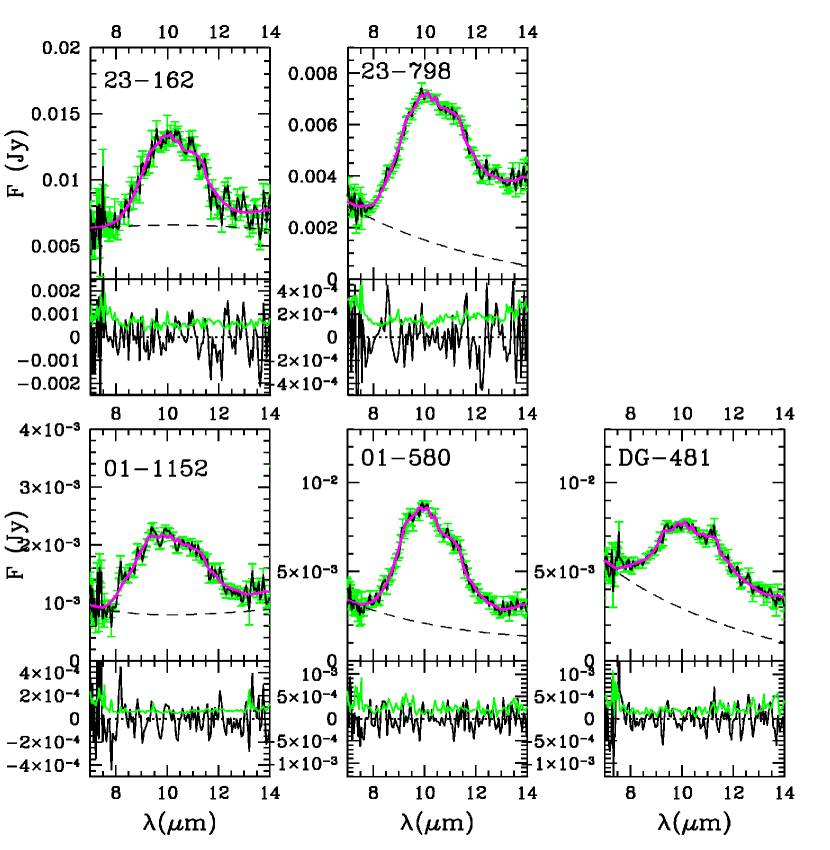
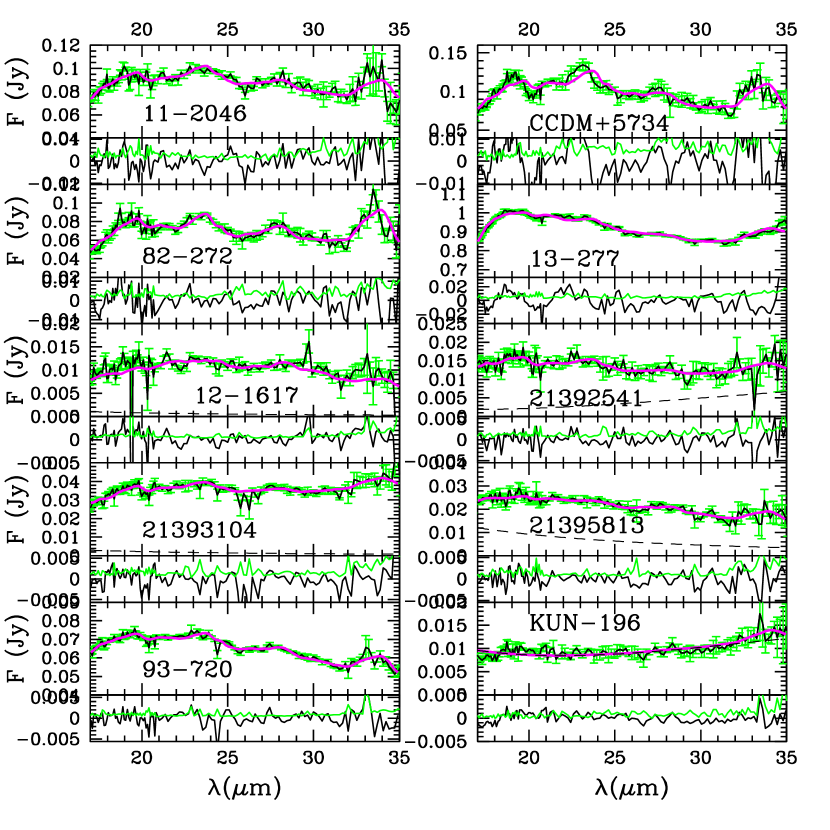
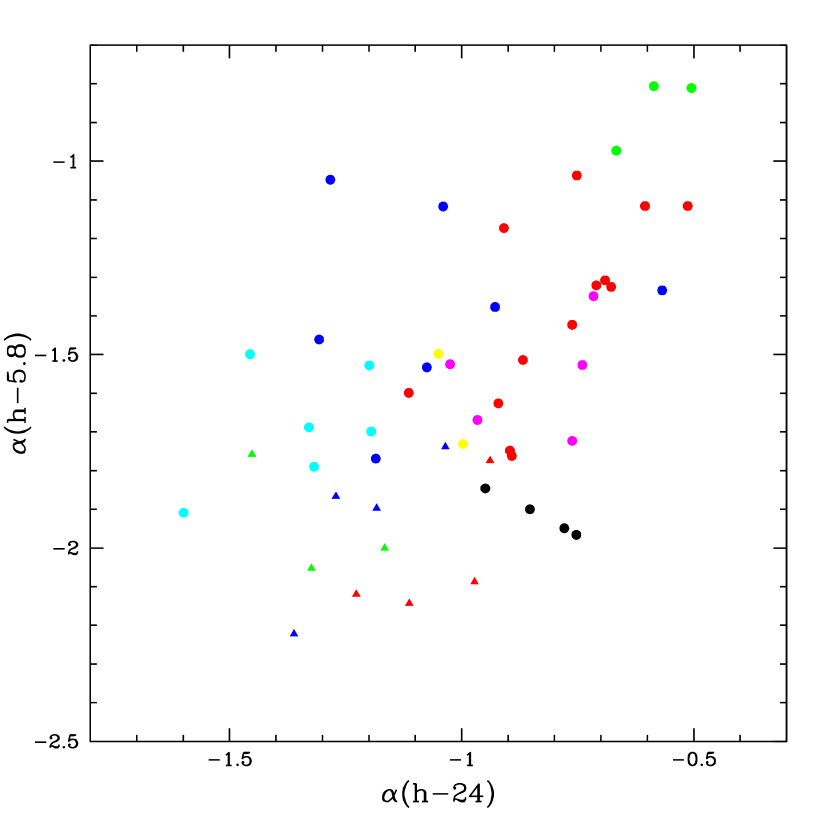
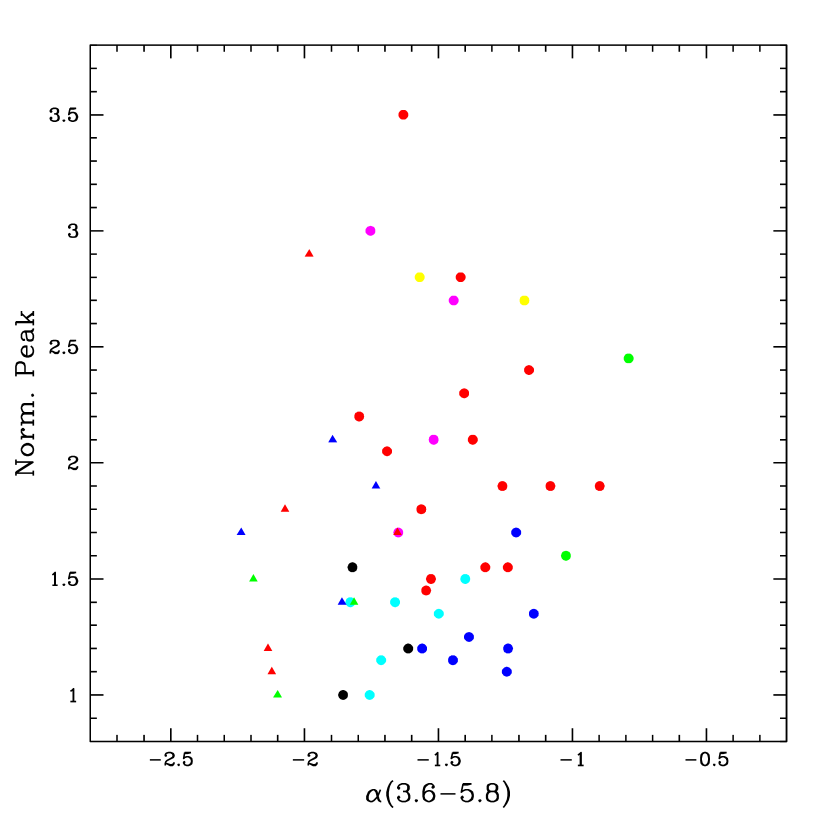
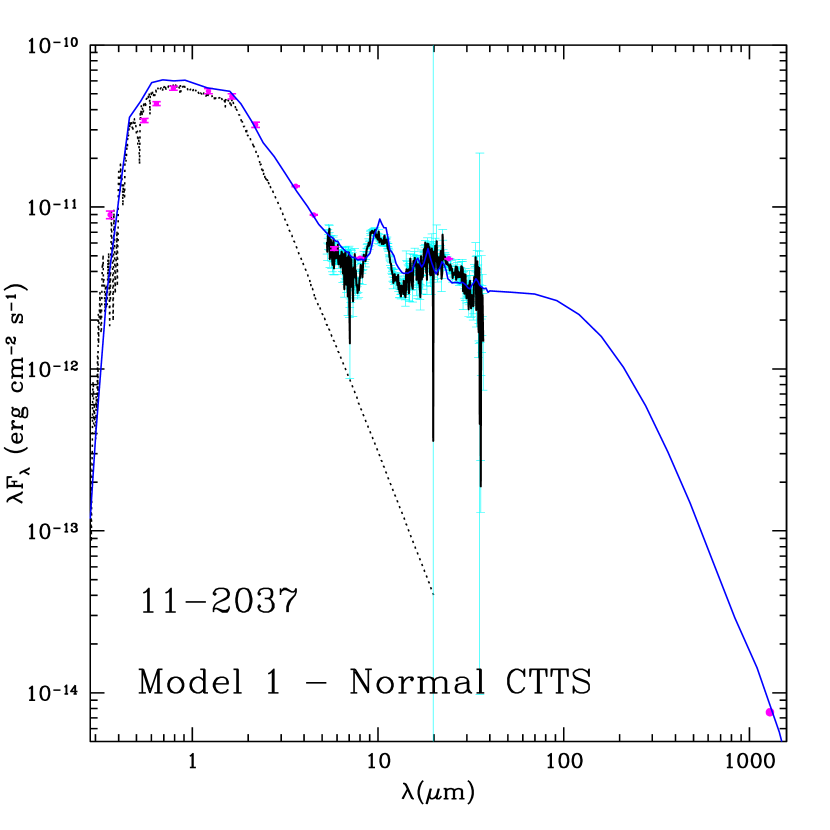
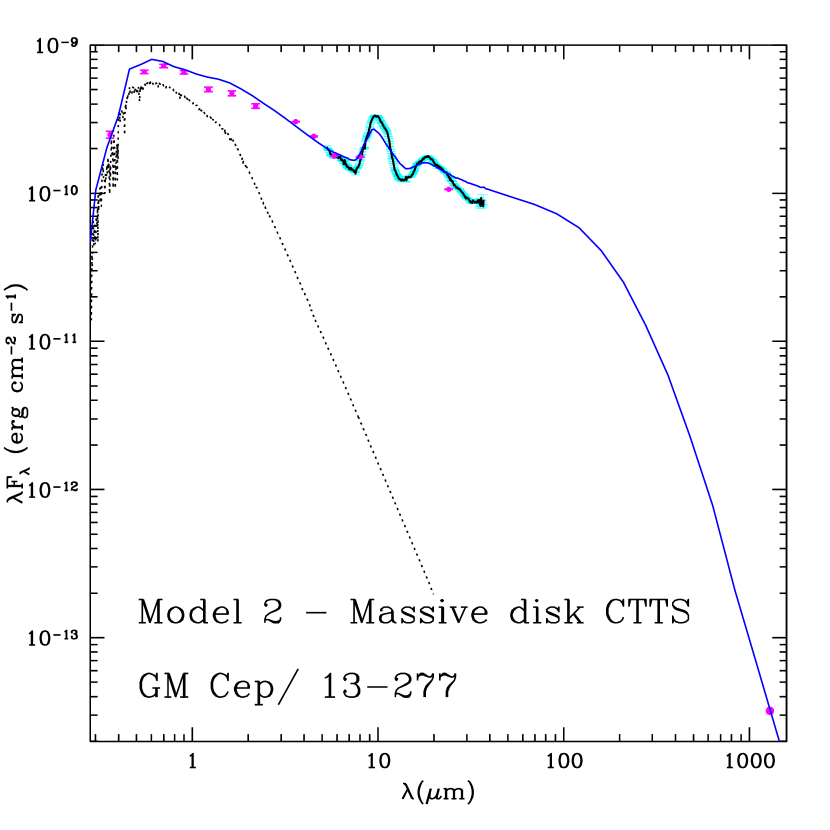
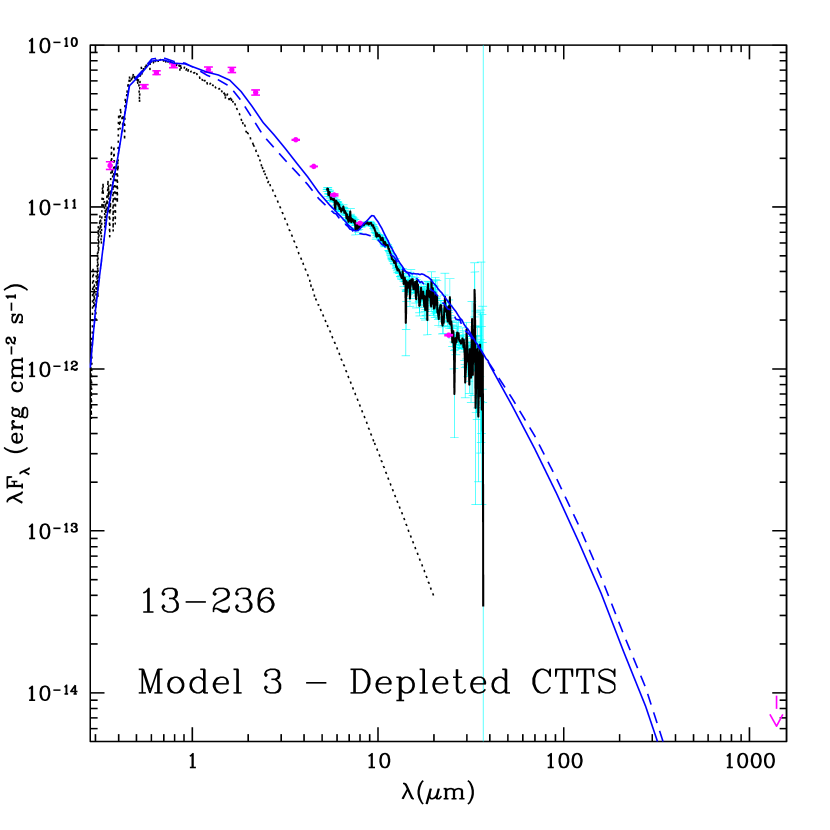
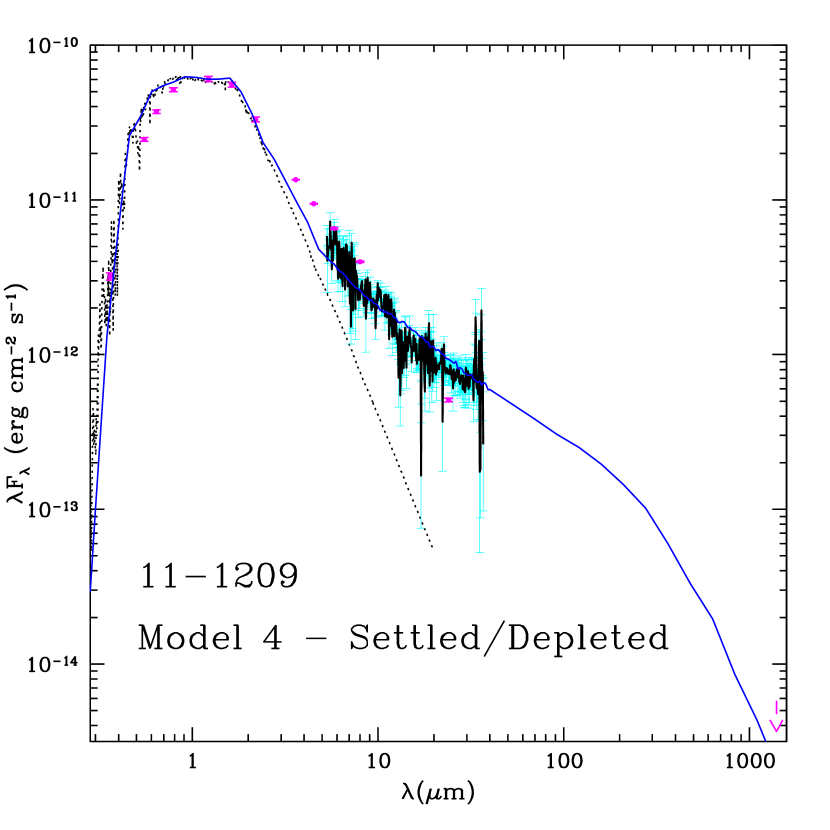
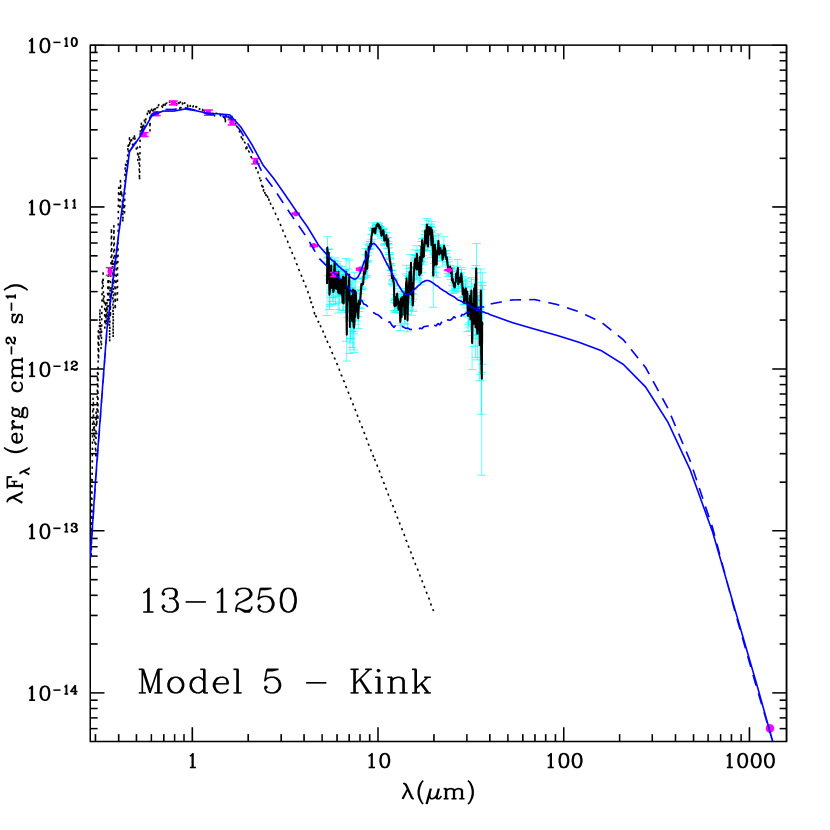
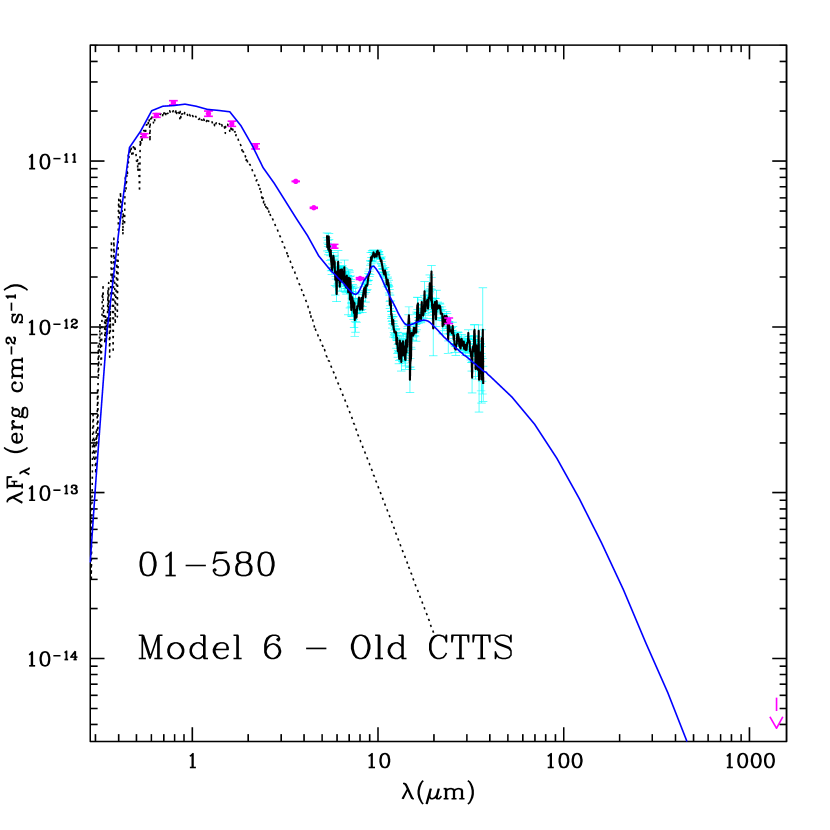
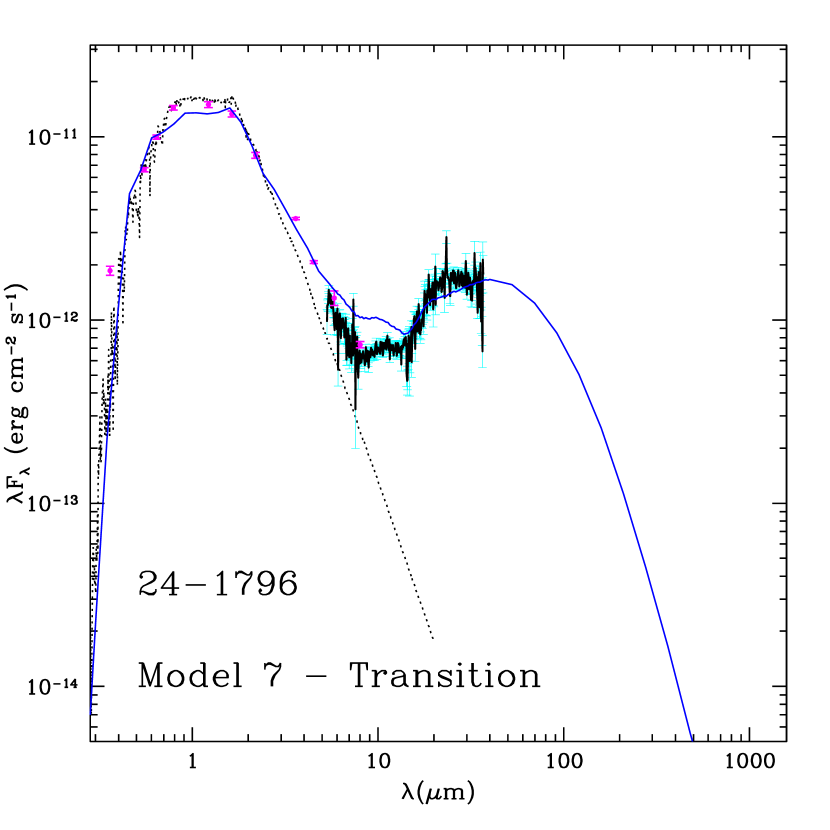
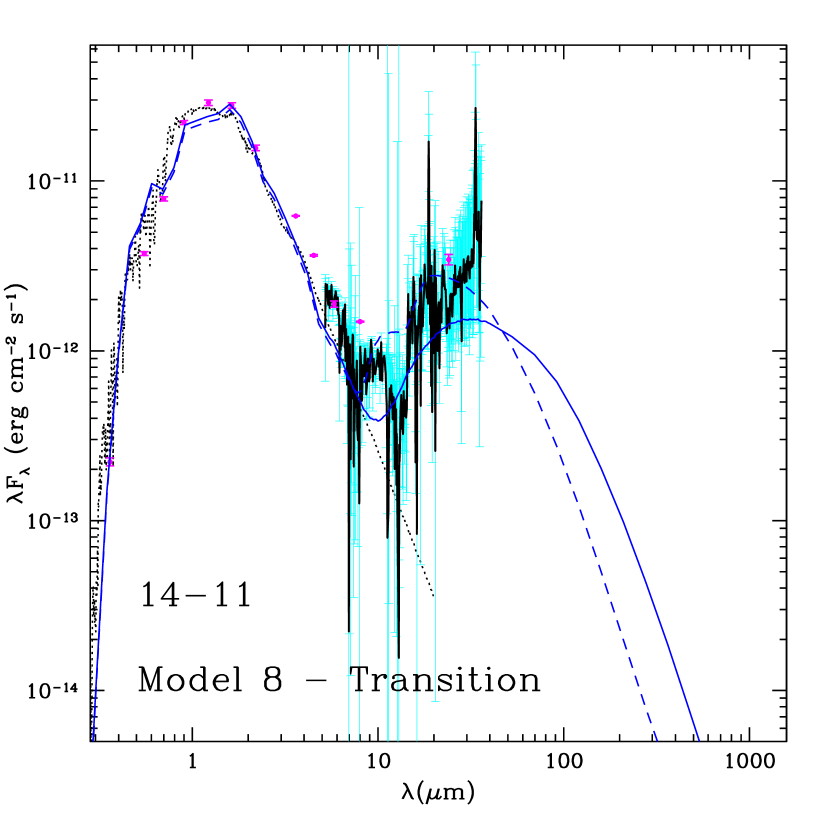
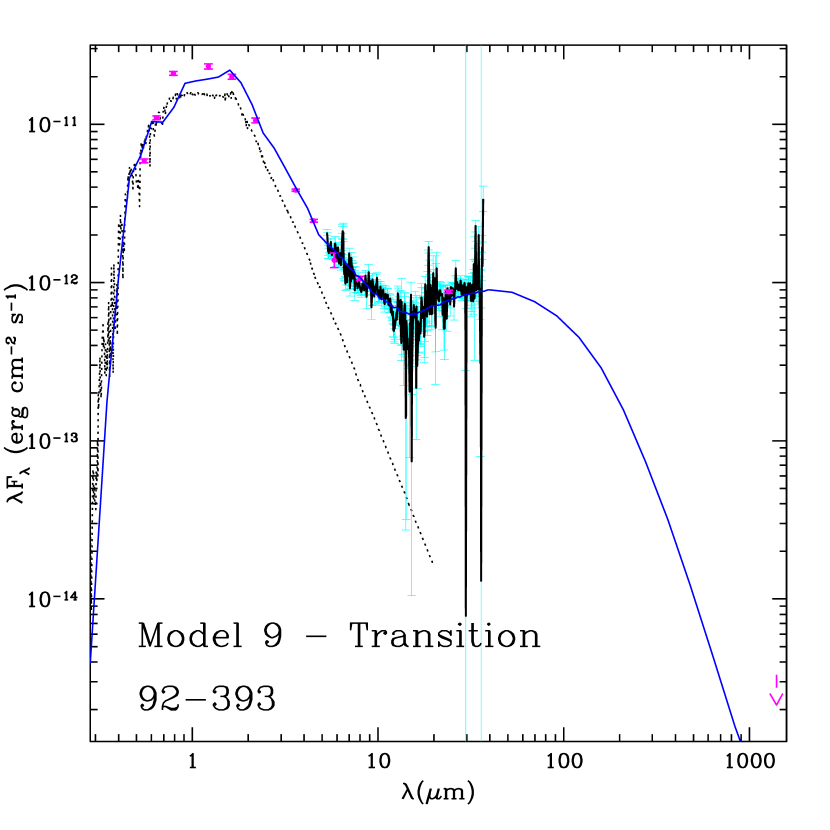
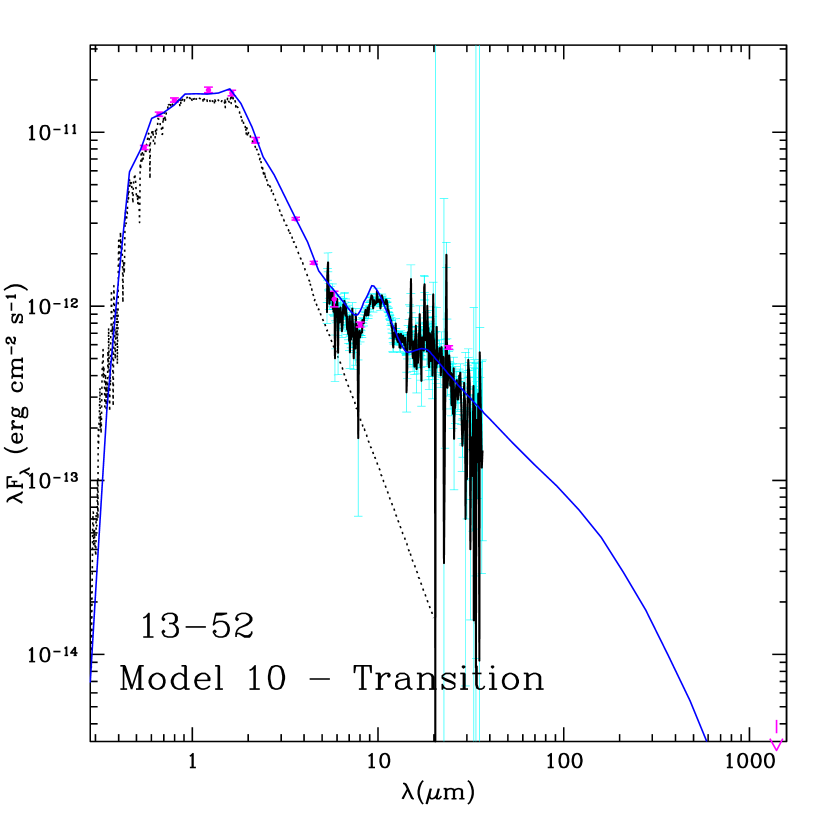
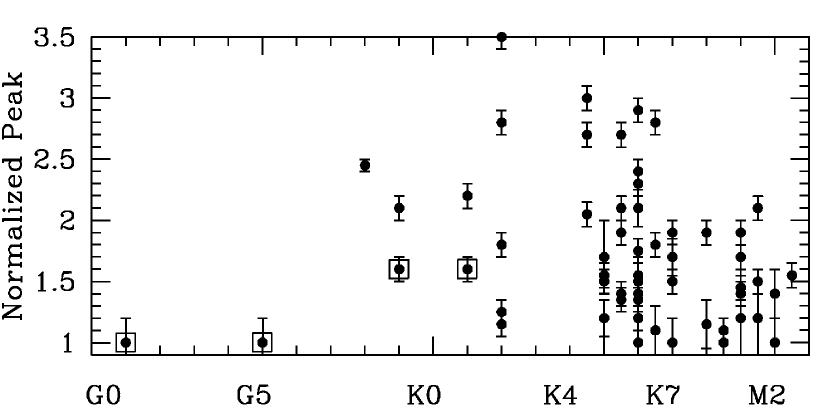
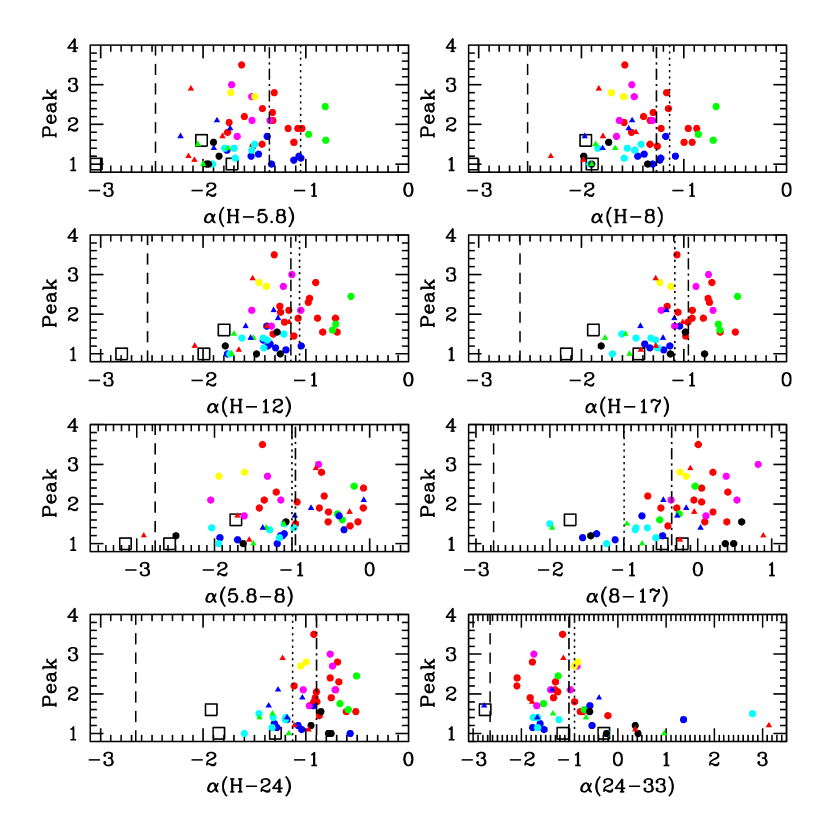
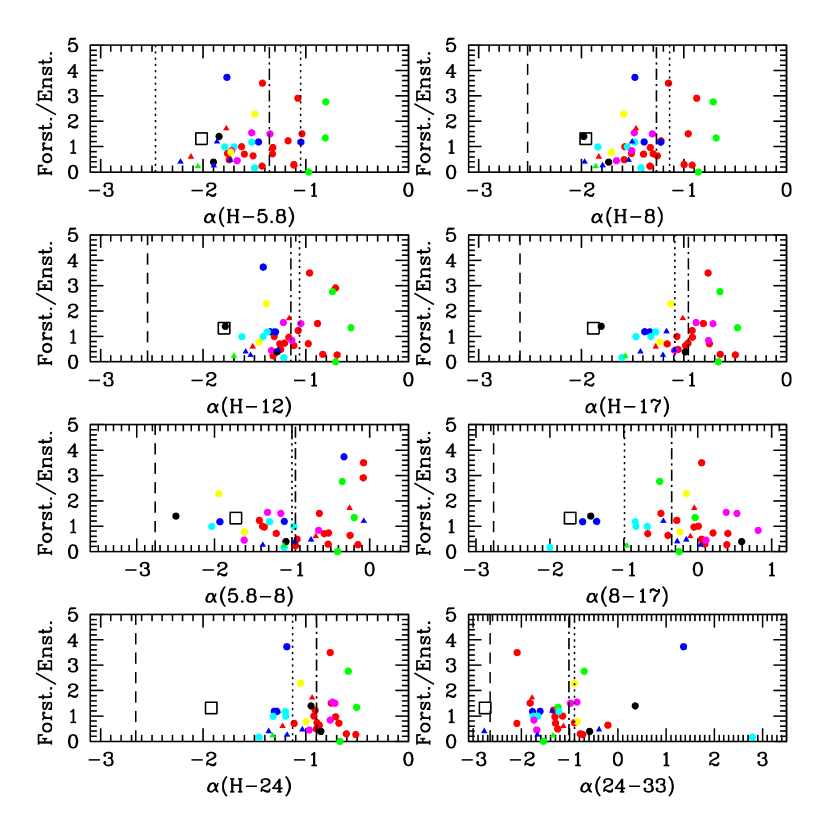
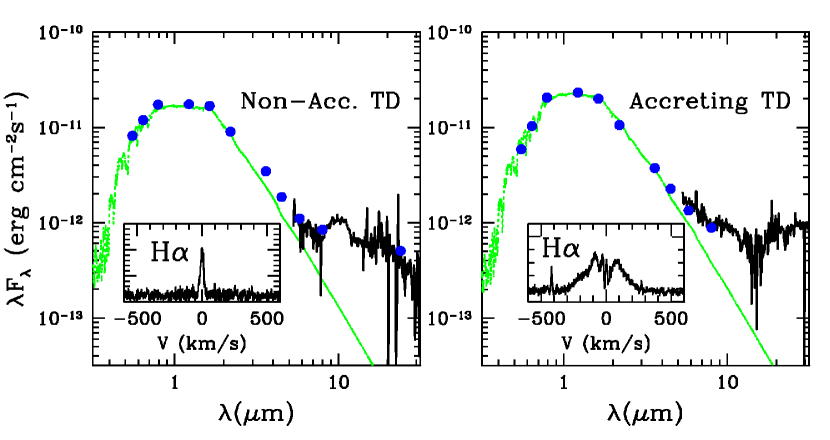
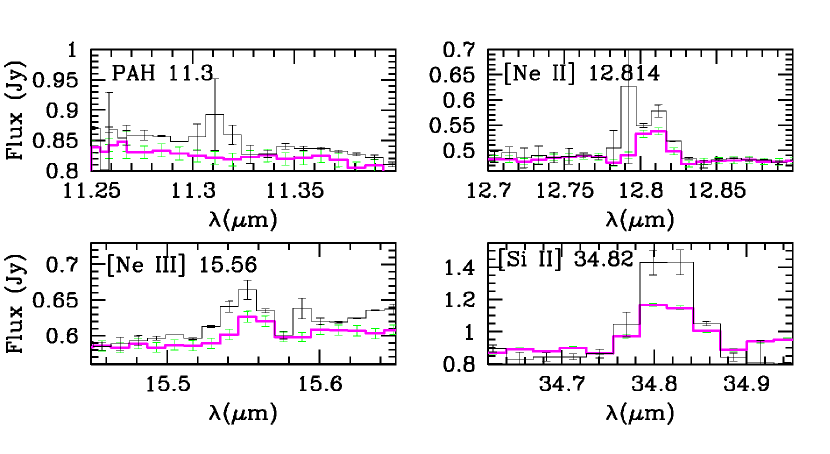
| Target | Coordinates(J2000) | Mode | Int.Time(s) | Sp.T. | AV (mag) | Age (Myr) | SED type | Ṁ (10-8M⊙/yr) | Sil. Peak | Comments |
|---|---|---|---|---|---|---|---|---|---|---|
| Tr 37 | ||||||||||
| 73-758 | 21:35:08.39 +57:36:03.2 | Low | 59-59-19-19 | K6.5 | 1.9 | 1.8 | 8 | 0 | 1.80.1 | |
| 72-1427 | 21:35:16.32 +57:28:23.0 | Low | 44-183 | M1.0 | 1.4 | 3.3 | 8 | 0.15 | 1.70.2 | |
| 73-472 | 21:35:18.61 +57:34:09.2 | Low | 1451-1451-975-975 | K5.0 | 1.7 | 3.3 | 7 | A | 1.20.1 | |
| 73-311 | 21:35:24.51 +57:33:01.1 | Low | 366-366-315-315 | M1.5 | 1.1 | 2.8 | 4 | A | 1.50.1 | |
| 73-71 | 21:35:30.21 +57:31:16.4 | Low | 1934-1934-975-975 | K6.0 | 2.1 | 1.8 | 4 | 2.1b | 1.40.1 | |
| 72-875 | 21:35:49.80 +57:24:04.6 | Low | 44-183-94-44 | M0.5 | 2.0 | 2.6 | 7 | 0.11/0 | 1.00.2 | SB1:, variable Ṁ |
| 21362507 | 21:36:25.08 +57:27:50.3 | Low | 44-183-94-44 | M0.0 | 3.5 | 26 | 1 | 0.09 | 1.90.1 | SB1 |
| 21364762 | 21:36:47.63 +57:29:54.1 | Low | 44-183-94-44 | K6.0 | 3.1: | 5.6 | 3 | A | 1.00.2 | Extended? |
| 14-141 | 21:36:49.41 +57:31:22.0 | Low | 44-183 | K6.0 | 1.7 | 0.8 | 3 | 2.3 | 1.20.1 | |
| 11-2146 | 21:36:57.69 +57:27:33.3 | Low | 13-13-13-13 | K6.0 | 2.6 | 2.5 | 1 | 0.99 | 2.30.1 | |
| 11-1209 | 21:36:58.55 +57:23:26.1 | Low | 29-29-126-126 | K6.0 | 0.6 | 1.4 | 4 | 0.6 | 1.00.2 | |
| 11-2322 | 21:37:01.96 +57:28:22.3 | Low | 13-13-13-13 | M1.0 | 0.9 | 0.7 | 3 | 1.6 | 1.20.3 | |
| 11-2037 | 21:37:07.07 +57:27:01.1 | Low | 44-44-13-13 | K4.5 | 1.6 | 2.5 | 1 | 9 | 2.00.1 | |
| 14-11 | 21:37:10.30 +57:30:19.1 | Low | 122-122-13-13 | M1.5 | 1.8 | 1.4 | 8 | 0 | 1.20.3 | |
| 14-125 | 21:37:10.54 +57:31:12.4 | Low | 366-366-189-189 | K5.0 | 1.7 | 3.0 | 1 | 0.3 | 1.50.1 | |
| 11-2131 | 21:37:12.19 +57:27:26.6 | Low | 13-13-13-13 | K6.5 | 2.3 | 3.0 | 3 | 0.3 | 1.10.2 | |
| 11-2031 | 21:37:15.95 +57:26:59.5 | Low | 13-13-13-13 | K2.0 | 1.7 | 4.5 | 1 | 0.3 | 2.80.1 | |
| 14-160 | 21:37:27.32 +57:31:29.5 | Low | 366-366-189-189 | K5.0 | 1.8 | 3.1 | 1 | A | 1.60.1 | |
| 14-183 | 21:37:38.53 +57:31:41.7 | Low | 44-44-13-13 | K6.0 | 2.0 | 4.8 | 5 | 0.16 | 2.10.1 | SB1: |
| CCDM+5734 | 21:37:40.93 +57:33:37.5 | Low | 13-13-13-13 | A3+A51 | 1.71 | 4.0* | D | — | 1.00.2 | Visual binary |
| 21374275 | 21:37:42.75 +57:33:25.0 | Low | 117-88-88-88 | F9.0 | 3.0 | 4.0* | 2 | A | 1.60.1 | |
| 12-2519 | 21:37:51.07 +57:27:50.2 | Low | 366-366-189-189 | K5.5 | 1.6 | 2.8 | 4 | 0.07 | 1.40.1 | |
| 12-1091 | 21:37:57.62 +57:22:47.6 | Low | 366-366-189-189 | K2.0 | 2.8 | 27 | 1 | 0.4 | 1.80.1 | |
| 13-1238 | 21:37:59.26 +57:36:16.2 | Low | 366-366-189-189 | M1.0 | 2.6 | 1.8 | 1 | 0.6 | 1.40.1 | |
| 82-272 | 21:38:03.53 +57:41:35.4 | Low | 13-13-13-13 | G9.0 | 3.6 | 13 | 1 | 0.9 | 2.10.1 | SB2 |
| 13-669 | 21:38:09.28 +57:33:26.2 | Low | 488-366-189-189 | K1.0 | 2.2 | 6.3 | 1 | 0.6 | 2.20.1 | |
| 21380979 | 21:38:09.79 +57:29:42.8 | Low | 1451-1451-731-731 | M1f | 1.7f | 4.0 | 10 | PA | 1.90.1 | |
| 54-1781 | 21:38:16.12 +57:19:35.7 | Low | 975-731-377-377 | M1.0 | 1.2 | 2.5 | 10 | 0.3 | 1.40.1 | |
| 13-1877 | 21:38:17.03 +57:39:26.5 | Low | 366-366-252-252 | K7.0 | 2.0 | 2.3 | 1 | 1.6 | 1.50.1 | |
| 13-277 | 21:38:17.31 +57:31:22.0 | Low | 50-38-50-50 | G8.0 | 2.5 | 1.9 | 2 | 14 | 2.50.1 | Variable Ṁ |
| ” | 21:38:17.31 +57:31:22.0 | High | 189-366 | ” | ” | ” | ” | ” | ” | ” |
| 13-236 | 21:38:27.42 +57:31:08.1 | Low | 366-366-189-189 | K2.0 | 1.8 | 5.4 | 3 | 0.51 | 1.20.1 | |
| 12-2113 | 21:38:27.47 +57:27:21.3 | Low | 13-13-13-13 | K6.0 | 2.5 | 1.1 | 1 | 6b | 2.40.1 | SB1 |
| 13-157 | 21:38:28.12 +57:30:47.1 | Low | 13-13-13-13 | K5.5 | 1.2 | 2.4 | 1 | 4.2 | 1.90.1 | |
| 13-52 | 21:38:32.55 +57:30:16.1 | Low | 1451-1451-731-731 | K7.0 | 1.3 | 4.1 | 10 | 0 | 1.70.1 | |
| 91-155 | 21:38:34.75 +57:41:28.0 | Low | 44-44-13-13 | M2.5 | 1.2 | 1.7 | 1 | PA | 1.60.1 | |
| 21384350 | 21:38:43.50 +57:27:27.0 | Low | 1451-1451-731-731 | M2.0 | 1.7 | 7.0 | 9 | 0 | 1.40.2 | |
| 54-1547 | 21:38:44.48 +57:18:09.6 | Low | 59-59-19-19 | K5.5 | 1.1 | 9.9 | 5 | 0.18 | 2.70.1 | |
| 91-506 | 21:38:58.07 +57:43:34.3 | Low | 1451-1451-731-731 | K6.5 | 1.4 | 6.5 | 6 | 0.09 | 2.80.1 | |
| 12-1617 | 21:39:04.68 +57:25:12.8 | Low | 1451-1451-731-731 | M1.0 | 1.6 | 1.6 | 5 | 0.2 | 1.70.1 | |
| 13-1250 | 21:39:12.17 +57:36:16.9 | Low | 44-44-13-13 | K4.5 | 1.4 | 3.9 | 5 | 0.3 | 3.00.1 | |
| 21392541 | 21:39:25.41 +57:33:20.2 | Low | 488-488-189-189 | K6f | 1.7f | 1.1 | 8 | A | 2.90.1 | |
| ” | 21:39:25.41 +57:33:20.2 | High | 5780-7254 | ” | ” | ” | ” | ” | ” | Not detected |
| 21392570 | 21:39:25.70 +57:29:45.5 | Low | 1451-1451-189-189 | K6f | 1.7f | 4.0 | 7 | PA | 1.60.1 | |
| 21393104 | 21:39:31.04 +57:47:14.0 | Low | 366-366-189-189 | K2f | 1.7f | 2.6 | 1 | — | 3.50.1 | |
| 24-515 | 21:39:34.10 +57:33:32.1 | Low | 426-426-144-144 | M0.5 | 1.1 | 5.6 | 8 | 0.10 | 1.10.1 | |
| 21-998 | 21:39:34.80 +57:23:27.7 | Low | 1451-1451-731-731 | K5.5 | 1.9 | 9.7 | 3 | 0.3 | 1.40.1 | SB1: |
| 21-33 | 21:39:35.64 +57:18:22.3 | Low | 366-366-489-489 | M0.0 | 1.7 | 9.6 | 4 | 0.07 | 1.10.2 | |
| 92-393 | 21:39:44.08 +57:42:15.9 | Low | 1451-1451-731-731 | M2.0 | 2.0 | 0.9 | 9 | A | 1.00.2 | |
| 21395813 | 21:39:58.13 +57:28:33.5 | Low | 117-117-189-189 | K2f | 1.7f | 8.0 | 3 | A | 1.10.1 | |
| 93-720 | 21:40:09.99 +58:00:03.6 | Low | 1451-1451-731-731 | K6.0f | 1.7f | 1.8 | 2 | A | 1.80.1 | |
| 24-1796 | 21:40:11.82 +57:40:12.1 | Low | 1451-1451-731-731 | K7.0 | 1.2 | 9.5 | 7 | 0.6 | 1.00.2 | SB2: |
| 21-2006 | 21:40:13.91 +57:28:48.5 | Low | 44-44-63-63 | K5.0 | 1.5 | 12 | 3 | 0.12 | 1.70.3 | |
| KUN-196 | 21:40:15.14 +57:40:51.2 | Low | 122-122-144-144 | B9.01 | 2.21 | 4.0* | D | — | 1.00.2 | |
| 21402192 | 21:40:21.92 +57:30:05.4 | Low | 1451-1451-731-731 | K6.0 | 1.4 | 7.0 | 9 | A | 1.50.1 | |
| 23-570 | 21:40:35.74 +57:34:55.0 | Low | 1451-1451-731-731 | K6.0 | 1.3 | 6.4 | 4 | 0.7 | 1.40.1 | |
| 23-162 | 21:40:44.52 +57:31:31.9 | Low | 59-59-63-63 | K7.0 | 1.7 | 6.6 | 1 | A | 1.90.1 | |
| 23-798 | 21:41:28.64 +57:36:43.2 | Low | 975-853-377-377 | K5.5 | 2.2 | 15.0 | 5 | 0.79b | 2.10.1 | |
| NGC 7160 | ||||||||||
| DG-481 | 21:52:21.10 +62:45:03.7 | Low | 122-122-975-975 | A7.0 | 1.5 | 10.0* | D | — | 1.60.1 | |
| 01-1152 | 21:53:19.82 +62:34:00.4 | Low | 2418-2418-1950-1950 | M1.5 | 0.9 | 5.6 | 10 | 0* | 2.10.1 | |
| 01-580 | 21:53:37.07 +62:28:47.2 | Low | 122-122-488-488 | K4.5 | 1.6 | 11.4 | 6 | 4 | 2.70.1 |
Note. — Disked stars observed with IRS and their characteristics. Spectral types and extinctions from Contreras et al.(2002; marked with 1) and Sicilia-Aguilar et al. (2004, 2005); the data for 13-277 from Sicilia-Aguilar et al. (2008). Spectral types and extinction obtained from SED fitting (see text) are marked with f. The ages are derived from the V vs V-I diagram and the Siess et al. (2000) isochrones, except for the intermediate-mass stars (marked with *), for which we take it to be the cluster median. Early K-G stars and/or those affected by scattering in the V-I colors tend to have anomalously large ages, not taken into account in the analysis. The SED types refer to the model prototypes in Section 3.3, while intermediate-mass stars are marked as “D”, given they are most likely debris disks or dust-depleted TD with large inner holes. Accretion rates and presence/absence of accretion from Sicilia-Aguilar et al.(2005,2006b, 2010). Accretion rates marked with b come from non-simultaneous data and may be more uncertain due to the intrinsic stellar variability. Objects marked with “A” have broad H and are thus accreting, although the accretion rate has not been measured. Objects marked with “PA” have strong H EW and are most likely accreting; conversely, objects marked with “0*” have small and narrow H emission and are probably not accreting. Uncertain values are marked with “:”. The SED type number corresponds to the models in Table 10, see text. A few cases where the disks around intermediate-mass stars may correspond to debris disks are marked with ”D”.
| Name | Program(s) | Nr. of scans | Tau | Flux (mJy) | Mdisk (M⊙) | Comments |
|---|---|---|---|---|---|---|
| Tr 37 | ||||||
| 73-758 | 132-07,145-08 | 6 | 0.2-0.4 | 1.8 | 0.009 | |
| 73-311 | 132-07,145-08 | 5 | 0.2-0.3 | 1.8 | 0.009 | |
| 73-71 | 132-07,145-08 | 6 | 0.2-0.3 | 1.5 | 0.008 | |
| MVA-1312 | 146-06 | 3 | 0.2-0.3 | 4.8 | 0.024 | |
| KUN-314s | 146-06 | 3 | 0.2-0.7 | 6.3 | 0.032 | Nebulosity contamination |
| 11-2146 | 146-06 | 3 | 0.2-0.7 | 2.90.6 | 0.015 | |
| 11-1209 | 146-06 | 3 | 0.2-0.4 | 2.4 | 0.012 | |
| 11-2037 | 146-06 | 2 | 0.2-0.3 | 3.30.9 | 0.017 | |
| 14-11 | 146-06 | 2 | 0.2-0.5 | 2.4 | 0.012 | Nebulosity contamination |
| 21374275 | 146-06 | 1 | 0.2 | 3.3 | 0.017 | Nebulosity contamination |
| 12-1091 | 146-06,132-07,145-08 | 7 | 0.1-0.4 | 1.8 | 0.009 | |
| MVA-426 | 146-06 | 2 | 0.2-0.2 | 2.20.7 | 0.011 | |
| 82-272 | 146-06,132-07,145-08 | 3 | 0.2-0.3 | 2.4 | 0.012 | |
| 13-669 | 146-06,132-07,145-08 | 3 | 0.2-0.3 | 2.4 | 0.012 | |
| 13-1877 | 146-06 | 2 | 0.3 | 2.7 | 0.014 | |
| 13-277 | 110-06 | 2 | 0.4 | 13.91.0 | 0.070 | Sicilia-Aguilar et al. (2008) |
| 13-236 | 146-06 | 1 | 0.3 | 3.9 | 0.020 | |
| 12-2113 | 146-06,132-07,145-08 | 4 | 0.2-0.4 | 1.8 | 0.009 | |
| 13-157 | 146-06,132-07,145-08 | 4 | 0.2-0.4 | 2.1 | 0.011 | |
| 54-1547 | 146-06,132-07,145-08 | 4 | 0.2-0.4 | 2.60.6 | 0.013 | |
| 91-506 | 132-07,145-08 | 5 | 0.2-0.5 | 2.20.5 | 0.011 | |
| 13-1250 | 146-06 | 2 | 0.2-0.4 | 2.40.8 | 0.012 | |
| 21392541 | 132-07,145-08 | 3 | 0.2-0.4 | 1.8 | 0.009 | |
| 24-515 | 146-06,132-07,145-08 | 6 | 0.2-0.4 | 1.8 | 0.009 | |
| 21-33 | 132-07,145-08 | 5 | 0.2-0.4 | 1.8 | 0.009 | |
| 92-393 | 132-07,145-08 | 5 | 0.2-0.4 | 1.8 | 0.009 | |
| 21395813 | 146-06,132-07,145-08 | 3 | 0.2-0.4 | 2.1 | 0.011 | |
| 93-720 | 132-07,145-08 | 4 | 0.3-0.4 | 2.1 | 0.011 | |
| KUN-196 | 146-06 | 2 | 0.2-0.5 | 2.7 | 0.014 | |
| 21402192 | 146-06,132-07,145-08 | 3 | 0.2-0.3 | 1.5 | 0.008 | |
| 23-798 | 132-07,145-08 | 4 | 0.2-0.3 | 2.1 | 0.011 | |
| NGC 7160 | ||||||
| DG-481 | 146-06 | 4 | 0.4-0.6 | 2.4 | 0.012 | |
| 01-1152 | 132-07,145-08 | 7 | 0.2-0.5 | 1.2 | 0.006 | |
| 01-580 | 146-06 | 4 | 0.3-0.6 | 2.4 | 0.012 |
Note. — Summary of IRAM 30m observations. To derive the total disk mass, the opacity of Beckwith et al. (1990; =2 cm2 g-1) and a gas to dust ratio of 100 have been applied. Upper limits correspond to 3 for non-detections.
| Target | IRAC 3.6m (Jy) | IRAC 4.5m (Jy) | IRAC 5.8m (Jy) | IRAC 8.0m (Jy) | MIPS 24m (Jy) |
|---|---|---|---|---|---|
| Tr 37 | |||||
| 73-758 | — | 426463 | 4308206 | 681191 | 15638101 |
| 72-1427I | 466350 | 372154 | 2932143 | 301393 | 13831484 |
| 73-472I | 998568 | 825477 | 5865155 | 393482 | 24402100 |
| 73-311 | 437348 | 445166 | 4205156 | 438888 | 4418101 |
| 73-71 | — | 8258110 | 6028157 | 5412195 | 9652102 |
| 72-875 | — | — | — | — | 198141204 |
| 21362507 | 306058 | 301361 | 3021224 | 487226 | 9196103 |
| 21364762 | — | — | — | — | — |
| 14-141 | 43079170 | 43062137 | 41906335 | 45029172 | — |
| 11-2146 | 30102130 | 27881122 | 22736266 | 27283152 | 76509112 |
| 11-1209 | 1560168 | 1375782 | 12274176 | 10310110 | 3950104 |
| 11-2322 | 1239982 | 1055179 | 9468223 | 955639 | 16711106 |
| 11-2037 | 1465690 | 1244361 | 9938245 | 1197582 | 35664106 |
| 14-11 | 710641 | 526359 | 3509154 | 381523 | 265271881 |
| 14-125 | 1095577 | 1009778 | 9187248 | 968137 | 284241388 |
| 11-2131 | 1523491 | 1401365 | 11430243 | 1087982 | 18036482 |
| 11-2031 | 22307112 | 20279106 | 17741266 | 25481153 | 56282933 |
| 14-160 | 1193282 | 1065980 | 9423223 | 11355114 | 26958571 |
| 14-183 | 1317783 | 1002778 | 7779212 | 6151103 | 19010104 |
| CCDM+5734 | 249310529 | 196333201 | 106594374 | 95747168 | 1075983171 |
| 21374275 | 57090185 | 44097113 | 50220344 | 64140162 | 1293771549 |
| 12-2519 | 585764 | 479663 | 3945208 | 381891 | 8514103 |
| 12-1091 | 1267784 | 1081180 | 9228240 | 11157104 | 20119103 |
| 13-1238 | 973062 | 899061 | 8593207 | 964591 | 18905101 |
| 82-272 | 32715107 | 28404128 | 23378227 | 26260150 | 75995108 |
| 13-669 | 1599193 | 1429167 | 13162245 | 1588389 | 14891103 |
| 21380979I,M | 320157 | 274057 | 2811211 | 340181 | 11857102 |
| 54-1781 | 354344 | 288458 | 2517192 | 199478 | 3406101 |
| 13-1877 | 1726993 | 1594991 | 14760255 | 16650125 | 35512100 |
| 13-277 | 325705757 | 397223456 | 316238775 | 514053552 | 7793252871 |
| 13-236 | 28167131 | 2469785 | 21195250 | 19573107 | 11950103 |
| 12-2113 | 19438104 | 19177102 | 20070269 | 24421142 | 34765103 |
| 13-157 | 24698117 | 2138183 | 17888244 | 18270130 | 22978104 |
| 13-52 | 353561 | 251246 | 2001207 | 197665 | 437799 |
| 91-155 | 637266 | 661858 | 7301241 | 1016586 | 24939100 |
| 21384350 | 295657 | 231657 | 2145196 | 196591 | 2503101 |
| 54-1547 | 804071 | 652070 | 5242234 | 579399 | 16233102 |
| 91-506 | 789368 | 668969 | 5267249 | 556189 | 1407497 |
| 12-1617 | 732852 | 578054 | 4475168 | 398368 | 10447100 |
| 13-1250 | 1004577 | 811672 | 6939217 | 10332108 | 30610105 |
| 21392541I,M | 1224381 | 989877 | 7976252 | 9388105 | 14261101 |
| 21392570I,M | 449858 | 349049 | 2649260 | 283763 | 978498 |
| 21393104I,M | 21028107 | 1692940 | 12330252 | 14567100 | — |
| 24-515 | 288943 | 212158 | 1763153 | 170587 | 513499 |
| 21-998 | 819771 | 731772 | 6415240 | 575994 | 10539104 |
| 21-33 | 240757 | 226648 | 1956213 | 209674 | 271197 |
| 92-393M | 409758 | 337161 | 2446262 | 258977 | 6408144 |
| 21395813I,M | 38709157 | 33078142 | 27382269 | 23714143 | 16536101 |
| 93-720 | — | — | — | — | — |
| 24-1796 | 399558 | 294553 | 2409221 | 185070 | — |
| 21-2006 | 754260 | 683554 | 5943234 | 712874 | — |
| KUN-196 | 545563 | 356061 | 2214214 | 147685 | — |
| 21402192 | 380157 | 287758 | 2671218 | 248282 | 2648100 |
| 23-570 | 788669 | 687870 | 6178248 | 606494 | — |
| 23-162 | 732867 | 647951 | 6260260 | 643062 | 9797141 |
| 23-798 | — | — | — | — | — |
| NGC7160 | |||||
| 01-1152 | 111351 | 108352 | 1069244 | 142467 | 928142 |
| 01-580 | 825513 | 731962 | 5530146 | 486267 | 8125307 |
| DG-481 | 981365 | 767171 | 6574207 | 537682 | 2395187 |
Note. — IRAC and MIPS fluxes for the targets observed with IRS. Most of the objects had already been presented in SA06, and their newly reduced values are in good agreement with those. New IRAC and MIPS detections (due to the inclusion of archive data from the region, better data from the new pipelines, and/or new members found in Sicilia-Aguilar et al. 2006b) are marked with I and M, respectively. IRAC and MIPS photometry for 21364762 is contaminated by the strong background, and 93-720 is located out of the IRAC and MIPS fields.
| Target | U | V | R | I | References |
|---|---|---|---|---|---|
| Cousins System photometry | |||||
| Tr 37 | |||||
| 73-758 | — | 17.062 | 15.845 | 14.761 | 1 |
| 72-1427 | — | 18.080 | 16.822 | 15.580 | 1 |
| 73-472 | — | 16.851 | 15.755 | 14.805 | 1 |
| 73-311 | — | 18.378 | 17.126 | 15.887 | 1 |
| 73-71 | — | 16.989 | 15.813 | 14.694 | 1 |
| 72-875 | — | 18.367 | 17.382 | 16.178 | 1 |
| 21362507 | — | 20.426 | — | — | 1 |
| 14-141 | 19.349 | 15.810 | 14.680 | 13.519 | 1 |
| 11-2146 | 18.157 | 16.917 | 15.688 | 14.412 | 1 |
| 11-1209 | 17.695 | 15.414 | 14.522 | 13.596 | 1 |
| 11-2322 | 18.690 | 16.687 | 15.591 | 14.383 | 1 |
| 11-2037 | 18.115 | 16.033 | 15.085 | 14.127 | 1 |
| 14-11 | — | 17.528 | 16.145 | 14.774 | 1 |
| 14-125 | 20.027 | 16.738 | 15.733 | 14.701 | 1 |
| 11-2131 | 19.815 | 17.722 | 16.433 | 15.248 | 1 |
| 11-2031 | 18.084 | 15.483 | 14.582 | 13.697 | 1 |
| 14-160 | 20.234 | 16.909 | 15.843 | 14.832 | 1 |
| 14-183 | 20.838 | 16.613 | 15.371 | 14.217 | 1 |
| CCDM+5734 | — | 8.240 | — | — | 3 |
| 12-2519 | — | 17.274 | 16.231 | 15.210 | 1 |
| 12-1091 | 18.613 | 16.587 | 15.652 | 14.730 | 1 |
| 13-1238 | 19.149 | 18.355 | 16.827 | 15.370 | 1 |
| 82-272 | — | 17.257 | 16.170 | 14.997 | 1 |
| 13-669 | 18.285 | 15.836 | 14.857 | 13.922 | 1 |
| 21380979 | — | 18.793 | — | — | 1 |
| 54-1781 | — | 18.180 | 16.999 | 15.654 | 1 |
| 13-1877 | 19.190 | 16.829 | 15.591 | 14.445 | 1 |
| 13-277 | 16.987 | 13.915 | 12.952 | 12.141 | 1 |
| 13-236 | 17.559 | 15.641 | 14.706 | 13.856 | 1 |
| 12-2113 | 18.786 | 17.143 | 15.920 | 14.669 | 1 |
| 13-157 | 17.510 | 16.234 | 15.255 | 14.327 | 1 |
| 13-52 | — | 17.265 | 16.182 | 15.148 | 1 |
| 91-155 | — | 18.306 | 16.943 | 15.515 | 1 |
| 21384350 | — | 20.025 | — | — | 1 |
| 54-1547 | 18.655 | 16.653 | 15.698 | 14.813 | 1 |
| 91-506 | — | 16.842 | 15.766 | 14.756 | 1 |
| 12-1617 | 19.721 | 17.786 | 16.508 | 15.189 | 1 |
| 13-1250 | 18.676 | 16.049 | 15.090 | 14.235 | 1 |
| 24-515 | — | 17.896 | 16.700 | 15.576 | 1 |
| 21-998 | 19.178 | 17.478 | 16.395 | 15.301 | 1 |
| 21-33 | — | 18.677 | 17.397 | 16.141 | 1 |
| 92-393 | — | 18.272 | 16.826 | 15.354 | 1 |
| 93-720 | — | 16.453 | 15.368 | 14.362 | 1 |
| 24-1796 | 19.157 | 17.395 | 16.367 | 15.312 | 1 |
| 21-2006 | 19.661 | 16.994 | 16.005 | 15.020 | 1 |
| KUN-196 | — | 13.850 | — | — | 3 |
| 23-570 | — | 16.847 | 15.715 | 14.873 | 1 |
| 23-162 | — | 17.974 | 16.705 | 15.689 | 1 |
| 23-798 | 19.717 | 18.755 | 17.423 | 16.360 | 1 |
| NGC 7160 | |||||
| 01-1152 | — | 18.574 | 17.370 | 16.186 | 1 |
| 01-580 | — | 16.937 | 15.958 | 15.054 | 1 |
| DG-481 | — | 13.220 | 113.220 | 113.220 | 2 |
| Johnsons System Photometry | |||||
| Tr 37 | |||||
| 21364762 | — | 18.472 | 16.809 | 15.116 | 4 |
| 21374275 | — | 17.485 | 16.355 | 15.128 | 4 |
| 21392541 | — | 16.577 | — | 13.733 | 4 |
| 21393104 | — | 15.690 | — | 13.326 | 4 |
| 21395813 | — | 14.545 | — | 12.664 | 4 |
| 21402192 | — | 16.964 | 15.415 | 14.485 | 4 |
| 72-1427 | 20.176 | 18.272 | 16.618 | 15.161 | 4 |
| 72-875 | 20.814 | 18.245 | 16.590 | 15.006 | 4 |
| 21362507 | 21.833 | 20.426 | 18.578 | — | 4 |
| 14-141 | 19.219 | 16.036 | 14.508 | 13.094 | 4 |
| 11-2146 | 18.684 | 16.662 | 15.211 | 13.999 | 4 |
| 11-1209 | 17.755 | 15.340 | 14.040 | 13.094 | 4 |
| 11-2322 | 18.858 | — | 15.357 | 13.953 | 4 |
| 11-2037 | 18.144 | — | — | 13.687 | 4 |
| 14-11 | 20.899 | 17.653 | 16.170 | 14.269 | 4 |
| 14-125 | 19.169 | 16.616 | 15.224 | 14.041 | 4 |
| 11-2131 | 20.123 | — | 15.853 | 14.605 | 4 |
| 11-2031 | 17.601 | — | 14.240 | 13.345 | 4 |
| 14-183 | 19.838 | 17.112 | 15.648 | 14.431 | 4 |
| 12-2519 | 20.539 | — | 15.958 | 14.763 | 4 |
| 12-1091 | 18.983 | 16.274 | 14.984 | 13.984 | 4 |
| 13-1238 | 19.259 | 17.902 | 16.337 | 14.601 | 4 |
| 82-272 | 19.414 | 16.616 | 15.266 | 14.019 | 4 |
| 13-669 | 18.231 | 15.834 | 14.630 | 13.507 | 4 |
| 54-1781 | 20.299 | 18.564 | 16.922 | 15.120 | 4 |
| 13-1877 | 18.883 | 17.189 | 15.620 | 14.222 | 4 |
| 13-277 | 15.016 | 13.146 | 12.090 | 11.117 | 4 |
| 13-236 | 17.665 | 15.546 | 14.431 | 13.412 | 4 |
| 13-157 | 17.861 | 16.768 | 15.320 | 14.012 | 4 |
| 21384350 | 23.366 | 19.918 | — | — | 4 |
| 54-1547 | 18.539 | 16.571 | 15.299 | 14.437 | 4 |
| 91-506 | 19.777 | 17.141 | 15.732 | 14.546 | 4 |
| 12-1617 | 20.831 | 18.039 | — | — | 4 |
| 13-1250 | 18.403 | 15.956 | — | 13.668 | 4 |
| 24-515 | 19.908 | 17.941 | 16.396 | 15.123 | 4 |
| 21-998 | 19.798 | 17.668 | — | 14.961 | 4 |
| 21-33 | 20.814 | 18.723 | 17.138 | 15.722 | 4 |
| 24-1796 | 18.389 | 17.341 | 15.897 | 14.825 | 4 |
| 21-2006 | 19.564 | 16.933 | 15.517 | 14.589 | 4 |
| 23-570 | 18.391 | 16.718 | 15.276 | 14.308 | 4 |
| NGC 7160 | |||||
| 01-580 | 18.380 | 17.392 | 15.755 | 14.737 | 4 |
Note. — Summary of optical magnitudes for the analyzed sources. References: (1) Sicilia-Aguilar et al. (2005); (2) De Graeve (1983); (3) Marschall & van Altena(1987); (4) Sicilia-Aguilar et al. (2010).
| Target | 2MASS ID | J | H | K |
|---|---|---|---|---|
| Tr 37 | ||||
| 73-758 | 21350835+5736028 | 13.3300.028 | 12.5330.032 | 12.1630.028 |
| 72-1427 | 21351627+5728222 | 14.0050.031 | 13.0670.029 | 12.6730.028 |
| 73-472 | 21351861+5734092 | 13.2190.024 | 12.2990.031 | 11.8290.022 |
| 73-311 | 21352451+5733011 | 14.0140.034 | 13.1150.037 | 12.6740.030 |
| 73-71 | 21353021+5731164 | 12.9790.034 | 12.1050.037 | 11.7150.029 |
| 72-875 | 21354975+5724041 | 14.0920.031 | 13.0060.027 | 12.5000.026 |
| 21362507 | 21362507+5727502 | 14.9520.044 | 14.0310.048 | 13.5180.040 |
| 21364762 | 21364762+5729540 | 13.568: | 12.3420.042 | 11.6550.033 |
| 14-141 | 21364941+5731220 | 11.9180.022 | 10.9140.029 | 10.3550.021 |
| 11-2146 | 21365767+5727331 | 12.4420.031 | 11.3270.032 | 10.6400.025 |
| 11-1209 | 21365850+5723257 | 12.2000.024 | 11.4330.033 | 11.1220.023 |
| 11-2322 | 21370191+5728222 | 12.8540.029 | 11.9690.033 | 11.5600.025 |
| 11-2037 | 21370703+5727007 | 12.6490.026 | 11.7520.027 | 11.2580.020 |
| 14-11 | 21371031+5730189 | 13.0570.029 | 12.2160.034 | 11.9560.026 |
| 14-125 | 21371054+5731124 | 13.0900.026 | 12.1700.029 | 11.7320.021 |
| 11-2131 | 21371215+5727262 | 13.3930.027 | 12.2140.031 | 11.5230.025 |
| 11-2031 | 21371591+5726591 | 12.4990.025 | 11.5340.028 | 10.8560.020 |
| 14-160 | 21372732+5731295 | 13.2180.037 | 12.3490.041 | 11.9540.033 |
| 14-183 | 21373849+5731408 | 13.3030.029 | 12.2290.031 | 11.6680.045 |
| CCDM+5734 | 21374093+5733372 | 7.6970.019 | 7.6470.031 | 7.6110.021 |
| 21374275 | 21374275+5733250 | 12.5610.023 | 11.3080.026 | 10.3880.021 |
| 12-2519 | 21375107+5727502 | 13.6470.030 | 12.8160.036 | 12.4600.022 |
| 12-1091 | 21375762+5722476 | 13.1820.024 | 12.2150.029 | 11.6730.020 |
| 13-1238 | 21375926+5736162 | 13.3210.027 | 12.4000.032 | 11.8890.018 |
| 82-272 | 21380350+5741349 | 12.5020.026 | 11.4830.029 | 10.8470.019 |
| 13-669 | 21380928+5733262 | 12.3910.029 | 11.5660.029 | 11.1950.020 |
| 21380979 | 21380979+5729428 | 14.1610.040 | 13.3560.044 | 12.9740.042 |
| 54-1781 | 21381612+5719357 | 13.9910.032 | 13.0920.032 | 12.7920.030 |
| 13-1877 | 21381703+5739265 | 12.9350.039 | 11.9540.043 | 11.2630.024 |
| 13-277 | 21381731+5731220 | 10.2790.026 | 9.3290.029 | 8.5930.020 |
| 13-236 | 21382742+5731081 | 12.3550.036 | 11.3630.040 | 10.7740.024 |
| 12-2113 | 21382743+5727207 | 12.8560.030 | 11.9860.035 | 11.5060.024 |
| 13-157 | 21382804+5730464 | 12.9120.030 | 11.9790.036 | 11.2490.052 |
| 13-52 | 21383255+5730161 | 13.7380.047 | 12.8420.040 | 12.6070.031 |
| 91-155 | 21383470+5741274 | 13.7410.035 | 12.8750.048 | 12.4890.036 |
| 21384350 | 21384350+5727270 | 14.2460.034 | 13.4470.037 | 13.0650.034 |
| 54-1547 | 21384446+5718091 | 13.4210.027 | 12.6470.035 | 12.1800.026 |
| 91-506 | 21385807+5743343 | 13.3860.031 | 12.5210.036 | 12.0400.022 |
| 12-1617 | 21390468+5725128 | 13.5420.026 | 12.6270.028 | 12.1290.024 |
| 13-1250 | 21391213+5736164 | 12.9200.024 | 12.1190.029 | 11.7990.023 |
| 21392541 | 21392541+5733202 | 12.5900.025 | 11.6860.029 | 11.3120.018 |
| 21392570 | 21392570+5729455 | 13.9420.032 | 12.9960.032 | 12.7000.028 |
| 21393104 | 21393104+5747140 | 12.4100.027 | 11.4910.028 | 11.0230.023 |
| 24-515 | 21393407+5733316 | 14.0570.028 | 13.1250.033 | 12.7040.028 |
| 21-998 | 21393480+5723277 | 13.8500.029 | 12.9720.033 | 12.4760.028 |
| 21-33 | 21393561+5718220 | 14.5010.039 | 13.5810.040 | 13.2200.044 |
| 92-393 | 21394408+5742159 | 13.6190.026 | 12.7650.028 | 12.5050.023 |
| 21395813 | 21395813+5728335 | 11.7200.024 | 10.9680.031 | 10.4220.022 |
| 93-720 | 21400999+5800036 | 12.7090.024 | 11.5800.030 | 10.9400.022 |
| 24-1796 | 21401182+5740121 | 13.8760.035 | 13.0760.039 | 12.7340.037 |
| 21-2006 | 21401390+5728481 | 13.7040.029 | 12.9200.038 | 12.4880.030 |
| KUN-196 | 21401508+5740513 | 12.1450.035 | 11.9220.046 | 11.8810.051 |
| 21402192 | 21402192+5730054 | 13.6080.039 | 12.7540.038 | 12.5380.032 |
| 23-570 | 21403574+5734550 | 13.4770.030 | 12.5560.030 | 12.1940.028 |
| 23-162 | 21404450+5731314 | 14.0440.030 | 13.1440.037 | 12.5880.029 |
| 23-798 | 21412864+5736432 | 14.4100.022 | 13.5330.035 | 12.8200.030 |
| NGC 7160 | ||||
| 01-1152 | 21531982+6234004 | 14.9300.044 | 14.0780.050 | 13.7640.043 |
| 01-580 | 21533707+6228469 | 13.7070.029 | 12.8870.031 | 12.3010.025 |
| DG-481 | 21522113+6245034 | 11.9180.027 | 11.7130.031 | 11.5200.021 |
Note. — Summary of 2MASS magnitudes for the analyzed sources. Most of the data are already published in Sicilia-Aguilar et al. (2004, 2005).
| Name | 0.1m A.Ol. | 0.1m A.Py. | 0.1m Fors. | 0.1m Enst. | 0.1m Sil. |
|---|---|---|---|---|---|
| 1.5m A.Ol. | 1.5m A.Py. | 1.5m Fors. | 1.5m Enst. | 1.5m Sil. | |
| 6.0m A.Ol. | 6.0m A.Py. | 6.0m Fors. | — | 6.0m Sil. | |
| Tr 37 | |||||
| 73-758 | 0.7 | — | 2.0 | 0.1 | — |
| 12 | 17 | 0.7 | 1.6 | 0.2 | |
| 7 | 55 | — | — | 4 | |
| 73-472 | 30 | 9 | 2.5 | 0.5 | 0.1 |
| 21 | 8 | 0.6 | 2.7 | 0.4 | |
| 25 | — | — | — | 0.1 | |
| 73-311 | 2 | 3 | — | 1.5 | 0.5 |
| 0.2 | 19 | 0.2 | 0.1 | 0.1 | |
| 48 | 8 | 3 | — | 15 | |
| 73-71 | — | 11 | 0.6 | — | 1.3 |
| 0.2 | 8 | 0.3 | 3.9 | — | |
| 71 | 0.3 | 3.3 | — | 0.2 | |
| 21362507 | 17 | 4 | — | — | — |
| 3 | 10 | 5 | 2 | — | |
| — | 58 | 2 | — | — | |
| 11-2146 | 12 | 1 | 1.4 | — | 0.7 |
| 16 | 22 | — | 3 | — | |
| 11 | 32 | 9 | — | 4 | |
| 11-2037 | 6 | — | — | 2 | 3 |
| 1 | 42 | 1 | — | — | |
| 32 | 16 | — | — | 1 | |
| 14-125 | — | 10 | 0.9 | 0.8 | 1.5 |
| — | 2 | 0.2 | 4 | — | |
| 15 | 64 | — | — | 2 | |
| 11-2031 | 16 | 3 | 2 | — | — |
| 12 | 38 | 7 | — | 2 | |
| 12 | 16 | — | — | 4 | |
| 14-160 | 32 | — | 0.8 | — | — |
| 5 | 6 | — | 3 | — | |
| — | 49 | — | — | 4 | |
| 14-183 | 68 | — | 4 | — | — |
| — | 4 | 4 | — | — | |
| 35 | 18 | — | — | — | |
| 21374275 | — | — | 1.8 | — | 0.2 |
| — | 14 | 2.0 | 1.5 | 0.6 | |
| 0.8 | 79 | — | — | — | |
| 12-2519 | 0.2 | 2 | 3 | 0.1 | 2 |
| 1 | 1 | 4 | 8 | 4 | |
| 33 | 25 | 2 | — | 15 | |
| 12-1091 | 6 | 9 | 4 | — | — |
| 1 | 24 | 1 | 6 | 2 | |
| 45 | 1 | — | — | 1 | |
| 13-1238 | 2 | — | 6 | 2 | — |
| 4 | 23 | 1 | 7 | 3 | |
| — | 50 | — | — | 1 | |
| 82-272 | 15 | 3 | 8 | 2 | 2 |
| 11 | 60 | — | 6 | 4 | |
| 3 | — | — | — | — | |
| 13-669 | — | — | 2.4 | 0.7 | 1.2 |
| — | 44 | 1.3 | 5.3 | — | |
| — | 44 | 1 | — | — | |
| 32380979 | 2 | — | 7 | — | — |
| — | 54 | — | 15 | — | |
| — | 23 | — | — | — | |
| 13-1877 | 0.1 | 0.8 | 2.5 | 1.3 | — |
| — | 49 | 0.1 | 4 | 0.8 | |
| 20 | 20 | — | — | 2 | |
| 13-277 | 23 | — | 1.8 | 0.1 | — |
| — | 43 | 1.1 | 2.1 | 1.0 | |
| — | 27 | — | — | 0.4 | |
| 13-236 | — | — | 0.7 | 0.1 | 0.8 |
| — | 3.5 | 1.4 | 1.6 | 0.1 | |
| 57 | 34 | — | — | — | |
| 12-2113 | 34 | 4 | — | — | — |
| 2 | 36 | — | 1 | — | |
| 9 | 16 | — | — | 1 | |
| 13-157 | 22 | 2 | 4 | — | — |
| 3 | 30 | 2 | 5 | — | |
| 5 | 2 | — | — | 24 | |
| 13-52 | — | 3 | 3 | 3 | — |
| — | 16 | — | 5 | — | |
| 66 | 7 | — | — | — | |
| 91-155 | 40 | 3 | 3 | — | — |
| 7 | 29 | — | 13 | — | |
| — | 1 | 5 | — | 5 | |
| 54-1547 | 66 | 1 | 4 | 2 | — |
| — | 16 | — | 1 | 3 | |
| 6 | 5 | — | — | 4 | |
| 91-506 | 62 | — | — | — | — |
| — | 21 | — | — | — | |
| 4 | 3 | — | — | 5 | |
| 12-1617 | 4 | 6 | 3 | 2 | — |
| 4 | 49 | — | 5 | — | |
| 13 | — | — | — | 17 | |
| 13-1250 | 21 | — | 3 | — | — |
| 6 | 31 | 2 | 5 | — | |
| 2 | 30 | — | — | 1 | |
| 21392541 | 24 | — | — | — | — |
| — | 38 | — | 3 | — | |
| 20 | 10 | — | — | 2 | |
| 21392570 | 2 | 2 | 3 | — | — |
| 11 | 6 | — | 12 | — | |
| 55 | 1 | 3 | — | 6 | |
| 21393104 | 47 | 0.1 | 3.2 | 0.2 | — |
| — | 44 | — | 3.0 | 1.3 | |
| 0.1 | 4 | — | — | 0.3 | |
| 21-998 | — | — | 0.7 | 0.6 | 0.4 |
| 0.1 | — | — | — | — | |
| — | 91 | 5 | — | — | |
| 21395813 | — | — | 3 | — | 6 |
| 18 | 17 | 1 | 12 | 2 | |
| 21 | 3 | 11 | — | 5 | |
| 93-720 | — | — | 0.5 | — | — |
| 7 | 35 | 1.8 | — | — | |
| 31 | 20 | — | — | 6.3 | |
| 21402192 | — | — | — | — | 0.6 |
| — | 1 | — | 4 | 0.5 | |
| 1 | 91 | — | — | 1 | |
| 23-570 | — | 5 | 6 | 4 | 7 |
| — | 65 | 3 | 4 | 2 | |
| 1 | 3 | — | — | 1 | |
| 23-162 | 41 | — | 3 | 2 | — |
| — | 39 | — | 1 | — | |
| 10 | 3 | — | — | 1 | |
| 23-798 | 19 | — | 1.3 | — | — |
| — | 13 | 2 | 2 | — | |
| 52 | 9 | — | — | 2 | |
| NGC 7160 | |||||
| 01-1152 | 1 | 4 | 2 | — | — |
| 3 | 49 | 4 | 5 | — | |
| 4 | 13 | 7 | — | 16 | |
| 01-580 | 43 | 11 | 3 | 2 | — |
| 3 | 16 | 2 | — | — | |
| 5 | 6 | 1 | — | 7 | |
| DG-481 | 8 | — | — | — | — |
| 14 | — | 2 | 3 | — | |
| 8 | 56 | — | — | 7 |
Note. — Silicate fit for the objects in Cep OB2 using the Two Layer Temperature Distribution method (J09) in the short wavelength range (7-14m). Only those objects with enough S/N to significantly constrain the dust mineralogy are listed here. The values are percentages in mass fraction. If no value is given for a certain species/size, it means that it is present at 2% level or less.
| Name | 0.1m A.Ol. | 0.1m A.Py. | 0.1m Fors. | 0.1m Enst. | 0.1m Sil. |
|---|---|---|---|---|---|
| 1.5m A.Ol. | 1.5m A.Py. | 1.5m Fors. | 1.5m Enst. | 1.5m Sil. | |
| 6.0m A.Ol. | 6.0m A.Py. | 6.0m Fors. | — | 6.0m Sil. | |
| Tr 37 | |||||
| 11-2146 | 6 | 10 | 3 | — | — |
| 49 | 7 | 2 | 2 | — | |
| — | 25 | 7 | — | 2 | |
| CCDM+5734 | — | 19 | 5 | — | — |
| 61 | 11 | — | — | — | |
| — | 2 | — | — | — | |
| 82-272 | — | 54 | 8 | 2 | — |
| 11 | 18 | — | — | — | |
| 3 | 2 | 2 | — | — | |
| 13-277 | — | — | — | — | — |
| 62 | 18 | — | — | — | |
| 18 | — | — | — | 1 | |
| 21393104 | 47 | — | 3 | — | — |
| — | 44 | — | 3 | — | |
| — | 4 | — | — | — | |
| 93-720 | 42 | 20 | 3 | — | — |
| 26 | 3 | — | — | — | |
| — | 3 | — | — | 1 |
Note. — Silicate fit for the objects in CepOB2 using the Two Layer Temperature Distribution method (J09) in the long wavelength range (17-35m). Only objects with good S/N in this region are presented. The values are percentages in mass fraction. If no value is given for a certain species/size, it means that it is present at 2% level or less.
| Name | Size (am.) / m | Size (cryst.) / m | Cryst.Fract. | Forst/Enst | Comments |
|---|---|---|---|---|---|
| Tr 37 | |||||
| 73-758 | 4.6 | 0.8 | 4 | 2 | TDn |
| 73-472 | 1.7 | 0.7 | 5 | 1 | TDa, Low S/N |
| 73-311 | 4.7 | 0.6 | 3 | 0.2 | |
| 73-71 | 4.9 | 3.2 | 8 | 1.0 | |
| 21362507 | 4.3 | 1.5 | 7 | 3 | |
| 11-2146 | 3.6 | 1.1 | 4 | 0.7 | Variable Ṁ, Continuum uncertain |
| 11-2037 | 3 | 1.0 | 12 | 0.5 | |
| 14-125 | 5.5 | 1.1 | 5 | 0.2 | |
| 11-2031 | 3.0 | 1.2 | 10 | 9 | Variable Ṁ |
| 14-160 | 4.1 | 1.1 | 3 | 0.3 | |
| 14-183 | 0.4 | 0.8 | 8 | 34 | Low S/N |
| 21374275 | 5.3 | 1.0 | 5.4 | 3 | |
| 12-2519 | 6.0-2.7* | 1.3 | 9 | 1.0 | Continuum uncertain |
| 12-1091 | 3.9 | 1.0 | 11 | 0.7 | |
| 13-1238 | 5.3 | 0.9 | 14 | 0.6 | Variable Ṁ |
| 82-272 | 1.2 | 0.6 | 16 | 1.0 | Variable Ṁ |
| 13-669 | 3.8 | 1.1 | 11 | 0.7 | |
| 21380979 | 2.8 | 1.0 | 21 | 0.5 | TDa: |
| 13-1877 | 3.5 | 0.8 | 8 | 0.5 | |
| 13-277 | 2.5 | 1.0 | 5 | 1.3 | Variable Ṁ |
| 13-236 | 5.8* | 1.2 | 3.9 | 1.2 | Variable Ṁ, Continuum uncertain |
| 12-2113 | 2.3 | 0.2 | 1 | 4 | |
| 13-157 | 0.9 | 1.0 | 10 | 1 | |
| 13-52 | 5.3 | 0.7 | 10 | 0.4 | TDn |
| 91-155 | 0.8 | 1.2 | 16 | 0.3 | Low S/N |
| 54-1547 | 0.5 | 0.4 | 7 | 2 | |
| 91-506 | 0.6 | 0.5 | 5.2 | 0.8 | |
| 12-1617 | 1.5 | 0.8 | 10 | 0.5 | |
| 13-1250 | 3.1 | 1.1 | 9 | 0.8 | Variable Ṁ |
| 21392541 | 2.9 | 1.1 | 5 | 0.6 | TDa,Continuum uncertain |
| 21392570 | 5.2 | 1.3 | 18 | 0.4 | TDa: |
| 21393104 | 0.8 | 0.8 | 6.4 | 1.0 | |
| 21-998 | 6.0* | 3 | 8 | 4 | Continuum uncertain |
| 21395813 | 3.5 | 3.3 | 24 | 1 | Continuum uncertain |
| 93-720 | 4.0 | 1.2 | 2.3 | — | |
| 21402192 | 6.0-0.1* | 1.2 | 4.9 | 0.2 | TDa, Continuum uncertain |
| 23-570 | 1.5 | 0.6 | 16 | 1 | |
| 23-162 | 0.9 | 0.1+0.1* | 5 | 2 | |
| 23-798 | 4.2 | 1.1 | 5 | 1.5 | Continuum uncertain |
| NGC 7160 | |||||
| DG-481 | 4.7 | 1.1 | 7.3 | 1.3 | TD/D, Continuum uncertain |
| 01-1152 | 1.6 | 1.2 | 11 | 1.2 | TDn: |
| 01-580 | 0.9 | 0.7 | 7 | 2.3 |
Note. — Average grain sizes for amorphous and crystalline silicates and crystalline fraction (mass fraction of crystalline silicates) from the TLTD fit in the 7-14m region. Only those objects with enough S/N to significantly constrain the dust mineralogy are listed here. The colon (:) indicates uncertain values in spectra with poor S/N. Grain sizes of 0.1 or 6m indicate the presence of very small or large grains, but given that our model does not include smaller nor larger grains, the uncertainties cannot be well determined, we thus mark these objects with “*”. The comments include whether the star presents a variable accretion rate (”Variable Ṁ), whether it is an accreting or non-accreting transition disk (TDa, TDn, respectively), and whether the fitted continuum level may be uncertain as described in Section 3.3.
| Name | Size (am.) / m | Size (cryst.) / m | Cryst. | ( Forst/Enst) | Comments |
|---|---|---|---|---|---|
| Tr 37 | |||||
| 11-2146 | 2.5 | 0.8 | 5 | 1.3 | |
| CCDM+5734 | 1.3 | 0.1* | 5.1 | — | TD/D |
| 82-272 | 0.6 | 0.1+0.4* | 8.9 | 3 | |
| 13-277 | 2.3 | 0.4 | 1.0 | 2 | |
| 21393104 | 5 | 0.6 | 5 | 2 | |
| 93-720 | 0.7 | 0.4 | 4.8 | 1.3 |
Note. — Average grain sizes for amorphous and crystalline silicates and crystalline fraction (mass fraction of crystalline silicates) from the TLTD fit in the 17-35m range. Only objects with enough S/N in this region are presented. The intermediate-mass star CCDM+5734 is marked with TD/D since it is probably a transitional disk with a very large inner hole or a debris disk. The colon (:) indicates uncertain values in spectra with poor S/N. Grain sizes of 0.1m indicate the presence of very small grains, but given that our model does not include smaller grains, the uncertainties cannot be well determined, we thus mark these objects with “*”.
| Model | Prototype | Teff (K) | R∗ (R⊙) | M∗ (M⊙) | Mdisk (M⊙) | Comments |
|---|---|---|---|---|---|---|
| Normal (1) | 11-2037 | 4770. | 2.3 | 1.3 | 0.015 | Normal disk with silicates |
| Massive (2) | 13-277 | 5520. | 5.9 | 2.6 | 0.07 | Very massive, strongly accreting disk |
| Normal/Depleted (3) | 13-236 | 4900. | 2.3 | 1.6 | 0.020 | Settled disk with silicates |
| Settled/Depleted (4) | 11-1209 | 4205. | 2.9 | 1.0 | 0.012 | Settled disk with no/marginal silicates |
| Kink (5) | 13-1250 | 4470. | 2.2 | 1.3 | 0.012 | Disk with strong slope change or kink |
| Old CTTS disk(6) | 01-580 | 4470. | 1.5 | 1.2 | 0.012 | Depleted disk with strong silicate feature |
| Classical TD (7) | 24-1796 | 4060. | 1.4 | 0.9 | — | Accreting TD without silicate, strong turn-up |
| Classical TD, sil (8) | 14-11 | 3650. | 2.1 | 0.4 | 0.001 | Non-accreting TD with silicate, strong turn-up |
| Settled TD, no sil (9) | 92-393 | 3580. | 2.1 | 0.6 | 0.009 | Accreting TD without silicate, settled |
| Settled TD, sil (10) | 13-52 | 4060. | 1.5 | 0.8 | — | Non-accreting TD with silicate, settled |
Note. — Modeled disk prototypes.Temperatures use the correspondence between spectral types and Teff from Kenyon & Hartmann (1995). Spectral types, stellar radii and masses from Sicilia-Aguilar et al. (2006b, 2010).
| Name | (H-5.8) | (H-8) | (H-12) | (H-17) | (3.6-5.8) | (H-24) | (5.8-8) | (8-17) | (24-33) |
|---|---|---|---|---|---|---|---|---|---|
| 73-758 | -1.77 | -1.47 | -1.16 | -1.01 | — | -0.94 | -0.26 | -0.05 | -1.78 |
| 72-1427 | -1.81 | -1.79 | -1.38 | — | -1.93 | — | -1.71 | — | — |
| 73-472 | -1.85 | -1.98 | -1.78 | -1.81 | -2.08 | -0.95 | -2.50 | -1.45 | 0.36 |
| 73-311 | -1.50 | -1.42 | -1.21 | -1.60 | -1.05 | -1.46 | -1.10 | -2.00 | 2.79 |
| 73-71 | -1.79 | -1.84 | -1.62 | -1.47 | — | -1.32 | -2.04 | -0.68 | -1.75 |
| 72-875 | -1.95 | -1.35 | -1.25 | -0.80 | — | -0.78 | 0.99 | 0.37 | 0.42 |
| 21362507 | -1.08 | -0.88 | -0.71 | — | -1.06 | — | -0.08 | — | — |
| 21364762 | -1.33 | -1.30 | -1.76 | — | — | -0.57 | -1.19 | — | — |
| 14-141 | -1.07 | -1.08 | -1.04 | — | -1.04 | — | -1.15 | — | — |
| 11-2146 | -1.32 | -1.30 | -0.98 | -0.75 | -1.59 | -0.68 | -1.20 | 0.41 | -1.29 |
| 11-1209 | -1.91 | -1.92 | -1.74 | -1.70 | -1.45 | -1.60 | -1.95 | -1.23 | -0.22 |
| 11-2322 | -1.53 | -1.45 | -1.37 | -1.14 | -1.52 | -1.07 | -1.12 | -0.48 | -0.54 |
| 11-2037 | -1.75 | -1.58 | -1.25 | -1.06 | -1.78 | -0.90 | -0.94 | 0.05 | -1.25 |
| 14-11 | -2.14 | -2.30 | -2.08 | -1.27 | -2.44 | -1.11 | -2.91 | 0.89 | 3.13 |
| 14-125 | -1.43 | -1.33 | -1.32 | — | -1.35 | — | -0.96 | — | — |
| 11-2131 | -1.12 | -1.24 | -1.19 | -1.20 | -1.59 | -1.04 | -1.70 | -1.12 | -1.53 |
| 11-2031 | -1.31 | -1.17 | -0.90 | -0.73 | -1.46 | -0.69 | -0.62 | 0.20 | -1.77 |
| 14-160 | -1.12 | -1.00 | -0.83 | -0.65 | -1.47 | -0.60 | -0.54 | 0.09 | -0.78 |
| 14-183 | -1.52 | -1.63 | -1.53 | -1.22 | -2.08 | -1.02 | -2.05 | -0.36 | -1.40 |
| CCDM+5734 | -3.04 | -3.06 | -2.80 | -2.15 | -2.74 | -1.85 | -3.15 | -0.21 | -1.14 |
| 21374275 | -0.81 | -0.71 | -0.74 | -0.65 | -1.28 | -0.59 | -0.35 | -0.52 | -0.70 |
| 12-2519 | -1.70 | -1.55 | -1.42 | -1.32 | -1.80 | -1.20 | -0.98 | -0.84 | -1.66 |
| 12-1091 | -1.76 | -1.51 | -1.21 | -0.96 | -1.67 | -0.89 | -0.53 | 0.21 | -0.90 |
| 13-1238 | -1.51 | -1.26 | -1.12 | -0.98 | -1.26 | -0.87 | -0.25 | -0.40 | -0.21 |
| 82-272 | -1.32 | -1.33 | -1.17 | -0.92 | -1.73 | -0.71 | -1.36 | -0.05 | -1.31 |
| 13-669 | -1.60 | -1.39 | -1.25 | -1.16 | -1.40 | -1.11 | -0.59 | -0.68 | -2.10 |
| 21380979 | -1.74 | -1.54 | -1.27 | -1.09 | -1.25 | -1.03 | -0.75 | -0.15 | -0.39 |
| 54-1781 | -1.90 | -1.79 | -1.54 | -1.20 | -1.68 | -1.18 | -1.38 | 0.04 | -1.67 |
| 13-1877 | -1.42 | -1.25 | -1.01 | -0.80 | -1.31 | -0.75 | -0.61 | 0.14 | -1.80 |
| 13-277 | -0.81 | -0.69 | -0.56 | -0.48 | -1.07 | -0.51 | -0.20 | -0.04 | -1.24 |
| 13-236 | -1.46 | -1.39 | -1.35 | -1.38 | -1.57 | -1.31 | -1.10 | -1.37 | -1.61 |
| 12-2113 | -1.42 | -1.15 | -0.96 | -0.77 | -0.94 | -0.76 | -0.08 | 0.05 | -2.09 |
| 13-157 | -1.17 | -1.22 | -1.07 | -0.92 | -1.63 | -0.91 | -1.42 | -0.28 | -1.33 |
| 13-52 | -2.22 | -1.97 | -1.59 | -1.43 | -2.15 | -1.36 | -0.96 | -0.28 | -2.77 |
| 91-155 | -1.12 | -0.92 | -0.69 | -0.50 | -0.68 | -0.51 | -0.15 | 0.39 | -0.73 |
| 21384350 | -1.76 | -1.67 | -1.51 | -1.77 | -1.64 | -1.45 | -1.33 | -1.97 | -0.66 |
| 54-1547 | -1.53 | -1.48 | -1.22 | -0.88 | -1.85 | -0.74 | -1.32 | 0.38 | -0.85 |
| 91-506 | -1.73 | -1.71 | -1.46 | -1.24 | -1.81 | -1.00 | -1.61 | -0.24 | -0.84 |
| 12-1617 | -1.67 | -1.66 | -1.33 | -1.09 | -2.00 | -0.97 | -1.62 | 0.11 | -1.68 |
| 13-1250 | -1.72 | -1.51 | -1.14 | -0.76 | -1.74 | -0.76 | -0.66 | 0.82 | -1.74 |
| 21392541 | -2.12 | -1.83 | -1.52 | -1.27 | -1.87 | -1.23 | -0.69 | -0.10 | -1.13 |
| 21392570 | -1.90 | -1.73 | -1.28 | -0.99 | -2.08 | -0.85 | -1.08 | 0.59 | -0.59 |
| 21393104 | -1.63 | -1.58 | -1.31 | -1.07 | -2.09 | -0.92 | -1.38 | 0.01 | -1.15 |
| 24-515 | -2.09 | -1.98 | -1.65 | -1.42 | -1.99 | -0.97 | -1.55 | -0.24 | 0.36 |
| 21-998 | -1.77 | -1.48 | -1.42 | — | -1.50 | -1.19 | -0.33 | — | 1.36 |
| 21-33 | -1.69 | -1.58 | -1.41 | -1.26 | -1.41 | -1.33 | -1.16 | -0.57 | -1.67 |
| 92-393 | -2.00 | -1.90 | -1.72 | -1.53 | -2.06 | -1.17 | -1.50 | -0.75 | 0.96 |
| 21395813 | -1.05 | -1.23 | -1.29 | -1.33 | -1.70 | -1.28 | -1.93 | -1.56 | -1.77 |
| 93-720 | -0.97 | -0.86 | -0.71 | -0.67 | — | -0.67 | -0.41 | -0.25 | -1.54 |
| 24-1796 | -1.97 | -1.90 | -1.48 | -1.13 | -2.02 | -0.75 | -1.63 | 0.48 | -0.24 |
| 21-2006 | -1.38 | -1.18 | -1.38 | -1.04 | -1.47 | -0.93 | -0.39 | -0.76 | -0.58 |
| KUN-196 | -1.72 | -1.89 | -1.99 | -1.44 | -2.86 | -1.29 | -2.58 | -0.48 | -0.29 |
| 21402192 | -2.05 | -1.86 | -1.70 | -1.57 | -1.70 | -1.32 | -1.11 | -0.96 | -1.35 |
| 23-570 | -1.53 | -1.48 | -1.38 | -1.28 | -1.48 | -1.20 | -1.29 | -0.84 | -1.23 |
| 23-162 | -1.04 | -0.96 | -0.89 | -0.81 | -1.31 | -0.75 | -0.65 | -0.50 | -1.82 |
| 23-798 | -1.35 | -1.31 | -1.05 | -0.72 | — | -0.72 | -1.15 | 0.53 | -0.98 |
| 01-1152 | -1.87 | -1.50 | -1.31 | -1.17 | -1.04 | -1.27 | -0.07 | -0.46 | -1.36 |
| 01-580 | -1.50 | -1.59 | -1.38 | -1.13 | -1.81 | -1.05 | -1.94 | -0.15 | -0.90 |
| DG-481 | -2.02 | -1.96 | -1.80 | -1.88 | -1.82 | -1.92 | -1.72 | -1.72 | -2.75 |
Note. — SED slopes (estimated as ) used to analyze the disk structure. The slopes are calculated using preferentially the IRS data (see text), and the IRAC and/or MIPS data for wavelengths not included in the IRS range and/or in case the IRS data presented a problem for particular objects. H photometry is taken from 2MASS.
| Model | Mdisk (M⊙) | Rdisk (AU) | Grain min-max, in/out (m) | Hrdisk (Rdisk) | T (K) | Other/Comments |
|---|---|---|---|---|---|---|
| Normal (1) | 0.015 | 450 | 0.1-10000 | 0.16 | 1500 | rcrys=0.15 AU |
| Massive (2) | 0.052 | 450 | 0.1/0.1-100 | 0.2 | 1500 | rcomp=3.0 AU |
| Normal/Depleted (3A) | 0.00013 | 100 | 0.1-10000 | 0.13 | 1500 | Fits general structure |
| Normal/Depleted (3B) | 0.00013 | 100 | 0.1/0.1-10000 | 0.13 | 1500 | rcomp=0.1 AU, improves near-IR excess |
| Settled/Depleted (4) | 0.005 | 200 | 6-10000 | 0.02 | 1500 | Uniform grain composition |
| Kink (5A) | 0.02 | 150 | 0.1/0.1-100 | 0.08 | 1500 | rcomp=2.0 AU; Good for silicate |
| Kink (5B) | 0.02 | 300 | 10-10000/0.1-100 | 0.08 | 1500 | rcomp=5.0 AU; Good for general structure |
| Old CTTS disk (6) | 0.0006 | 200 | 0.1/1-10000 | 0.09 | 1500 | rcomp=2.0 AU |
| Classical TD (7) | 0.0009 | 200 | 1-10000/0.1 | 0.1 | 1500 | rcomp=5.0 AU |
| Classical TD, sil (8A) | 0.0004 | 100 | 10-10000 | 0.35 | 250 | Good for general shape, fails to produce silicate feature |
| Classical TD, sil (8B) | 0.0004 | 200 | 0.1/10-10000 | 0.05 | 150 | rcomp=6.0 AU; Probably needs a bit more dust in the hole |
| Settled TD, no sil (9) | 0.003 | 200 | 20-10000/0.1 | 0.04 | 1500 | rcomp=15.0 AU |
| Settled TD, sil (10) | 0.005 | 200 | 0.1/10-10000 | 0.03 | 1500 | rcomp=0.01 AU |
Note. — Properties of the RADMC models for the disk prototypes: disk mass and radius, maximum and minimum grain size, vertical pressure scale height at the outer disk radius (Hrdisk) in units of disk radius, inner rim temperature, and other properties (radius at which the dust composition changes [rcomp], radius below which all grains are crystalline [rcrys]). The global dependency of the vertical pressure scale height goes as Hp/RR1/7. The power law exponent of the grain distribution is always assumed to be collisional (a=-3.5), unless in the cases where a single grain population is assumed for part of the disk. The Schmidt number regulating the mixing of the two populations after the radius at which grain properties change (rcrys or rcomp) is always taken to be 2/3 (see Pavlyuchenkov & Dullemond 2007).
| Parameters | R | p | R Range | Comments |
|---|---|---|---|---|
| Peak vs. Sp.Type | -0.37 | 0.006 | -0.61 — -0.06 | Excluding A,B stars |
| Size vs. Peak | -0.57 | 910-5 | -0.77 — -0.26 | |
| Peak vs. Age | 0.21 | 0.14 | -0.11 — 0.50 | Excluding G stars or earlier |
| Ṁ vs. Peak | 0.14 | 0.46 | -0.31 — 0.54 | |
| Ṁ vs. Size | -0.10 | 0.67 | -0.59 — 0.44 | |
| (H-5.8) vs. Peak | 0.27 | 0.04 | -0.04 — 0.53 | |
| (H-8) vs. Peak | 0.28 | 0.03 | -0.02 — 0.54 | |
| (H-12) vs. Peak | 0.48 | 110-4 | 0.20 — 0.68 | |
| (H-17) vs. Peak | 0.53 | 610-5 | 0.25 — 0.72 | |
| (5.8-8) vs. Peak | 0.33 | 0.01 | 0.03 — 0.58 | |
| (8-17) vs. Peak | 0.38 | 0.005 | 0.07 — 0.63 | |
| (H-24) vs. Peak | 0.37 | 0.006 | 0.06 — 0.61 | |
| (24-33) vs. Peak | -0.41 | 0.002 | -0.64 — -0.11 | |
| (H-5.8) vs. F/E | 0.33 | 0.04 | -0.04 — 0.61 | |
| (H-8) vs. F/E | 0.27 | 0.09 | -0.10 — 0.57 | |
| (H-12) vs. F/E | 0.13 | 0.40 | -0.24 — 0.47 | |
| (H-17) vs. F/E | 0.16 | 0.33 | -0.23 — 0.51 | |
| (5.8-8) vs. F/E | -0.01 | 0.93 | -0.37 — 0.35 | |
| (8-17) vs. F/E | -0.12 | 0.45 | -0.48 — 0.26 | |
| (H-24) vs. F/E | 0.17 | 0.31 | -0.22 — 0.50 | |
| (24-33) vs. F/E | -0.11 | 0.49 | -0.46 — 0.27 |
Note. — Correlation coefficients (R) and false-alarm probability (p) for different stellar, disk, and silicate properties, including height of the normalized peak, spectral types, size of the amorphous grains, age, forsterite to enstatite ratio (F/E), and SED slope at different wavelengths ().