Testing Gravitational Lensing as the Source of Enhanced Strong MgII Absorption Towards Gamma-Ray Bursts
Abstract
Sixty percent of gamma-ray bursts (GRBs) reveal strong MgII absorbing systems, which is a factor of 2 times the rate seen along lines-of-sight to quasars. Previous studies argue that the discrepancy in the strong MgII covering factor is most likely to be the result of either quasars being obscured due to dust, or the consequence of many GRBs being strongly gravitationally lensed. We analyze observations of quasars that show strong foreground MgII absorption. We find that GRB lines of sight pass closer to bright galaxies than would be expected for random lines of sight within the impact parameter expected for strong MgII absorption. While this cannot be explained by obscuration in the GRB sample, it is a natural consequence of gravitational lensing. Upon examining the particular configurations of galaxies near a sample of GRBs with strong MgII absorption, we find several intriguing lensing candidates. Our results suggest that lensing provides a viable contribution to the observed enhancement of strong MgII absorption along lines of sight to GRBs, and we outline the future observations required to test this hypothesis conclusively.
1 Introduction
Prochter et al. (2006) pointed out that gamma-ray bursts (GRBs) show approximately four times as many MgII absorbing lines in their spectra as quasars, although the current best estimate of the excess is now a factor of 2 (Vergani et al. 2009; hereafter V09). Strong MgII absorbers (equivalent width, EW, greater than 1Å) are found towards 60% of GRBs with followed-up optical afterglows. Both being high redshift beacons, GRBs and quasars might be expected to have similar lines of sight through the cosmos, and explaining the preponderance of MgII absorbers towards GRBs has proven a challenge 111No difference between GRBs and quasars has been found for either weak MgII systems (Tejos et al., 2009) or for CIV absorption systems (Tejos et al., 2007)..
Porciani et al. (2007) considered dust obscuration, beam size differences, the intrinsic properties of GRBs, and gravitational lensing as possible causes. Beam size differences were found to be irrelevant, with simulations predicting that the absorbing systems are significantly larger than either the GRB afterglow ring or the quasar accretion disk. If the additional strong MgII absorbers are physically associated with the GRBs, one might expect the absorber properties to be distinct from the systems towards quasars. However, Cucchiara et al. (2009) found no difference between the two populations of absorbers. Ultimately, this leaves dust obscuration of quasars and gravitational lensing of GRBs as the two most plausible explanations.
If strong MgII absorbers are dusty, so that the discrepancy between GRBs and quasars is due to quasars being preferentially lost from the observed samples (GRB’s being initially selected in gamma-rays are not subject to this extinction), Porciani et al. (2007) determined that the number of MgII systems towards quasars would have to have been underestimated by a factor of 1.3-2, which they found to be unlikely (but see Budzynski & Hewett 2011). Studies of quasars have shown that the metal-enriched gas responsible for MgII absorption is broadly associated with foreground galaxies (e.g. Kacprzak et al. 2007). Thus, if dust obscures quasars with strong MgII, providing the origin of the GRB-quasar absorption system discrepancy, then the 60% of GRBs with strong MgII absorbers should represent random lines of sight within 60% of the sky nearest to foreground galaxies. However, if lensing is responsible for the discrepancy of MgII absorption between quasars and GRBs, then there should be an excess of GRBs at small separations from foreground galaxies. Therefore, the distribution of GRB-galaxy separations provides a test to distinguish between the two hypotheses.
Finding multiple images of the same source is the calling card of strong gravitational lensing. Wyithe et al. 2011 (W11) explored the possibility that gravitational lensing combined with a multi-band magnification bias (described in Wyithe et al. 2003), could lead to the large number of high equivalent width MgII absorbers for GRBs. W11 showed, if the gamma ray and optical luminosities of GRBs are uncorrelated, and if the luminosity functions have a cumulative slope with power law index , then 10%-60% of the GRBs with afterglow follow-ups should have been multiply-imaged.
The V09 sample was chosen solely on the basis of the optical afterglow’s brightness and reveals 15 strong MgII absorbers out of the 26 GRBs sample. As W11 do not predict lensed GRBs to be significantly brighter overall, we treat the V09 sample as an unbiased group of GRBs and therefore expect 10%-60% of the 26 GRBs should have been multiply-imaged. W11 also noted that, based on the sky coverage of Swift, the probability of the satellite detecting three separate doubly-imaged GRBs is only 3%. The probability that none of the V09 sample was observed to be doubly-imaged, even if lensing does occur, was found to be 50%.
If GRBs are frequently strongly lensed, they open up a potentially powerful probe of galaxies and the cosmos. Time delay and magnification measurements, as done with quasar lenses, become possible with exquisite precision, allowing accurate mass models and distance measurements to be made to an ever increasing sample of objects.
In this paper, we investigate the possibility that gravitational lensing is affecting a significant fraction of GRBs with optical counterpart. For consistency with the W11 analysis, we study archival Hubble Space Telescope (HST) observations of the galaxies near the lines of sight towards each of the GRBs in the V09 sample, and estimate the probability that the GRB was strongly lensed. In section 2, we describe the data used and our data reduction procedures. In section 3, we study the probability of finding nearby galaxies towards GRBs with strong MgII absorbers vs. a random line of sight. In section 4, we outline the lensing analysis methods and properties of the model employed, and present our results for the individual GRBs. We discuss our conclusions in section 5. Throughout this paper we assume a cosmology of , and =72 km/s/Mpc.
2 Data
In order to consistently test the W11 hypothesis, we analyze the same 26-GRB sample from V09, from which their model is based. As we are searching for galaxies with small impact parameters, we require high spatial resolution, which is best obtained with HST. In the few cases where HST data are not available, we use data from 8-m class telescopes. Due to the relatively poor angular resolution of the VLT and Gemini imaging data, a null detection in these cases does not rule out lensing. These data are taken as a part of our statistics only when a possible lensing galaxy is observed.
Calibrated HST images available from the archive, taken with the STIS and ACS instruments, were combined in python by way of the STSDAS/Multidrizzle package222http://www.stsci.edu/hst/HSToverview/documents/multidrizzle. VLT ISAAC, FORS1 and FORS2 images were similarly reduced using the relevant pipeline within the gasgano333http://www.eso.org/sci/software/gasgano/ software package. Version 1.9 of the Gemini IRAF package444http://www.gemini.edu/sciops/ was employed in reducing data from Gemini’s GMOS instrument (Hook et al., 2004). After stacking all images from each filter and constructing deep images from our reduced data, nearby galaxies () were located using SExtractor (Bertin & Arnouts, 1996). The impact parameter between these galaxies and their partner GRBs was subsequently measured.
In total, we have deep images of 11 objects with strong MgII absorbers from the sample of V09 (representing 75% of the 15 GRBs with strong MgII absorbers). Since the HST observations were not made on the basis of strong MgII absorption, we believe that this is an unbiased sample for this analysis.
| GRB | Instrument | Program ID | Filter | Limiting Magnitude2210-sigma within an aperture of 0.2 square-arcseconds, observed limit for each combined image. | Galaxy Separations (33Galaxy ID number when an image is provided within this paper) | GRB redshift | Strong MgII 44Taken from V09 | |
|---|---|---|---|---|---|---|---|---|
| (AB mag) | (arcsec) | redshift | ||||||
| 020405 | HST/WFPC2 | HST 9180 | F702W | 23.8 | 2.6 (1) | 21.7 0.3 | 0.695 | 0.472 |
| 030429 | VLT/FORS2 | VLT 71.D-0355 | R_BESS | 22.05510-sigma for a point source | 1.2 | 22.7 0.166Jakobsson et al. 2004 | 2.66 | 0.814 |
| 021004 | HST/ACS | HST 9405 | F606W | 26.1 | 1.4 (4) | 26.8 0.4 | 2.33 | 1.3800, 1.6026 |
| 1.8 (3) | 26.8 0.4 | |||||||
| 3.2 (5) | 26.5 0.4 | |||||||
| 3.7 (2) | 26.1 0.3 | |||||||
| 4.3 (1) | 25.9 0.3 | |||||||
| 010222 | HST/WFPC2 | HST 8867 | F606W | 22.4 | 3.6 (3) | 25.7 1.0 | 1.477 | 0.927, 1.156 |
| 3.9 (4) | 25.0 0.7 | |||||||
| 4.0 (11) | 23.1 0.3 | |||||||
| 060206 | HST/WFC | HST 10817 | F814W | 23.9 | 0.9 (1) | 26.4 0.5 | 4.048 | 2.26 |
| 2.4 (2) | 24.8 0.2 | |||||||
| 060418 | HST/ACS | HST 10551 | F775W | 25.5 | 1.1 (3) | 24.2 0.2 | 1.49 | 0.6026, 0.6559, 1.1070 |
| 1.5 (2) | 25.2 0.3 | |||||||
| 3.5 (1) | 22.5 0.1 | |||||||
| 050820A | HST/ACS | HST 10551 | F625W | 25.4 | 3.3 | 24.7 0.2 | 2.615 | 0.9615, 1.4288 |
| 3.5 | 26.5 0.5 | |||||||
| 080319B | HST/WFPC2 | HST 11513 | F606W | 24.4 | 1.7 | 25.1 0.7 | 0.9378 | 0.7154 |
| 2.6 | 24.9 0.6 | |||||||
| 4.0 | 25.0 0.7 | |||||||
| 991216 | HST/STIS | HST 8189 | Clear | 26.1 | 0.4 | 24.5 0.3 | 1.022 | 0.770, 0.803 |
| 2.4 | 23.7 0.2 | |||||||
| 020813 | HST/ACS | HST 9405 | F606W | 26.7 | 2.3 | 24.1 0.1 | 1.255 | 1.224 |
| 4.0 | 24.1 0.2 | |||||||
| 050908 | HST/ACS | HST 11734 | F775W | 26.1 | 1.0 | 26.6 0.6 | 3.55 | 1.548 |
| 2.8 | 25.7 0.4 | |||||||
| 3.7 | 25.7 0.4 |
3 Galaxy Proximity to GRB Lines-of-Sight
Chen et al. (2009) noted the consistent presence of galaxies at small angular separations from a sample of four GRBs showing strong MgII absorbers, and the absence of such galaxies near three GRBs without them. Such a correspondence is not surprising since the MgII absorption is thought to arise from material associated with galaxies. Our analysis takes this approach further by roughly tripling the sample size, and by comparing MgII lines of sight to the more robust baseline of a distribution constructed from random lines of sight.
According to V09, 60% of all GRBs have a strong MgII absorbing system (Å). Using the galaxy catalog of Coe et al. (2006) for the Hubble Ultra Deep Field (UDF; Beckwith et al. 2006), we measure the radius around every galaxy brighter than a given magnitude which, together, would give 60% sky coverage using a top hat function; we denote this radius as . This top-hat model represents the most extreme concentration possible for MgII absorption along random lines of sight, and thus is the most stringent comparison for the observed impact parameter distribution. It may not, however, be an unrealistic model, as Chen et al. (2010) used quasar sight-lines to measure a high MgII covering fraction within a certain (luminosity-dependent) galaxy radius, and found that the covering fraction fell sharply at larger radii.
If GRBs are randomly distributed, one would expect the 60% of GRBs which have MgII absorption to have a random distribution of separations from galaxies within the radius . However, if the cause for the discrepancy between GRBs and quasars is due to gravitational lensing, we would expect the distribution of galaxies around GRBs with strong MgII lines to be more concentrated towards small radii. In the framework of our UDF analysis, the value of in any filter is a function of only the limiting magnitude used to constrain the galaxy catalog.
3.1 Distribution of separations to nearby galaxies
We use a Monte Carlo approach to generate random lines of sight through the UDF, and measure the distances to the nearby galaxies in the Coe et al. catalog. We adopt a limiting magnitude for the catalog galaxies of 27.5 mag (AB) in each filter, since this corresponds to the faintest nearby galaxy in the GRB images. Running 10,000 realizations in each of the four UDF filters, we then weight the relative contributions from each filter to match the filter distribution for the GRB images (using only the filter that gives the deepest stacked image for each GRB in the analysis, and taking the UDF filter most similar to that used with the GRB).
Our statistical analysis does not distinguish between galaxies that lie in front of the GRBs and those behind. As long as the galaxy number counts continue to rise at the faint end (a condition satisfied for F775W=27.5 mag [Fig. 29 of Coe et al. 2006], as well as for the other UDF filters), the consequence of our blindness to the galaxy redshifts is to add spurious objects to our analysis for both the GRBs and the random lines of sight. This will weaken the signature of lensing by galaxies at small impact parameters by mixing in unrelated background objects and reducing the difference in the cumulative radial distributions. If MgII absorption is related to galaxies that are typically fainter than any of our images, then we would expect the spatial distribution of galaxies to be the same for the GRBs and the random lines of sight. Bornancini et al. (2004) and Campisi et al. (2009) found that long-GRB host galaxies populate lower density regions than average, and we therefore do not expect a bias due to galaxies at the redshift of the GRB.
A Kolmogorov-Smirnov (K-S) two-sample test rejects the hypothesis of the GRB data being drawn from the random distribution, but only at confidence when using a limiting magnitude of 27.5; because we would not expect the entire population to be lensed, but rather a few very unusual cases, it is not surprising that this treatment is inconclusive.
3.2 Probabilities of nearest bright galaxy
Assuming that lensing is caused by the nearest galaxy, we perform a test to compare the probability of the 11 different alignments between the GRB and its nearest galaxy. This time, we find the probability of each event happening when comparing to a line of sight near a galaxy with the same apparent brightness as our GRB host. While, as mentioned above, GRB host galaxies are not likely to reside within a cluster, this is done to account for any improbable clustering, and falsely identifying galaxies that are associated with the GRB redshift itself.
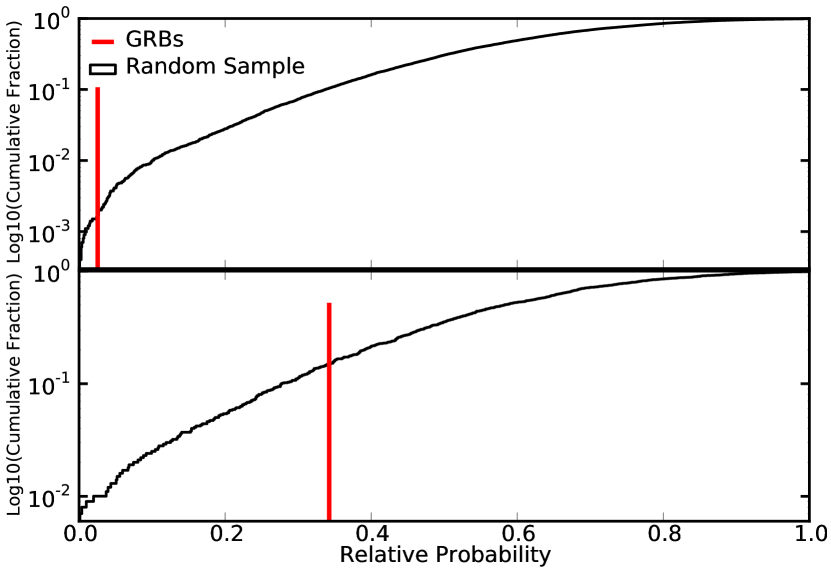
After randomly choosing a galaxy from the UDF with similar apparent magnitude as the actual GRB host (0.5 mags), we measure the magnitude of and distance from it to the nearest galaxy (up to a specific limiting magnitude). For GRBs without known host galaxies we use a random line of sight. The probability of finding a closer and/or nearer galaxy is calculated and the probabilities of the 11 alignments are multiplied together to form one probability for the ensamble. It is important to note that only alignments with a galaxy within are counted (as we assume those galaxies are the cause for the strong MgII absorption). In figure 1, the histogram of the multiplied probabilities is plotted (for limiting magnitude of 27.5 in V band). The red line represents the probability of the GRBs alignments. We find the probability of having a set of alignments as close and as bright as the observed sample of 11 GRBs is only 0.2% (upper panel). To verify that random lines of sight are representative of the GRB population without strong MgII absorption, we compare the random lines of sight result to that of 9 GRBs without MgII absorption which have publicly available HST observations (060526, 061201, 070721B, 060313, 050730, 050419A, 050525, 060614 and 060729). The probability of finding the alignments from these 9 GRBs to their nearest galaxy is 78%, confirming that our MC routine is adequate.
As we remove our probable candidates for strong lensing and possibly magnified GRBs from the analysis (see §4), we expect the alignments to be similar to our expectation from a random line of sight. Therefore, we test the outcome when ignoring the most likely candidates GRB020405, GRB030429 and GRB991216. The same simulation now finds the alignment probability of the 8 remaining GRBs to be 15% (lower panel). As the distribution appears to have a log-normal shape, P=0.15 is just within 1 standard deviation of the mean (P=0.5) for a random line of sight. Following the statistical approach of V09, we find that the absorber density per unit redshift () changes from to when removing GRBs 020405, 030429 and 010222. When comparing to the QSO result of (Nestor et al., 2005), the significance of the MgII discrepancy is reduced by one sigma. However, GRBs are not found to completely agree with the absorbers distributions in QSO, implying another process (e.g. dust obscuration) must be involved.
In order to test the effect of the limiting magnitude, we repeat the analysis for limiting magnitudes in the range 27.0 - 28.5. The brighter limit is chosen to match the faintest nearby galaxy observed for the GRBs, and the fainter is chosen as a highly conservative limiting magnitude for our images (we do not have such deep images, however a fainter limiting magnitude will make smaller, which makes it less likely to find a galaxy as bright or as close as the nearest galaxies to the GRBs). The results for the probability of the 11 GRBs happening range from 0.1-0.4% (and for ignoring the likely cases range from 12-16%), suggesting that our analysis is not highly sensitive to the limiting magnitude. This confirms that GRBs have brighter, closer galaxies than expected if the 60% of GRBs with MgII represent random lines of sight within the 60% of the sky closest to foreground galaxies. This is as expected under the gravitational lensing hypothesis.
To verify our results are not highly dependent on cosmic variance, we perform another test. Taking the extreme case (galaxies with ) for the UDF from Moster et al. (2011), we assume 30% variance within the whole UDF field. In a Monte-Carlo simulation we increase the number of galaxies in the field drawing from a gaussian with a mean taken from the size of the UDF catalog and 30% variance. Each extra galaxy is randomly placed in the field and is given a magnitude which is randomly drawn from the UDF magnitude distribution. Repeating the process above we find the probability of the 11 GRBs having their alignments with their nearest galaxy to increase to only 3%. We therefore conclude that our results are not particularly sensitive to cosmic variance.
4 Gravitational Lensing Models of individual GRBs
We showed above that GRBs with strong MgII absorbers include outliers with improbable small separations from foreground galaxies. We therefore conclude that lensing is a likely cause of the MgII absorber excess since it is consistent with such an alignment, whereas obscuration of quasars is not. Armed with this motivation, we investigate the individual cases to look for potential lenses. In this section we proceed under the assumption that the galaxy proximity is related to gravitational lensing of the GRBs and conduct detailed studies of the lensing likelihood for each GRB in the V09 sample.
It is important to note that like our statistical analysis, the examination of lensing for individual GRBs may be confused by the presence of galaxies lying behind the GRB in question. While we can use the UDF redshift catalog of Coe et al. (2006) to constrain the likely distances to some of our galaxies based on their SEDs, determination of the actual redshifts can only be accomplished by future observations.
We determine the properties of all potential lensing galaxies using the methods of Tucker et al. (2012a,b in prep). In summary, galaxy spectral energy distribution (SED) templates are created from the UV to Infrared using 11 galaxies that cover a complete range of morphological types (Calzetti et al., 1994, 1996; Kinney et al., 1996; Mannucci et al., 2001). We reproduce the range of observed galaxies via linear combinations of all SEDs, and find all acceptable fits to the observed photometry using a statistic. From the range of acceptable SEDs, we calculate rest-frame magnitudes and the -weighted galaxy classification when data in several bands is available.
In the few cases where we identified the galaxy as a spiral and could estimate MB, we use the Tully-Fisher relation (Miller et al., 2011) to approximate the rotational velocity of stars in the lensing galaxy. In order to convert from the rotational velocity to velocity dispersion, we divide by (Binney & Tremaine, 1987). Incorporating the angular impact parameter, the estimated velocity dispersion, and the known absorber redshifts into a singular isothermal sphere (SIS) model, we use the observational and model uncertainties to calculate the probability of magnification and of the lens producing two images of the GRB.
We use the GRAVLENS/LENSMODEL software (Keeton, 2001) to model the complex systems (i.e., those with multiple lensing galaxies). The software allows one to specify the locations of the source (GRB), lenses, and images of the source (including time delay, when applicable), to constrain possible mass profiles of the lenses. The output includes the image magnifications and time delays (when not provided), and the critical curve of the lenses in the image plane. In the few cases where more than one galaxy is observed near the GRB and where none of the galaxies is obviously associated with the absorbing system (via a spectroscopic redshift for the galaxy or extreme close proximity to the GRB), we model them as a group where each galaxy is associated with a Singular Isothermal Ellipse (SIE) with shear. Where there is only one nearby galaxy, and no other observational constrains, such as a second image, we assume a Singular Isothermal Sphere (SIS) mass profile for the lensing galaxy. This model predicts multiple images where the impact parameter, , is smaller than twice a galaxy’s Einstein radius, , which is defined as
| (1) |
Here is the line-of-sight velocity dispersion of the galaxy (which could be constrained from the TF analysis described above), and and are the angular diameter distances between the lens and the source, and the observer and the source, respectively (Schneider et al., 1999). In addition to lensing geometry, the model also provides information regarding intensity magnification and time delay between images. In the simplest case of a single lensing galaxy, the first image is further from the center-of-mass of the lens and is brighter than the second image, making it more likely to be detected. More complex lensing systems are not bound by such constraints, but still make predictions about magnifications and time delays.
Although MgII absorbers and intervening galaxies are correlated for quasar sight-lines, the relation between the impact parameter and the MgII equivalent width is not a tight one (Churchill et al., 2005), making the task of identifying the right absorber for each system not straight-forward. As we normally lack the data to verify the nearby galaxies’ redshifts, we implement a statistical test to understand the likelihood of a nearby galaxy being at the absorber’s redshift. Again using the UDF galaxy catalog of Coe et al. (2006), we perform a Monte-Carlo simulation that measures the probability of having a galaxy with a given apparent magnitude within a known distance from a random line of sight. This allows us to estimate the chances of finding galaxies near a GRB.
Hereafter, we analyze the possibility of strong gravitational lensing for each of our GRBs, in descending order of multiple-lensing likelihood.
4.1 Candidates of Multiply Imaged GRBs
4.1.1 GRB020405
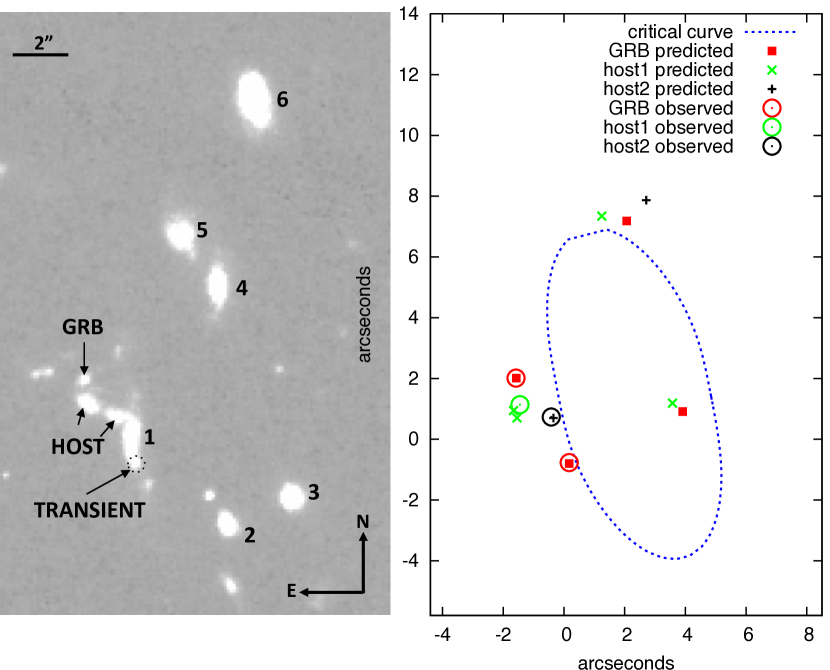
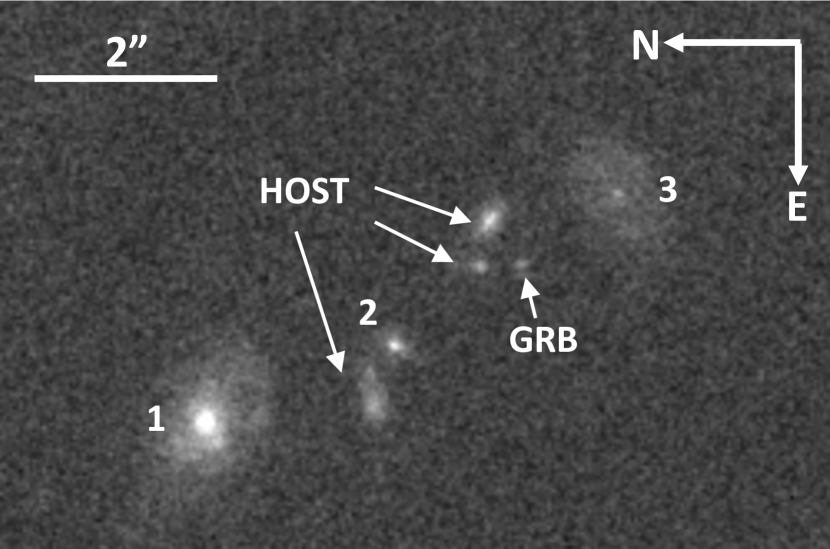
HST images of this GRB (z=0.695) revealed another transient object away, as noted by Masetti et al. (2003). A VLT spectrum confirmed that both the nearest galaxy and one other (objects 1 and 2, respectively, in Figure 2) are at the redshift of the z=0.472 MgII absorbing system. The second transient is visible along the edge of galaxy 1. Objects 3,4,5 and 6 are nearby galaxies which we speculate below could possibly be part of a group at the absorber redshift.
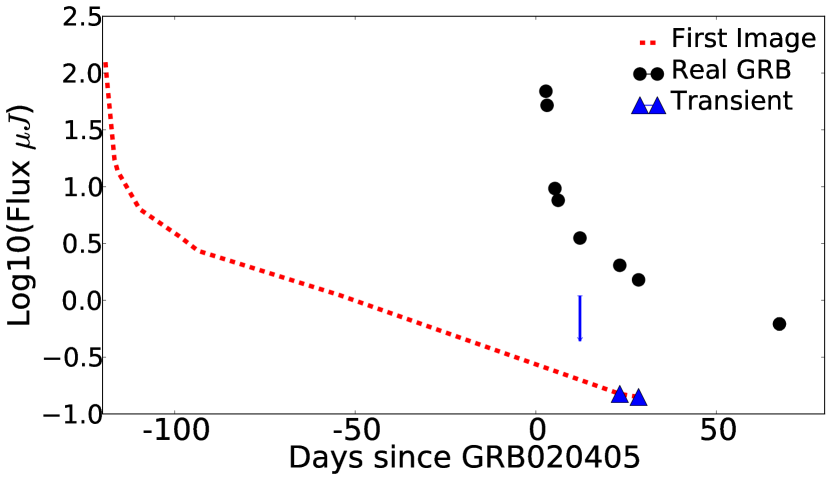
The second transient was observed in the first observation of HST, 23 days after the GRB trigger, and was fainter than the GRB at all times. With only few data points for this transient, it is consistent (within errors) with the expected colour evolution of the GRB. While we cannot dismiss the possibility of the second transient being a non-related field SN, we expect the probability of finding an object 3 away from any redshift galaxy is low. Modelling this system with LENSMODEL, we are able to explain the unknown transient as an earlier, brighter image of the GRB (Rapoport et al. in prep). The model assumes galaxies 1-6 are a group at the MgII absorption redshift. We assume the galaxies lie in common dark matter envelop and use a Singular Isothermal Ellipse (SIE) mass profile with shear. While the time delays, positions of images and their magnification are highly sensitive to the model, possible solutions include a time difference between the images of 120 days, with the first GRB image being 1.8 times brighter. One such model is shown in figure 2. The transient (i.e., first GRB image) would not have been detected in optical at the time of the original GRB020405 observations, as the resolution and depth required to separate the transient from the nearby galaxy were not achieved by the ground-based facilities used in the first few weeks after the gamma-ray trigger. Figure 3 shows the GRB observations in I band in black and the predicted flux for the first image in red (1.8 times brighter). The blue points are the observed fluxes of the second transient from the HST images and the upper limit was found by subtracting the last HST observation from the VLT I band image. (The earlier epochs for GRB020405 were obtained with smaller telescopes, and provide no additional constraints on the light curve of the second transient.). We are pursuing further observations to verify the redshift of the galaxies in the field. The model predicts several less-magnified images of the host complex, which do not conflict with current observations. In addition, some models suggest there were even earlier images of the GRB (on the right of Fig. 2), which occurred years before. It is not possible to explain the second transient as a GRB image if the nearby galaxies are not at the absorbers redshift. Phot-Z analysis, using the EASY software (Brammer et al., 2008), of the possible group members shows consistency for the galaxy redshifts, but with large uncertainty.
4.1.2 GRB030429
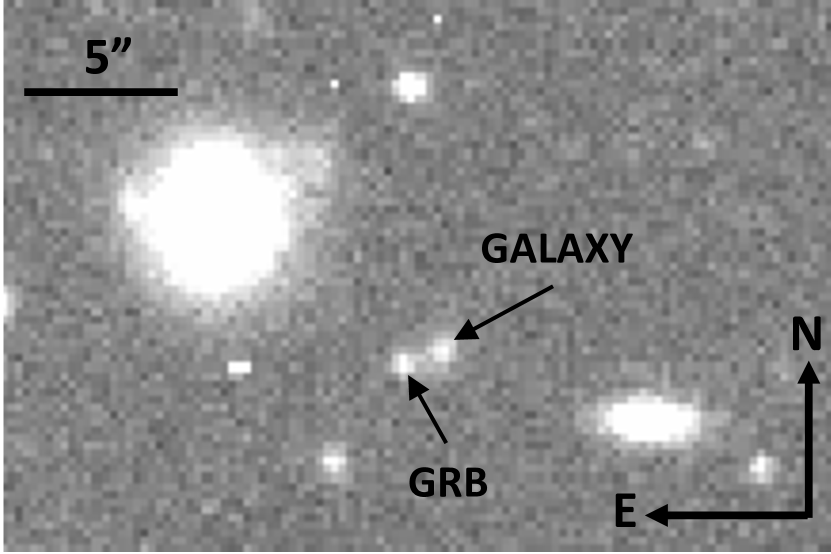
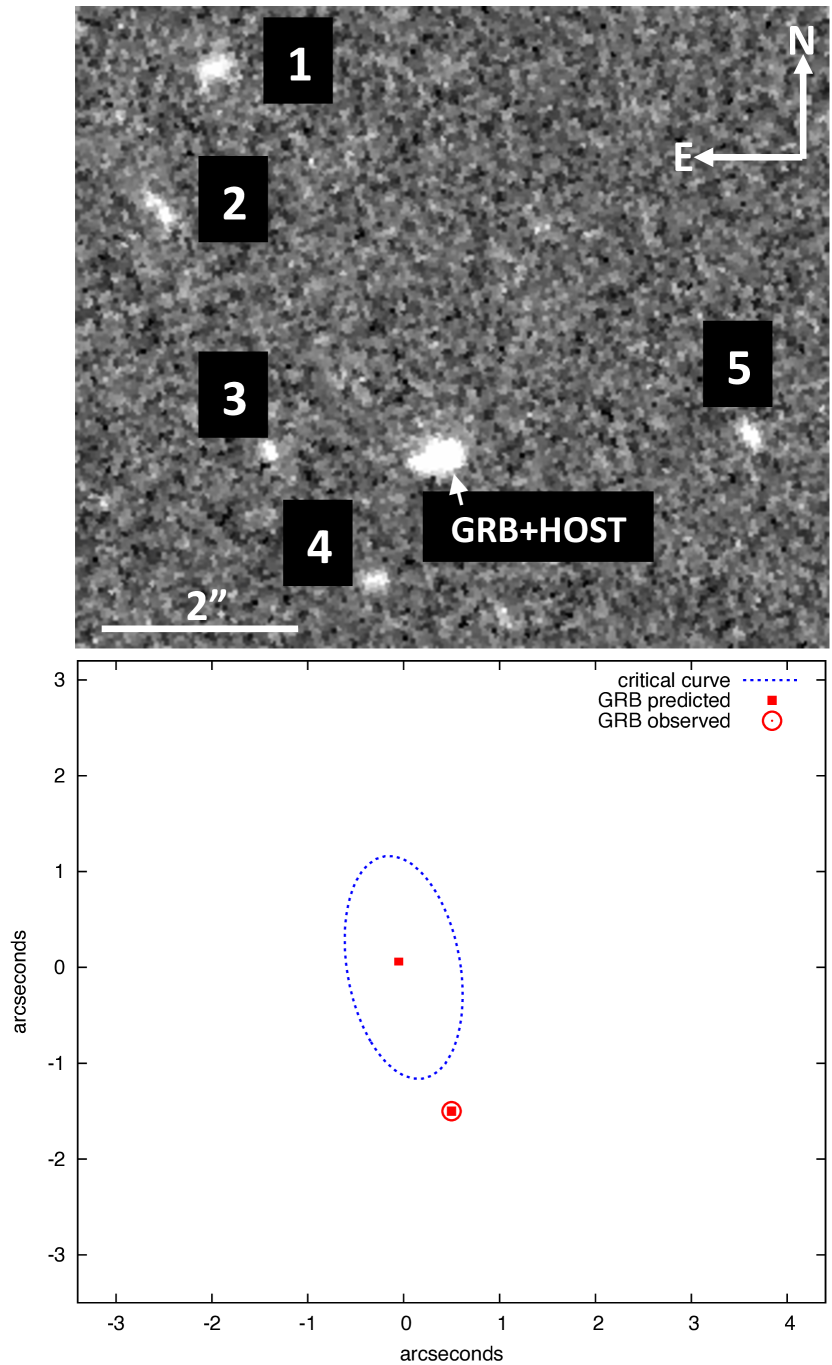
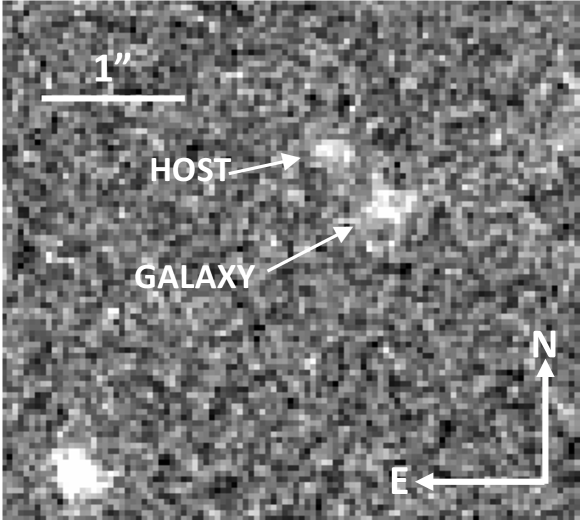
The impact parameter between the GRB030429 and the nearby galaxy is 1.2′′ (figure 4), and the redshift of the galaxy was confirmed by Jakobsson et al. (2004) to be that of the absorbing MgII system. Moreover, at a redshift of 2.66 with an absorbing system at a redshift of 0.8418, the angular diameter distance ratio is approximately 0.54. As gravitational lensing is most efficient when the angular size distance of the source as seen by the lens equals the angular size distance between the lens and the observer, GRB030429 represents a likely candidate for being lensed.
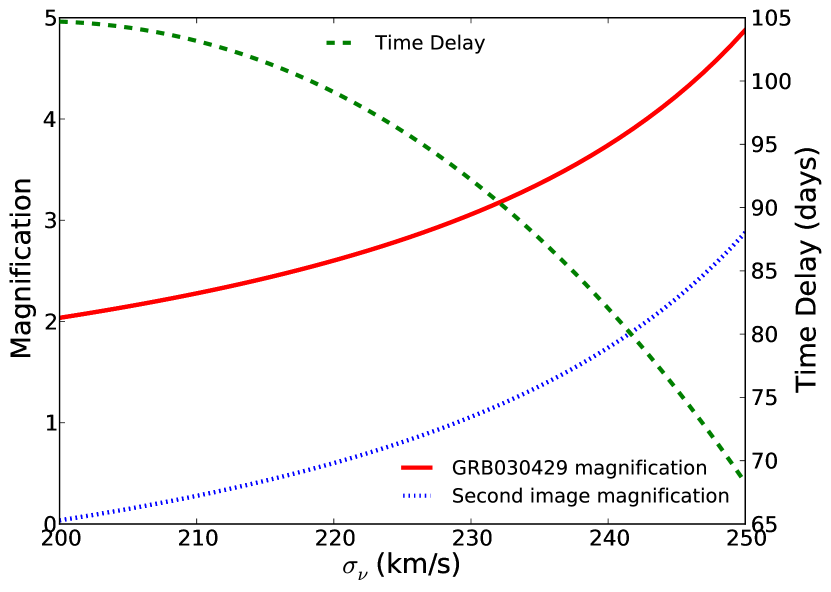
Our Monte-Carlo simulation with the UDF finds the probability of having a galaxy with the observed magnitude within along a random line of sight to be 0.4%. For the lines of sight towards our 11 GRBs, the chances of randomly finding one such alignment is 14%. Using the magnitudes of the galaxy given by Jakobsson et al. (2004), our SED fitting techniques imply . The TF relation for such an intrinsically bright galaxy suggests a velocity dispersion of km/s which corresponds to arcseconds. With a separation of 1.2 arcsec, the SIS model predicts a second image for this GRB only if km/s. Since lensing would select out those galaxies with the highest , the TF relationship is useful to show plausibility in this case. Because the Einstein radius for this system needs to be for multiple imaging, the impact parameter of the observed GRB means it was likely the first of two images if lensed. Figure 5 shows the expected magnifications of the GRB and the predicted second image, and the time delay between the two. The last observation of this GRB was taken with the VLT 67 days after the trigger, which would have been too soon for detecting the second image, assuming km/s. No late X-ray observations were taken. In order to test this being a lensing system, direct measurements of the velocity dispersion or galaxy mass are needed.
4.2 Possible Candidates of Multiply Imaged GRBs
4.2.1 GRB021004
While there is no exceptionally bright galaxy near this GRB, there are five faint galaxies within which could be a part of a group (Fig. 6). At a redshift of 2.33, this GRB had 2 strong absorbing systems at redshifts 1.38 and 1.60.
Fynbo et al. (2005) studied the colors of the neighboring galaxies and found the host galaxy to be different from its surrounding. As gravitational lensing does not alter the color of objects, this suggests that none of the other galaxies is a second image of the host. Therefore, if modeling the group as an SIE and for the case of a double image, the detected GRB must have been the first, brighter one, and the second image of the host galaxy must not be strongly magnified. Using the GRAVLENS software we construct a possible model of the group, having a common dark matter envelope which can be approximated as a SIE. The model predicts multiple images, with the second being too faint to detect the host. The center of mass of the group model appears towards the more dense part of the group, as expected. Since the time delay between the images is 550 days, we would not expect to observe 2 images of the GRB at the same time. Unfortunately, the HST observations stopped 53 days after the trigger, which is less than the expected delay time for this model. The host galaxy observations taken a year later would have still been to early. Although this GRB had a bright optical afterglow, with a relative demagnification of a factor of 25, the window of possible detection is fairly narrow (several days).
Redshift confirmation for the galaxies is required to verify this is indeed a bona fide group. In such a case, deeper images might reveal other background sources and possibly multiple images of the host. Phot-z analysis using the HST images finds galaxies 1-5 to be consistent with the absorber’s redshift within errors.
4.2.2 GRB010222
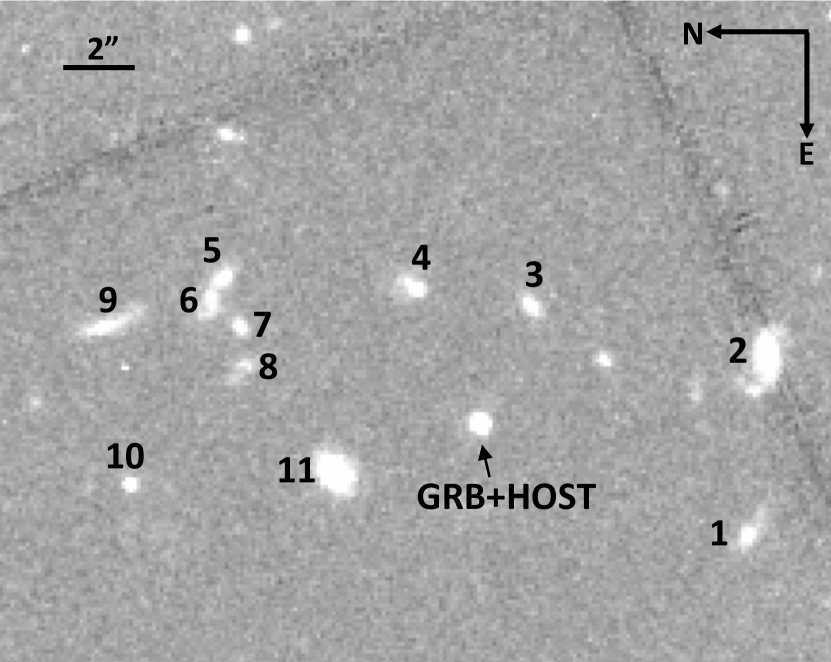
A strong MgII absorbing system was found at a redshift of 0.927 for this z=1.477 GRB. While there was no single bright, close galaxy, HST images show a crowded region with at least 11 clearly identified galaxies which could, again, be a part of a group (Fig. 7). To produce a second image, the velocity dispersion of the group would need to be 250 km/s for a group centered 0.5′′ from the GRB, 350 km/s for 1′′ between the GRB and group center, or 500 km/s for 2′′.
Here again, one would need to confirm the galaxies are at the absorber redshift as the first step to concluding that this group lensed the GRB. As the SNR of these galaxies is low and the clumpiness of some making it difficult to measure accurate photometry, we performs a phot-z analysis on galaxies 1-4,9-11. The results, whilst carrying large errors are consistent with the galaxies being at the absorber’s redshift.
4.2.3 GRB060206
At a redshift of 4.048, GRB060206 exhibits 2 strong absorbing systems at redshifts 2.26 and 1.48. An HST image reveals 2 galaxies near the observed host (see Fig. 8), at distances of 0.96′′ for galaxy 1 and for galaxy 2. The probability of finding an alignment of two such galaxies along a random line of sight is 3%, or a 29% chance of being observed in the 11 GRBs. The field was also observed with GMOS r’ on Gemini North (GN-2007A-Q-88), and galaxy 2 was detected with a magnitude 23.90.1 (Thone et al., 2008). Using the color information for galaxy 2, we fit an SED model and estimate it could be a small starburst galaxy at either absorber redshift, with -16.35 (-17.46) for z=1.48 (2.26). Galaxy 2 would have to have a velocity dispersion larger than 325 km/s to create 2 images of this GRB. Since we do not expect such velocities from a small starburst galaxy, we do not consider the galaxy further.
With galaxy 1 only observed with one filter, it is impossible to determine the galaxy type. Galaxy 1 would require an Einstein radius of to lens the GRB, which is equivalent to 200 (275) km/s at redshift 1.48 (2.26). A second image of the GRB host would not necessarily be observed due to the small separation from the lensing galaxy and the usual de-magnification of the second image relative to the first image. Further photometry is required for constraining the model of the galaxy and determining its lensing feasibility.
4.3 Unlikely Candidates of Multiply Imaged GRBs
4.3.1 GRB060418
This GRB at z=1.49, with 3 strong absorbing systems at z=0.603, 0.656, and 1.107, was well studied by Pollack et al. (2009), who identified a complicated host and 3 adjacent galaxies (figure 9). In their paper, they identify galaxy 1 as that responsible for the absorbing system at z=0.656, as its redshift was confirmed with observed emission lines. Object 2 was assumed to be the z=1.107 absorber and object 3 the z=0.603 absorber due to their angular sizes. However, none of these later identifications were confirmed via spectroscopy. Recently, Chen (2011) studied the nearby galaxies and was able to spectroscoply confirm the redshift of what is now identified as the host complex in figure 9.
Due to the relatively large distance between the GRB and the probable absorbers, we find lensing to be unlikely.
4.3.2 GRB050820A
In their paper, Chen et al. (2009) study this GRB at z=2.615 and its strong absorbing systems at z=0.6915 and 1.4288. They identify 2 compact objects at separations of 1.3′′ and 0.4′′ from the GRB. In spectra taken lately by Chen (2011), the objects were found to be a part of the GRB host. Therefore, we conclude that this GRB was not strongly lensed.
4.3.3 GRB080319B
This GRB at a redshift of 0.9378, with one strong MgII intervening system at z=0.7154 and 3 other weak systems, has 3 nearby galaxies. Finding 3 galaxies within is unlikely, with the mean number of galaxies predicted to be 1.2, with a standard deviation of 0.45. However, the faintness of the galaxies makes it impossible to find a model which allows lensing. Although these data were taken with only 2 filters, we were able to fit an SED model which found them to be faint early type galaxies, with (assuming z=0.7154). Therefore, even if the galaxies are in the absorber’s redshift and not background galaxies, they could not be massive enough to cause strong lensing.
4.3.4 GRB991216
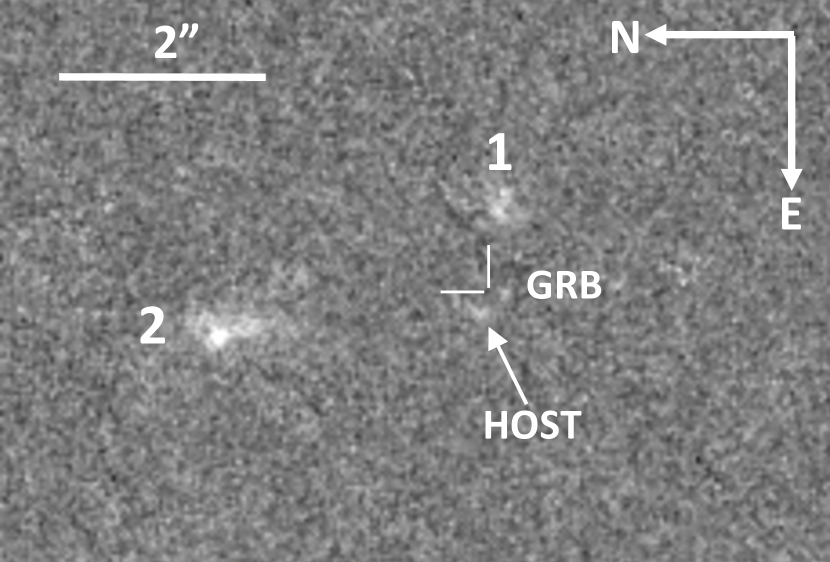
A faint (R24.5) irregular galaxy555http://www.stsci.edu/fruchter/GRB/991216/index.html lies to the South of this GRB. The GRB redshift was 1.022 and the intervening systems were at 0.77 and 0.803. This configuration requires that nearby galaxy to have a velocity dispersion of at least 190 km/s, which is unlikely for a relatively faint irregular galaxy. However, the proximity implies that even a velocity dispersion of 70km/s would imply 15% magnification. Therefore, while not doubly lensed, this GRB (and its host) are likely to be magnified if the nearby galaxy is at the absorber’s redshift.
4.3.5 GRB020813
At a redshift of 1.255 this GRB shows a strong MgII absorber at a redshift of 1.224. The ratio of is 58 which suggests that strong lensing is highly unlikely. The nearby bright galaxy at a distance of 2.4′′ away would require km/s, which is unphysical.
4.3.6 GRB050908
This GRB at z=3.55 with a strong MgII absorbing system at z= 1.548, reveals a faint (F775W26.6 mag) galaxy away. This alignment would require the galaxy to have a velocity dispersion larger than 230 km/s. HST observations with different filters are required to model the SED of this galaxy and conclude if this high velocity dispersion is feasible.
5 Discussion and Conclusions
There is a well known excess of strong MgII absorbers towards GRBs compared to quasar lines of sight. The most viable explanations for this discrepancy are gravitational lensing of the GRB population, and dust extinction of the population of quasars with strong absorbers. In this paper we have identified a new difference between GRBs and random lines of sight. We find that GRBs with strong MgII absorbers are found closer to bright galaxies when compared with random lines of sight that are restricted to the 60% of sky nearest to foreground galaxies (corresponding to the fraction of GRBs with strong MgII absorption). This new property of the GRB population cannot be explained by quasar extinction. On the other hand such a concentration of GRBs around foreground galaxies is a natural consequence of gravitational lensing. We therefore argue that strong gravitational lensing is likely to be playing a role in explaining the discrepancy between MgII absorbers towards GRBs and quasars. Porciani et al. also found that GRBs with MgII absorbing systems were slightly brighter (a factor of 1.7) than those without, implying again that gravitational lensing could explain the phenomenon, provided the GRB luminosity function was sufficiently steep.
W11 predicted that 10%-60% of the 26 GRBs in the V09 sample should have been multiply imaged if lensing is the explanation for the enhanced MgII absorption towards GRBs relative to quasars. Assuming that the GRBs with strong MgII systems (EWÅ) are the only ones which are multiply-imaged, we would expect 1.9 - 11 of the 11 GRBs studied to be strongly gravitationally lensed. If none of our sample were plausibly gravitationally lensed, then this would effectively rule out the gravitational lensing hypothesis.
Quasars are observed to show strong lensing 0.1% of the time, and we expect, if the GRB and quasar samples are similarly distributed, no GRBs in our sample to be lensed. It is important to note that the W11 model predicts a lensing rate of less than 1% for both GRBs selected only in gamma-rays and for quasars. Thus, even the null detection of multiple imaging in the 2700 GRBs observed by the BATSE instrument, which could see a much larger fraction of the sky than Swift at any given time, is not surprising (see Porciani & Madau 2001).
Our analysis reveals a high frequency of galaxies near GRB sight-lines, with 2 suspected two-image systems (GRB020405 and GRB030429), 2 possible galaxies groups that would result in multiple images (GRB021004 and GRB010222), and several other less probable candidates. Since only the two most likely candidates have spectroscopic confirmation that the nearby galaxy lies at the absorber’s redshift, more data are needed to confirm the strong gravitational lensing hypothesis. ñThis study, while not conclusively demonstrating lensing, is consistent with what would be expected from the model of W11. If, as described by Wyithe et al., the cumulative luminosity function of the optical afterglow follows a power law of the form , where is the afterglow luminosity, then our study indicates a value of or steeper.
Recently, Budzynski & Hewett (2011) studied the correlation between quasars, MgII absorbers and extinction, and found strong dependence of E(BV) on the absorber’s equivalent width. Modeling the observed difference between GRBs and quasars, they find dust obscuration to be a significant factor in the MgII discrepancy at high equivalent width. However, they acknowledge that it is unlikely to be the only effect, and that the full explanation involves more than one process. Our analysis compares the galaxy over-density towards GRBs relative to a random line of sight and so is independent from comparisons to other objects (e.g., quasars or blazars; see Bergeron et al. 2011). Therefore, both lensing and dust could be of significance for solving the MgII problem.
Searching for galaxies near the lines of sight toward quasars with strong MgII absorption would require detailed modeling and subtraction of the quasar point spread function, which is beyond the scope of this paper. The virtue of the GRB follow-up is the fading of the point source, which affords a straight-forward assessment of the surrounding sky. If follow-up studies of the most probable lenses do not unambiguously rule in or out lensing, then a future direction could include applying a similar analysis to a quasars sample. However, in order to best test the gravitational lensing model, what is needed is a real time study. Once an appropriate candidate is identified, deep high-resolution images should follow, to search for the possible lensing system. If one is found, lensing models should be applied to predict if a second image is expected. If so, the location and time delay of the next image can be measured. Depending on the error expected in the time delay, which is proportional to , an appropriate observational cadence can be put into action. Since the second image is the inner one for the simple SIS/SIE models, it is likely to suffer from stronger extinction by the lensing galaxy. Moreover, the rapid fading in optical and the smaller magnification of the second image compared to the first one might require frequent observations in order to catch the second image while it is observable. Therefore, we suggest conducting the search in X-rays, which are less affected by passing through a galaxy.
The preferential lensing of GRBs would herald a shift in the study of both gravitational lenses and GRBs. Prior knowledge of where and when a GRB image will appear should allow coordinated observations from earth and space to be scheduled, leading to unprecedented multi-wavelength data. Such information would be of great assistance in understanding progenitor and outflow properties. Moreover, accurate measurements of the time delays between lensed images would constrain cosmological models and inform studies of the dark matter distribution associated with the lensing galaxy.
We hope that the conclusions drawn in this work will stimulate the search for lensed GRBs (perhaps identified by their strong MgII absorbers), and the associated tertiary images.
Acknowledgements
We thank Jeremy Mould, John Kormendy and Stuart Sim for helpful conversations and the anonymous referee for constructive comments. BPS acknowledges financial support through ARC Laureate Fellowship Grant FL0992131.
Based on observations made with the European Southern Observatory telescopes obtained from the ESO/ST-ECF Science Archive Facility.
Some of the data presented in this paper were obtained from the Multimission Archive at the Space Telescope Science Institute (MAST). STScI is operated by the Association of Universities for Research in Astronomy, Inc., under NASA contract NAS5-26555. Support for MAST for non-HST data is provided by the NASA Office of Space Science via grant NNX09AF08G and by other grants and contracts.
Based on observations obtained at the Gemini Observatory (acquired through the Gemini Science Archive), which is operated by the Association of Universities for Research in Astronomy, Inc., under a cooperative agreement with the NSF on behalf of the Gemini partnership: the National Science Foundation (United States), the Science and Technology Facilities Council (United Kingdom), the National Research Council (Canada), CONICYT (Chile), the Australian Research Council (Australia), Ministério da Ciência e Tecnologia (Brazil) and Ministerio de Ciencia, Tecnología e Innovación Productiva (Argentina).
References
- Beckwith et al. (2006) Beckwith, S. V. W. et al. 2006, AJ, 132, 1729
- Bergeron et al. (2011) Bergeron, J., Boissé, P., & Ménard, B. 2011, A&A, 525, A51+
- Bertin & Arnouts (1996) Bertin, E., & Arnouts, S. 1996, A&A, 117, 393
- Binney & Tremaine (1987) Binney, J., & Tremaine, S. 1987, Galactic dynamics (Princeton University Press), 230
- Bornancini et al. (2004) Bornancini, C. G., Martínez, H. J., Lambas, D. G., Le Floc’h, E., Mirabel, I. F., & Minniti, D. 2004, ApJ, 614, 84
- Brammer et al. (2008) Brammer, G. B., van Dokkum, P. G., & Coppi, P. 2008, ApJ, 686, 1503, 0807.1533
- Budzynski & Hewett (2011) Budzynski, J. M., & Hewett, P. C. 2011, ArXiv, 1106.0692
- Calzetti et al. (1994) Calzetti, D., Kinney, A. L., & Storchi-Bergmann, T. 1994, ApJ, 429, 582
- Calzetti et al. (1996) ——. 1996, ApJ, 458, 132
- Campisi et al. (2009) Campisi, M. A., De Lucia, G., Li, L.-X., Mao, S., & Kang, X. 2009, MNRAS, 400, 1613
- Chen (2011) Chen, H.-W. 2011, ArXiv, 1110.0487
- Chen et al. (2010) Chen, H.-W., Helsby, J. E., Gauthier, J.-R., Shectman, S. A., Thompson, I. B., & Tinker, J. L. 2010, ApJ, 714, 1521
- Chen et al. (2009) Chen, H.-W. et al. 2009, ApJ, 691, 152
- Churchill et al. (2005) Churchill, C. W., Kacprzak, G. G., & Steidel, C. C. 2005, in IAU Colloq. 199: Probing Galaxies through Quasar Absorption Lines, ed. P. Williams, C.-G. Shu, & B. Menard, 24–41
- Coe et al. (2006) Coe, D., Benítez, N., Sánchez, S. F., Jee, M., Bouwens, R., & Ford, H. 2006, AJ, 132, 926
- Cucchiara et al. (2009) Cucchiara, A., Jones, T., Charlton, J. C., Fox, D. B., Einsig, D., & Narayanan, A. 2009, ApJ, 697, 345
- Fynbo et al. (2005) Fynbo, J. P. U. et al. 2005, ApJ, 633, 317
- Hook et al. (2004) Hook, I. M., Jørgensen, I., Allington-Smith, J. R., Davies, R. L., Metcalfe, N., Murowinski, R. G., & Crampton, D. 2004, PASP, 116, 425
- Jakobsson et al. (2004) Jakobsson, P. et al. 2004, A&A, 427, 785
- Kacprzak et al. (2007) Kacprzak, G. G., Churchill, C. W., Steidel, C. C., Murphy, M. T., & Evans, J. L. 2007, ApJ, 662, 909
- Keeton (2001) Keeton, C. R. 2001, ArXiv, 0102340
- Kinney et al. (1996) Kinney, A. L., Calzetti, D., Bohlin, R. C., McQuade, K., Storchi-Bergmann, T., & Schmitt, H. R. 1996, ApJ, 467, 38
- Mannucci et al. (2001) Mannucci, F., Basile, F., Poggianti, B. M., Cimatti, A., Daddi, E., Pozzetti, L., & Vanzi, L. 2001, MNRAS, 326, 745
- Masetti et al. (2003) Masetti et al. 2003, A&A, 404, 465
- Miller et al. (2011) Miller, S. H., Bundy, K., Sullivan, M., Ellis, R. S., & Treu, T. 2011, ArXiv, 1102.3911
- Moster et al. (2011) Moster, B. P., Somerville, R. S., Newman, J. A., & Rix, H.-W. 2011, ApJ, 731, 113
- Nestor et al. (2005) Nestor, D. B., Turnshek, D. A., & Rao, S. M. 2005, ApJ, 628, 637
- Pollack et al. (2009) Pollack, L. K., Chen, H.-W., Prochaska, J. X., & Bloom, J. S. 2009, ApJ, 701, 1605
- Porciani & Madau (2001) Porciani, C., & Madau, P. 2001, ApJ, 548, 522
- Porciani et al. (2007) Porciani, C., Viel, M., & Lilly, S. J. 2007, ApJ, 659, 218
- Prochter et al. (2006) Prochter, G. E. et al. 2006, ApJ, 648, L93
- Schneider et al. (1999) Schneider, P., Ehlers, J., & Falco, E. E. 1999, Gravitational Lenses (Berlin: Springer)
- Tejos et al. (2009) Tejos, N., Lopez, S., Prochaska, J. X., Bloom, J. S., Chen, H.-W., Dessauges-Zavadsky, M., & Maureira, M. J. 2009, ApJ, 706, 1309
- Tejos et al. (2007) Tejos, N., Lopez, S., Prochaska, J. X., Chen, H.-W., & Dessauges-Zavadsky, M. 2007, ApJ, 671, 622
- Thone et al. (2008) Thone, C. C. et al. 2008, A&A, 489, 37
- Vergani et al. (2009) Vergani, S. D., Petitjean, P., Ledoux, C., Vreeswijk, P., Smette, A., & Meurs, E. J. A. 2009, Astronomy & Astrophysics, 503, 771
- Wyithe et al. (2011) Wyithe, J. S. B., Oh, S. P., & Pindor, B. 2011, MNRAS, 414, 209
- Wyithe et al. (2003) Wyithe, J. S. B., Winn, J. N., & Rusin, D. 2003, ApJ, 583, 58