The Galactic Oosterhoff Dichotomy in terms of
Period-Color Relations at Maximum/Minimum
Light
Abstract
The Galactic Oosterhoff dichotomy between Galactic globular clusters of type I (OoI) and type II (OoII) is often characterized by a difference in the period-amplitude (PA) relations displayed by RR Lyrae ab stars in each type of cluster. Classical examples of OoI and OoII are M3 and M15 respectively. Here we use multicolor data for the these two clusters to demonstrate how period-color (PC) relations at maximum band light are also different in OoI and OoII clusters.
I Introduction
Fundamental mode RRab stars in Galactic globular clusters of type I and type II have an average period of about 0.55 and 0.65 days respectively. This is the standard way of characterizing the Galactic Oosterhoff dichotomy. Another approach (see Cacciari et al (2005) and references therein) looks at PA relations. RRab stars in OoI clusters like M3 have very different PA relations when compared to RRab stars in OoII clusters like M15.
The data in this paper are taken from Benko et al (2006) and from Corwin et al (2008). We used a value of E(V-I) of 0.0128 and 0.128 for M3 and M15 respectively. Because of the high quality of these data, we fit a relatively high oder Fourier fit and used the subsequent Fourier expansion to estimate light curve minimum, maximum and mean.
In Figure 1, we clearly see two different PA relations for the two clusters. Moreover, there are a group of stars in M3 which follow the PA relation for M15. One possible explanation for this is that OoII clusters are more evolved than OoI clusters and those stars in M3 which follow the M15 relation are also more evolved.
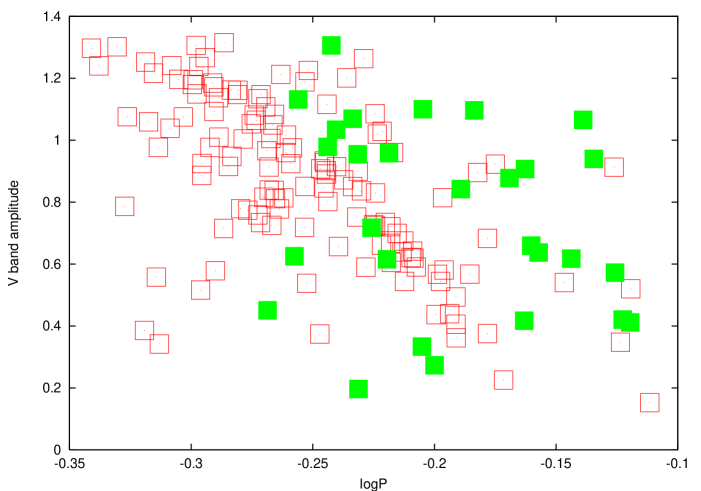
II Period-Color Relations at Maximum Light
We use our Fourier fits to construct colors at maximum, minimum and mean band light. That is we rephase our data so that maximum band light occurs at phase 0. Then the band curve is rephased accordingly. Figure 2 represents a plot of log Period against color at maximum band light, corrected for extinction as specified above.
We clearly see two well separated sequences for M3 and M15. The same M3 stars which lie on the M15 PA relation in Figure 1 also lie on the M15 PC maximum light relation in Figure 2.

III Period-Color Relations at Mean and Minimum Light
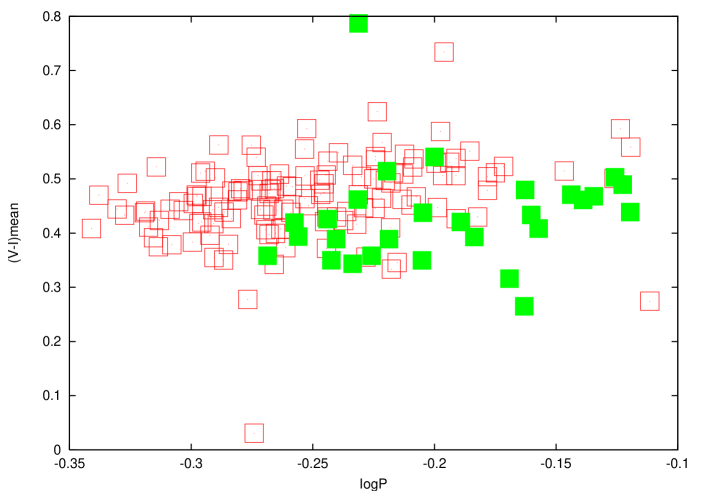
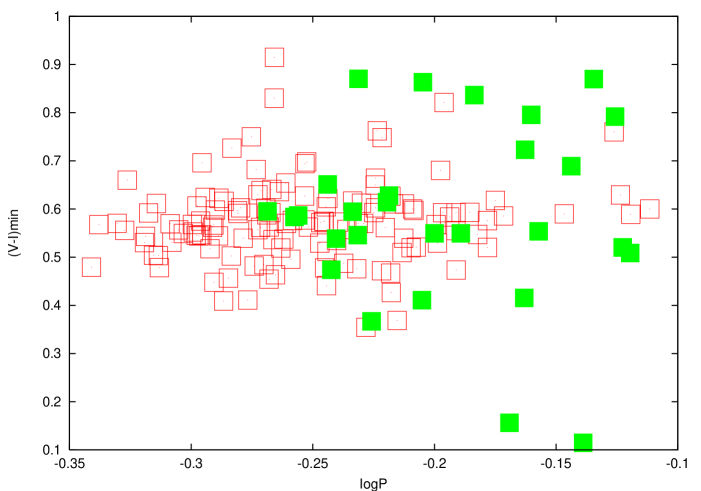
Figures 3 and 4 display PC relations at mean and minimum light respectively. Figure 3 clearly has lost the separation between the two types of clusters demonstrated in Figures 1 and 2. Figure 4 shows a flat PC relation at minimum light for both types of clusters.
IV Discussion
Figures 1 and 2 suggest that the Galactic Oosterhoff dichotomy can be recast in terms of PC relations at maximum light. Further, the PC relations at maximum light also show evidence of a quadratic nature as has been suggested for the PA relations (Cacciari et al 2005). One reason why casting the Oosterhoff dichotomy in terms of PC relations at maximum light is that there is some theoretical work which can provide a possible framework within which to understand the differences in PC relations at maximum light in terms of an evolutionary context (Kanbur and Phillips 1996).
This separation starts to disappear at mean light and reverts to the flat PC relation at minimum light (Kanbur 1995). These data suggest that there is no difference in the flat PC relation at minimum light between OoI and OoII clusters.
One caveat is that data from more Galactic globular clusters are needed to further test these hypotheses. The analysis of such observations is currently under way.
References
- (1) Benko, J. M., Bakos, G. A., Nuspl, J., 2006, MNRAS, 372, 1657
- (2) Cacciari, C., Corwin, T. M., Carney, B. W., 2005, AJ, 129, 267
- (3) Corwin, T., Borissova, J., Stetson, P., Catelan, M., Smith, H., Kurtev, R., & Stephens, A., 2008, AJ, 135, 1459
- (4) Kanbur, S.M., 1995, A&A 297L, 91
- (5) Kanbur, S. M. & Phillips, P., 1996, A&A, 314, 514
- (6) Stetson, P., 2008 (private communication)