Study of galaxies in the Lynx-Cancer void. – III. New extreme LSB dwarf galaxies
Abstract
We present the results of the complex study of the low surface brightness dwarf (LSBD) gas-rich galaxies J0723+3621, J0737+4724 and J0852+1350, which reside in the nearby Lynx-Cancer void. Their ratios (Hi)/, according to Hi data obtained with the Nançay Radio Telescope (NRT), are respectively 3.9, 2, 2.6. For the two latter galaxies, we derived oxygen abundance corresponding to the value of 12+(O/H)7.3, using spectra from the Russian 6m telescope (BTA) and from the Sloan Digital Sky Survey (SDSS) database. We found two additional blue LSB dwarfs, J0723+3622 and J0852+1351, which appear to be physical companions of J0723+3621 and J0852+1350 situated at the projected distances of 12–13 kpc. The companion relative velocities, derived from the BTA spectra, are = +89 km s-1 and +30 km s-1 respectively. The geometry and the relative orientation of orbits and spins in these pairs indicate, respectively, prograde and polar encounters for J0723+3621 and J0852+1350. The NRT Hi profiles of J0723+3621 and J0723+3622 indicate a sizable gas flow in this system. The SDSS images of the five dwarfs are used to derive the photometric parameters and the exponential or Sersic disc model fits. For three of them, the colours of the outer parts, being compared with the PEGASE evolutionary tracks, evidence for the dominance of the old stellar populations with ages of (8–10)3 Gyr. For J0723+3622 and J0737+4724, the outer region colours appear rather blue, implying the ages of the oldest visible stars of T1–3 Gyr. The new LSB galaxies complement the list of the known most metal-poor and ‘unevolved’ dwarfs in this void, including DDO 68, SDSS J0812+4836, SDSS J0926+3343 and SAO 0822+3545. This unique concentration of ’unevolved’ dwarf galaxies in a small cell of the nearby Universe implies a physical relationship between the slow galaxy evolution and the void-type global environment. We also compare the baryonic content of these LSBDs with predictions of the most updated cosmological simulations.
keywords:
galaxies: dwarf – galaxies: ISM – galaxies: abundances – galaxies: photometry – galaxies: evolution – cosmology: large-scale structure of Universe1 INTRODUCTION
Voids in the large-scale distribution of matter are defined observationally as large regions devoid of luminous (L L∗) massive galaxies. Dwarf galaxies in voids can have significantly different star formation (SF) and chemical enrichment histories from those of galaxies in denser environments (see, e.g., Peebles, 2001; Gottlöber et al., 2003; Hoeft et al., 2006; Arkhipova et al., 2007; Hahn et al., 2007, 2009, and references therein). To address the effect of voids on evolution of the lowest mass dwarf galaxies, we compiled a sample of 80 late-type galaxies in one of the nearest voids, the Lynx-Cancer void (Paper I – Pustilnik & Tepliakova, 2011).
Due to the void’s relative proximity ( 18 Mpc), galaxies in this volume selected for the SDSS spectroscopy, have the absolute magnitudes as low as . Galaxies residing in the Lynx-Cancer void (as well as those in other voids), are mostly dwarfs (95%, Paper I). There exists the well known correlation between galaxy luminosities and their central surface brightnesses (SB) (e.g., Cross & Driver, 2002, and references therein). The deeper one probes the void galaxy population, the higher fraction of LSB galaxies one expects. However, the severe observational selection effects prevents a good completeness sample of the low-luminosity LSB galaxies.
In the SDSS, a relatively high surface brightness cut-off has been used to select the spectroscopic targets. Namely, the completeness of the SDSS galaxy samples with the measured redshifts falls below 50% for objects with the half-light 23.5 mag arcsec-2 (e.g., Blanton et al., 2005; Geha et al., 2006). This limit for the purely exponential face-on discs, roughly corresponds to the observed value of the central SB in -band – 23.2 mag arcsec-2 (Paper I). Hence, the resulting SDSS galaxy samples with known redshifts are biased against the LSB galaxies in the nearby Metagalaxy. The apparent brightening due to the inclination effect and the presence of extra light related to the SF regions (or bulges), will somewhat diminish the loss of galaxies with 24 mag arcsec-2. However, for galaxies with 24 mag arcsec-2, the SDSS selection criterion should lead to the substantial loss of LSB dwarf galaxies in the void galaxy samples. Here the indexes and correspond to the Galaxy foreground extinction and the inclination corrected values. Some of these missing galaxies might form the youngest local galaxy population (Zackrisson, Bergvall & Östlin, 2005).
The LSB galaxies are believed to evolve slower than the brighter counterparts with similar masses. This occurs due to their lower surface mass density and the larger stabilisations effect of their DM halos that suppress the internal perturbations and the related gas collapse and SF process. Their properties are also related to the higher specific angular momentum (Dalcanton, Spergel & Summers, 1997). In turn, as cosmological simulations show, the primordial halos with the higher specific angular momentum collapse late and their baryonic gas can form LSBGs with substantial delays. Furthermore, the same properties of LSBGs can eliminate the effect of collisions and tidal perturbations, significantly reducing the induced SF in comparison to the processes in the similar high-SB galaxies (e.g., Mihos, McGaugh & de Block, 1997). On the other hand, O’Neil, Bothun & Schombert (1998) suggested that the blue colours of the LSB dwarfs can be understood as a result of starbursts triggered by distant/weak tidal encounters. Similarly, Schombert et al. (2001) argued that the blue colours of LSBGs are related to the weak SF bursts, caused by encounters have occurred during the last five Gyr.
In order to better disentangle various effects of galaxy interactions, one needs to know how the isolated galaxies evolve. The study of isolated galaxies became rather popular especially in the last years, e.g., AMIGA project (http://amiga.iaa.es/p/1-amiga-home.htm), by the creation of new samples of isolated galaxies - the Local Orphan Galaxies sample (Karachentsev et al., 2011), 2MIG sample (Karachentseva et al., 2010) and the multiwavelength study of the sample of the most isolated galaxies in the more distant voids (van de Weygaert et al., 2011; Kreckel et al., 2011). Also, since galaxies are complex systems, the separating of the most extreme (‘purified’ from the confusing factors) galaxies, in which one finds the simplest physical and dynamical conditions, helps to confront the numerical simulations of physical processes in galaxies with the real objects and to verify the model assumptions.
In this context, the very gas-rich and very metal-poor LSB galaxies residing in voids, can appear to be the simplest objects for the understanding and modelling of their dynamics, star formation and evolution. The understanding of various aspects of their lives can be the good baseline for the analysis of more complicated cases and might give the keys for the insights into a more common aggregates and with a more complex structure (in respect of the baryon component mix, spiral waves and bars, etc). Is the very rarefied environment, characteristic of voids, important for the LSBG evolution? Can we find any significant difference in the evolutionary status between the LSB dwarfs residing in voids and in groups and/or in the general field?
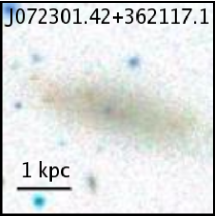
During the systematic study of the dwarf galaxies in the Lynx-Cancer void, we have already discovered several unusual objects, including the almost completed merger in the very metal-poor galaxy DDO 68 (Pustilnik et al., 2005; Izotov & Thuan, 2007; , Pustilnik et al.2008a), the interacting pair of the blue compact dwarf (BCD) HS 0822+3542 and the LSB dwarf SAO 0822+3545 (Kniazev et al., 2000; Pustilnik et al., 2003; Chengalur et al., 2006), and the very LSB dwarf SDSS J0926+3343 (Pustilnik et al., 2010). In this paper we present the study of three more the Lynx-Cancer void genuine LSB gas-rich dwarfs. The galaxies SDSS J073728.47+472432.8 and SDSS J085233.75+135028.3 (hereafter J0737+4724 and J0852+1350) had originally their redshifts in the SDSS database, while the galaxy SDSS J072301.42+362117.1 (hereafter J0723+3621) does not. The latter has been identified as a Lynx-Cancer void dwarf with the SAO RAS 6m telescope (BTA) during the snap-shot observations dedicated to the search for LSBDs in this void. We also present the radial velocity measurements (obtained with the BTA) and the SDSS-based photometry of the two faint SDSS blue dwarf galaxies, which are located at the projected distances of 2′ and 2.6′ from the studied void LSBDs. For one of them we also discuss the NRT Hi data.
The paper is organised as follows. In Sec. 2 we describe the observations, the SDSS data and the data reduction. Sec. 3 presents the results of observations and their analysis. In Sec. 4 we discuss the results and their implications in the broader context, comparing properties of the presented galaxies with those of more common galaxy samples, and summarise our conclusions.
2 OBSERVATIONS AND DATA REDUCTION
2.1 NRT Hi observations
The H i-observations with the
Nançay111
The Nançay Radioastronomy Station is part of the
Observatoire de Paris and is operated by the Ministère de l’Education
Nationale and Institut des Sciences de l’Univers of the Centre National
de la Recherche Scientifique.
radio telescope (NRT) with a collecting area of 20034.5 m2 are
characterised by a half-power beam width (HPBW) of
3.7′ (East-West)22′ (North-South) at
declination =0° (see also http/www.obspm-nancay.fr/en).
The data were acquired during July 2009 - October 2010, with the total time
on-source of 4 hours for J0737+4724, 3 hours - for J0852+1350,
J0723+3621 and J0723+3622. We used the antenna/receiver system F.O.R.T.
(Foyer Optimise pour le Radio Telescope) (e.g., Martin et al., 2002) with the
improved overall sensitivity.
The system temperature was 35 K for both the horizontal and vertical
linear polarisations of a dual-polarisation receiver.
The gain of the telescope was 1.5 K Jy-1 at declination =0°.
The 8192-channel correlator was used covering a total bandwidth of 12.5 MHz.
The total velocity range covered
was about 2700 km s-1, with the channel spacing of 1.3 km s-1 before smoothing.
The observations consisted of separate cycles of ‘ON’ and ‘OFF’ integrations,
each of 40 seconds in duration. ‘OFF’ integrations were acquired at the
target declination, with the East R.A. offset of
15′ cos().
For more detail see the description in Pustilnik & Martin (2007).
The data were reduced using the NRT standard programs NAPS and SIR, written by the telescope staff (see description on http://www.nrt.obspm.fr). Horizontal and vertical polarisation spectra were calibrated and processed independently and then averaged together. The error estimates were calculated following to Schneider et al. (1986). The baselines were generally well-fit by a third order or lower polynomial and were subtracted out.
2.2 6m telescope spectral observations and SDSS spectrum
| Name | Date | Expos. | Wavelength [Å] | Dispersion | Spec.resol. | Seeing | Airmass | Grism | Detector |
|---|---|---|---|---|---|---|---|---|---|
| time [s] | [Å/pixel] | FWHM(Å) | [arcsec] | ||||||
| (1) | (2) | (3) | (4) | (5) | (6) | (7) | (8) | (9) | (10) |
| J0723+3621 | 2009.12.23 | 1600 | 2.1 | 12.0 | 2.0 | 1.13 | VPHG550G | 2K2K | |
| J0723+3621 | 2010.11.09 | 21200 | 2.1 | 12.0 | 2.0 | 1.15 | VPHG550G | 2K2K | |
| J0737+4724 | 2009.01.21 | 5900 | 0.9 | 5.5 | 1.2 | 1.12 | VPHG1200G | 2K4K | |
| J0852+1350 | 2010.11.11 | 2600 | 0.9 | 5.5 | 3.0 | 1.41 | VPHG1200R | 2K2K |
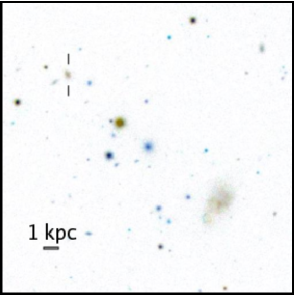
The long-slit spectral observations of galaxies J0723+3621, J0737+4724 and J0852+1350 (see their main parameters in Table 5 and their SDSS finding charts – in Fig. 1) were conducted with the multimode instrument SCORPIO (Afanasiev & Moiseev, 2005) installed at the prime focus of the SAO 6 m telescope (BTA) on the nights of 2009 January 21 and December 23; 2010 November 9 and 11. The grisms VPHG550G, VPHG1200G and VPHG1200R were used with either the 2K2K CCD detector EEV 42-40 or 2K4K CCD detector EEV 42-90. See details in Journal of observation in Table 1. The scale along the slit (after binning) was 036 pixel-1 in all cases. The object spectra were complemented before or after by the reference spectra of He–Ne–Ar lamp for the wavelength calibration. The spectral standard star Feige 34 (Bohlin, 1996) was observed during the nights for the flux calibration.
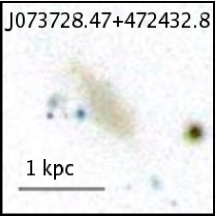
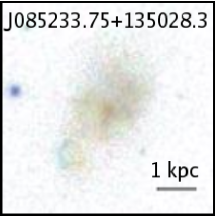
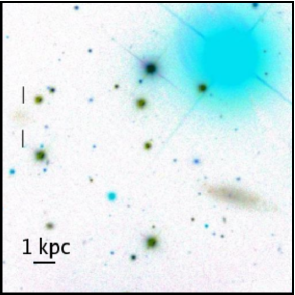
For J0723+3621, the long slit was positioned along the major axis at the position angle PA=69°. For the second observation it was displaced from the detector centre so that the neighbour galaxy J0723+3622 was also on the slit. For J0737+4724, the slit was positioned on two Hii regions (”a” and ”b”) at the south-west edge of the galaxy body (PA=–111°). These Hii regions (with a distance of 4″ in between) were identified through the one-minute exposure acquisition images of this galaxy with a SED665 filter (centre at 6622 Å, FWHM=191 Å). For J0852+1350, the slit was positioned over the brightest ‘central’ knot in this galaxy (same as for the SDSS spectrum) and to include the brightest part of the candidate companion galaxy J0852+1351 at 2′ NE (PA=44°). We also used the SDSS spectrum of J0852+1350 (spID=53815-2430-597) for analysis. It has the useful wavelength range 3800-9000 Å with the typical FWHM of emission lines of 3Å. The spectrum was acquired in 3″ diaphragm, positioned on the brightest knot near the galaxy centre (see Fig. 1).
All spectral data reduction and emission line measurements were performed similar to that described in Pustilnik et al. (2005). Namely, the standard pipeline with the use of IRAF222IRAF: the Image Reduction and Analysis Facility is distributed by the National Optical Astronomy Observatory, which is operated by the Association of Universities for Research in Astronomy, Inc. (AURA) under cooperative agreement with the National Science Foundation (NSF). and MIDAS333MIDAS is an acronym for the European Southern Observatory package – Munich Image Data Analysis System. was applied for the reduction of long-slit spectra, which included the following steps: removal of cosmic ray hits, bias subtraction, flat-field correction, wavelength calibration, night-sky background subtraction. Then, using the data on the spectrophotometry standard star, all spectra were transformed to absolute fluxes. The emission line intensities with their errors were measured in the way described in detail in Kniazev et al. (2004a).
2.3 Imaging data from the SDSS database
The SDSS (York et al., 2000) is well suited for photometric studies of various galaxy samples due to its homogeneity, area coverage, and depth (SDSS Project Book444 http://www.astro.princeton.edu/PBOOK/welcome.htm). SDSS is an imaging and spectroscopic survey that covers about one-quarter of the Celestial Sphere. The imaging data are collected in drift scan mode in five bandpasses (, and ; Fukugita et al., 1996) using mosaic CCD camera (Gunn et al., 2003). An automated image-processing system detects astronomical sources and measures their photometric and astrometric properties (Lupton et al., 2001; Smith et al., 2002; Pier et al., 2003) and identifies candidates for multi-fibre spectroscopy. At the same time, the pipeline-reduced SDSS data can be used, if necessary, in order to get independent photometry (e.g., Kniazev et al., 2004b). For our current study the images in the respective filters were retrieved from the SDSS Data Release 7 (DR7; Abazajian et al., 2009).
Since the SDSS provides users with the fully reduced images, the only additional step we needed to perform (apart from the photometry in round diaphragms) was the background subtraction. For this, all bright stars were removed from the images. After that the studied object was masked and the background level within this mask was approximated with the package aip from MIDAS. The method and the related programs are described in more detail in Kniazev et al. (2004b). To transform instrumental fluxes in diaphragms to stellar magnitudes, we used the photometric system coefficients defined in SDSS for the used fields. The accuracy of zero-point determination was 0.01 mag in all filters.
3 RESULTS
3.1 Spectra and oxygen abundance
3.1.1 J0723+3621 and J0723+3622
There are no spectra for J0723+3621 in the SDSS DR7 database. We obtained a snap-shot (with the acquisition time of 10 minutes) spectrum at BTA in the frame of the Lynx-Cancer void new LSBD search program. The spectrum was acquired along the galaxy major axis. It covers two compact faint peripheral Hii regions and a brighter extended one close to the geometric centre of the galaxy, but substantially displaced from the brightest region of the stellar continuum. The S-to-N ratio in the extracted 1D spectrum of this the brightest Hii region is low.
The second spectrum (with the total acquisition time of 40 minutes) was acquired also along the galaxy major axis, at PA=69°, but the galaxy was displaced from the centre of CCD detector by 1.3′, in order to place the nearby galaxy J0723+3622 on the slit on the usable region of the CCD detector. This allowed the relative velocity of the ionised gas in the both galaxies to be measured. See discussion in 4.3. Despite a factor of 2 higher S-to-N ratio for this spectrum of J0723+3621, the resulting accuracy of the derived physical parameters and the O/H value is still low. We do not discuss this further, but the main strong oxygen line ratios are consistent with the value of 12+(O/H)7.5.
3.1.2 J0737+4724
| J0737+4724 | J0852+1350 | |||
| (Å) Ion | /(H) | /(H) | /(H) | /(H) |
| 3727 [O ii] | 9965 | 9573 | (6024) | (7932) |
| 4101 H | 175 | 2910 | 224 | 267 |
| 4340 H | 348 | 4815 | 505 | 567 |
| 4363 [O iii] | … | … | 93 | 103 |
| 4861 H | 10012 | 10015 | 1006 | 1007 |
| 4959 [O iii] | 5910 | 5110 | 825 | 805 |
| 5007 [O iii] | 17718 | 15118 | 26313 | 25413 |
| 5876 He i | 2011 | 1610 | 73 | 62 |
| 6548 [N ii] | … | … | 11 | 11 |
| 6563 H | … | … | 36518 | 27214 |
| 6584 [N ii] | … | … | 41 | 31 |
| 6716 [S ii] | … | … | 334 | 243 |
| 6730 [S ii] | … | … | 192 | 142 |
| 7320 [O ii] | … | … | … | … |
| 7330 [O ii] | … | … | 42 | 31 |
| C(H) dex | 0.140.16 | 0.380.06 | ||
| EW(abs) Å | 4.500.68 | 0.050.98 | ||
| (H)a | 1.810.16 | 8.810.79 | ||
| EW(H) Å | 28.12.5 | 27.51.2 | ||
| Vhel km s-1 | 45921 | 158630 | ||
| a in units of 10-16 ergs s-1cm-2. | ||||
| Value | J0737+4724 | J0852+1350 |
|---|---|---|
| semi-empir | (Te,c) | |
| (OIII)(103 K) | 19.792.24 | 22.205.13 |
| (OII)(103 K) | 14.942.25 | 16.245.25 |
| (SII)(cm-3) | 1010 | 1010 |
| O+/H+(10-5) | 0.8720.782 | 0.6360.539 |
| O++/H+(10-5) | 0.8830.226 | 1.1660.520 |
| O/H(10-5) | 1.7550.814 | 1.8020.749 |
| 12+log(O/H) | 7.240.20 | 7.260.18 |
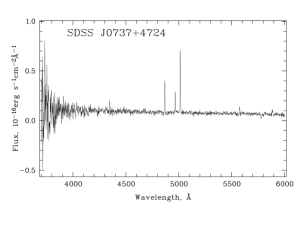
The BTA spectrum of region a is shown in Fig. 4. Due to the strong noise in the UV range, the line [O ii] 3727 has rather low S-to-N ratio. In Table 2, we present the relative (in respect of F(H)), line intensities F() of all relevant emission lines measured in the spectrum, integrated over the region of 7.5″ along the slit, and I(), corrected for the foreground extinction C(H) and the equivalent widths of the underlying Balmer absorption lines EW(abs). Despite the rather long integration time, the S-to-N ratio in the presented spectrum is quite low because the emission-line region is very faint. The principal faint line [O iii] 4363 was not detected. The intensity line ratios for [O iii] 4959,5007 and H are indicative of low metallicity. In the case when the [O iii] 4363 is barely seen or undetected, in the low-metallicity regime, Izotov & Thuan (2007) proposed the so-called semi-empirical method of O/H determination, which employs the relation between the sum of relative intensities of lines [O iii] 4959,5007 and [O ii] 3727 and (see the similar method for the high-metallicity regime in Pagel et al., 1979; Shaver et al., 1983). This method was tested on several of the most metal-poor H ii-regions in Izotov & Thuan (2007) and also by us on our own data. The O/H values derived by this method, appeared to be consistent, within rather small errors (0.07 dex), with those derived via the direct -method. The calculations of O/H were performed on the same formulae as described above in the direct method. But instead of the derived through the intensity ratio of [O iii] lines 4363 and 4959,5007, we adopt the derived with the empirical formula from Izotov & Thuan (2007). In Table 3 we present the electron temperatures for zones of emission of O++ and O+, the adopted electron densities , and the ionic abundances of oxygen, along with the total abundances derived for the above measured line intensities, according to the scheme described in Kniazev et al. (2008).
3.1.3 J0852+1350 and J0852+1351
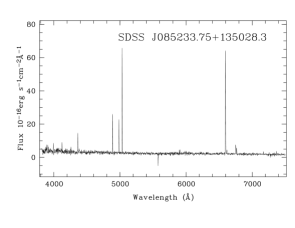
In Table 2, we present the line intensities F() of all relevant emission lines measured in the SDSS spectrum of J0852+1350 (spID=2430-53815-597). The line [O ii]3727 is out of the range for the SDSS spectra with redshifts of 0.025. As was suggested in Kniazev et al. (2003, 2004a), we employ the variant of the classic method in which the line intensities of [O ii]7320,7330 are used. Despite the principal line [O iii]4363 is well seen, its form and the sizable shift from the correct wavelength position indicate that its intensity is affected by the noise. Indeed, the formal estimate of the r.m.s. error of this line intensity after the MIDAS deblending procedure (with H line), gives the uncertainty of 30%. Furthermore, the derived by the classic -method the related temperatures appear to be non-physical (too high). To proceed further, we reduced the intensity of [O iii]4363 by 30%, that corresponds to 1 . Therefore, the values of in Table 3 (2-nd column) have relatively large errors.
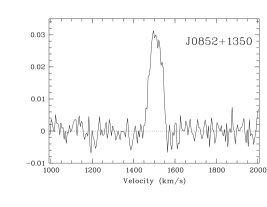
The BTA spectrum of this galaxy in the range of 6000–7200 Å was obtained with the slit positioned on the brightest central knot and including the blue faint galaxy at 2′ NE. For the larger galaxy, no new information was obtained on the relative line intensities in respect of that derived from the SDSS spectrum. The moderately strong emission H line (38 Å) was detected in the companion. The measurements of the H-line wavelengths in the both objects resulted in a determination of their radial velocities: (J0852+1350)=15344 km s-1; and (J0852+1351) =156522 km s-1. The relative velocity of the fainter component is +3122 km s-1.
3.2 Hi parameters
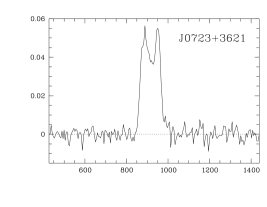
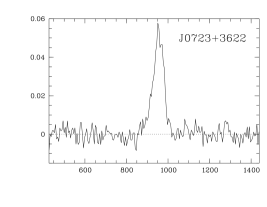
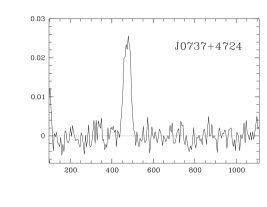
The profiles of the 21-cm Hi line emission in J0723+3621, J0723+3622, J0737+4724 and J0852+1350, obtained with NRT, are shown in Fig. 3. Their observed and derived parameters are summarised in Table 5. The signal from the galaxies J0723+3621 and J0723+3622, due to their proximity, should be affected by their mutual confusion. Since the angular distance between the two galaxies is only 145.5″ in R.A. and 0.93′ in Declination, the signal of one galaxy for the beam pointing to its neighbour, due to the beam off-set, is expected to be 0.3 of its nominal value, if the Hi emission of each galaxy is concentrated near its optical counterpart and has a typical size of 1′. Having the independent information on the optical velocities of the both components and the known (Gaussian) function of the signal decrease due to the beam off-set, one can disentangle at first approximation the contribution from the both galaxies.
The analysis of these Hi profiles taking into account for the mentioned above Hi-flux decrease and for all a priori information from the optical spectra, leads to the following model. The two velocity peaks correspond to two spatially different Hi components. The first one, at =888 km s-1 is related to the larger, western LSBD J0723+3621. But its centre is probably shifted westward by 23″(1.7 kpc). The second component, with =954 km s-1, has approximately the same Hi-flux as the first component. But its position is quite far from the eastern component J0723+3622, since its apparent flux does not change significantly for two pointings. The simplest explanation is that the Hi component is situated somewhere in the middle between the two LSBDs, that is it represents a gas flow or a tidal bridge. The Hi integrated flux presented in Table 5 for J0723+3621 gives the total flux of the system after the respective corrections for the beam off-sets, assuming that due to the large difference in the component luminosities, the Hi-mass of J0723+3622 contributes a small unknown fraction, which probably does not exceed 10–15 per cent. Due to the large uncertainties, we do not present the Hi parameters of J0723+3622, except the velocity of the second component. To obtain a more detailed picture of Hi in this system, we need a map with the angular resolution of 10″ or better.
To estimate the galaxies’ global parameters, we adopted =15.6, 10.4 and 23.1 Mpc for their distances, respectively and the linear scales of 73, 52 and 112 pc in 1 arcsec. The distances are derived from their =885, 521 and 1360 km s-1, the accepted Hubble constant of 73 km s-1 Mpc-1 and the correction for the large negative peculiar velocity discussed by Tully et al. (2008), which we adopt for these galaxies as 264 km s-1, 235 km s-1 and 322 km s-1, respectively. See also Paper I for a more detailed discussion of the distance issue for the Lynx-Cancer void galaxies. The Hi mass of each galaxy is determined by the well-known formula for an optically thin Hi-line emission (Roberts, 1969).
3.3 Photometric properties and the age estimates
Based on the results of photometry and analysis of the SDSS images, we present in Table 4 (the upper part) several model-independent parameters such as the total magnitudes , the related four colour indexes - , , and , and the recalculated . In the other lines we give the effective angular radii at the SB = 25 mag arcsec-2 in and filters, the axial ratio at this SB level (adopted from NED/SDSS), and the values of the Holmberg radii (at SB = 26.5 mag arcsec-2) in and filters.
In the bottom of Table 4 we summarize parameters of the Sersic profile fitting: the observed central SB in and filters, the observed central SB in -band (from the two former parameters, using the transformation formula of Lupton et al. (2005)) and the respective value, corrected for the foreground Galaxy extinction (Schlegel, Finkbeiner, Douglas, 1998) and for disc inclination – . For the majority of these galaxies, the Sersic index is close to 1, so their SB profiles are close to purely exponential. Only for the faintest galaxy J0723+3622 ( = –11.9) the SB profile looks significantly different from the exponential one. We also give the ’disc’ scalelengths in and , and the colours , and of the outer regions of the target galaxies, used to constrain the ages of the oldest stellar population, as shown in the last line. The latter were estimated from the additional photometry on a subset of small round diaphragms (diameter of 2″) in the outer regions with the exception of those with detectable H-emission. In Fig. 5 and 6 we show, respectively, for three new void LSBDs and two their faint companions, the representative radial surface brightness (SB) profiles in -filter and the radial run of colour.
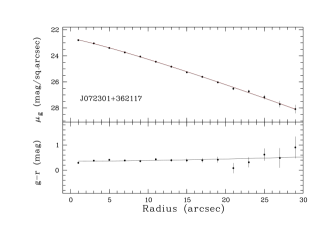
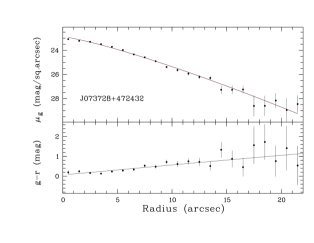
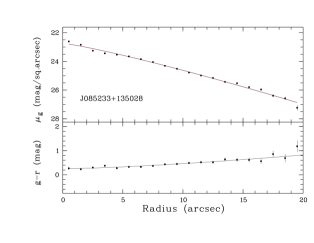
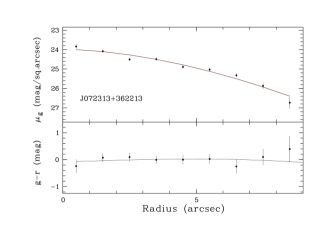
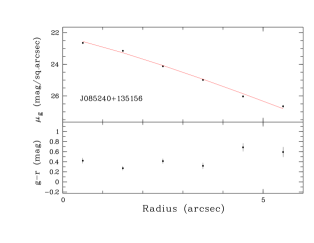
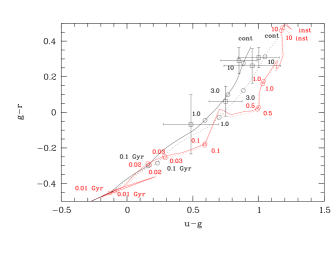
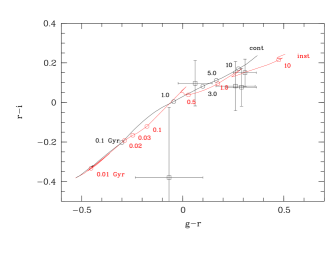
One of the goals of our surface photometry was to compare the observed colours of the outer regions with the PEGASE2 model evolutionary tracks (Fioc & Rocca-Volmerange, 1999), in order to obtain the age estimates of the oldest visible stellar population in a galaxy. As one can see from the colour radial profile in Fig. 5, due to the contribution of H ii regions to the light of the outer parts of the galaxy, it is difficult to estimate from the profile the outer colours and decide whether there is a colour gradient in the underlying stellar population. Also, due to rather elongated form of the galaxies, the photometry in ring diaphragms mixes the light from different parts of the ‘disc’, and thus will tend to wash-out colour gradients if they are present. Therefore, to analyse the colours in galaxy outer parts, we employ the approach used in our analysis of the stellar colours in the galaxies DDO 68 and SDSS J0926+3343 (, Pustilnik et al.2008a; Pustilnik et al., 2010).
In Fig. 7, the PEGASE2 tracks for metallicity =0.0004 (the nearest to the observed in these galaxies) are compared with the observed, extinction corrected colours, ,, of the outer regions with the negligible nebular emission (as given in the bottom part of Table 4). The exception is the very compact galaxy J0852+1351 with a nearby confusing background galaxy. For this object we adopted the integrated colours for the light inside a round diaphragm with a diameter of 8″. The tracks for both: the standard Salpeter and the Kroupa et al. (1993) IMF with the reduced contribution of the sub-solar mass stars are shown in the , plot. In the , plot, the Kroupa IMF tracks are very close to the Salpeter ones. Due to this degeneracy, we do not show the former tracks. Also, the tracks for both SF laws run very close to each other. We show the galaxy colours in this plot to illustrate the general consistency with those from the , plot. In fact, the photometric systems (,,,,) used for calculations of the PEGASE2 evolutionary tracks and () used in the real SDSS observations are slightly different. We applied the transformation formulae from Tucker et al. (2006) in order to correct theoretical values to the () system.
In the , diagram, the colours of the examined regions follow the model tracks rather well, with a better match for the tracks with continuous SF law and Kroupa IMF. For three of these LSBDs, the colours are consistent, within rather large uncertainties, with ‘cosmological’ ages of (7.5–10)(3.5–5) Gyr. For two the bluest objects - J0723+3622 and J0737+4724, the colours indicate the ages of 1 Gyr and 2 Gyr, respectively, with the 1 confidence intervals of 0.2–3 Gyr and 1–3 Gyr.
| Parameter | J0723+3621 | J0723+3622 | J0737+4724 | J0852+1350 | J0852+1351 |
|---|---|---|---|---|---|
| 16.660.01 | 19.100.02 | 17.690.01 | 17.050.01 | 19.470.02 | |
| 1.230.06 | 0.550.19 | 1.000.08 | 1.080.05 | 0.490.05 | |
| 0.400.01 | –0.060.11 | 0.460.03 | 0.490.02 | 0.340.03 | |
| 0.010.02 | –0.250.19 | –0.260.04 | 0.050.02 | 0.080.03 | |
| –0.120.07 | – | 0.400.08 | –0.050.02 | — | |
| 17.010.02 | 19.310.03 | 18.060.02 | 17.430.02 | 19.800.03 | |
| () | 13.8 | 5.3 | 8.7 | 11.6 | 3.4 |
| () | 15.7 | 5.5 | 10.4 | 14.9 | 3.9 |
| (SDSS) | 0.34 | 0.67 | 0.46 | 0.60 | 0.64 |
| () | 20.9 | 8.2 | 13.7 | 18.1 | 5.0 |
| () | 24.3 | 8.6 | 15.8 | 20.8 | 5.7 |
| (mag arcsec-2) | 22.650.03 | 23.980.13 | 22.880.08 | 22.730.07 | 22.280.11 |
| (mag arcsec-2) | 22.280.08 | 24.060.11 | 22.800.05 | 22.470.05 | 21.790.14 |
| (mag arcsec-2) | 22.99 | 24.13 | 23.19 | 22.97 | 22.66 |
| (mag arcsec-2) | 24.14 | 24.36 | 23.66 | 23.41 | 23.18 |
| (Sersic) | 1.140.02 | 1.740.28 | 1.230.06 | 1.170.05 | 1.240.07 |
| () | 7.1 | 5.4 | 5.1 | 6.2 | 1.7 |
| (Sersic) | 1.130.06 | 1.940.28 | 1.290.04 | 1.130.04 | 1.050.07 |
| () | 7.1 | 5.6 | 6.3 | 6.8 | 1.4 |
| 0.950.21 | 0.490.22 | 0.750.13 | 1.000.18 | 0.850.14 | |
| 0.260.10 | –0.070.17 | 0.060.08 | 0.310.06 | 0.290.07 | |
| 0.080.12 | – 0.380.35 | 0.100.12 | 0.150.08 | 0.080.10 | |
| (‘old’ population) | 4–13 Gyr | 0.1–3 Gyr | 1–3 Gyr | 6.5–14 Gyr | 6.5–13.5 Gyr |
| (1) – from NED; (2) – values of and others are corrected for the Galactic extinction and inclination (see text); (3) – colours of the outer parts are corrected for the Galactic extinction. | |||||
4 DISCUSSION
4.1 Main parameters
In Table 5 we present the main parameters of the three studied LSB galaxies. From the total magnitudes in filters and (Table 4), with the transformation equations of Lupton et al. (2005) we derive their values of . For the adopted distance moduli of galaxies J0723+3621, J0737+4724 and J0852+1350, =30.97 (=15.6 Mpc), =30.09 (=10.4 Mpc) and =31.82 (=23.1 Mpc), and the values of the foreground Galactic extinction =0.23, 0.47 and 0.16 mag, their resulting absolute magnitudes are –14.21, –12.32 and –14.66 mag, respectively. These values of correspond to the blue luminosities of =6.5107, 1.32107 and 11.4107 ⊙. Using the masses (Hi) derived in the previous section, one obtains the ratio (Hi)/3.9, 1.9 and 2.6 (in solar units).
From the Hi-line width at 20%-level of the maximum intensity, , one can estimate the maximal rotational velocity, using the standard approximation, as, e.g., formula (12) from Tully & Fouqué (1985). For further estimates we account for inclination corrections for the three galaxies of 1/ 1.04, 1.12 and 1.29, respectively. The inclination angle was adopted according to the standard formula , where is the observed axial ratio, and is the intrinsic axial ratio, adopted to be equal to 0.2. Then, for the measured line widths =70, 55, and 93 km s-1, respectively, the observed rotation velocities are 29, 21 and 39 km s-1. The inclination-corrected are then 30, 24 and 50 km s-1, for J0723+3621, J0737+4724 and J0852+1350, respectively. All these are quite typical of dwarf galaxies with similar values of as traced for the faint dwarf galaxies (e.g., in FIGGS sample, Begum et al., 2008b).
Having and the characteristic sizes of the studied galaxies, one can estimate their total (dynamical) masses, which are necessary to balance the centrifugal force within a certain radius. The typical radii of Hi discs (at the column density level of 1019 atoms cm-2) in dwarf galaxies with between –12.5 and –14.5 mag, close to that of our LSB dwarfs, are 2.5–3 times larger than the Holmberg radius (e.g., Begum et al., 2008a, b). Therefore, we accept that the Hi radii of the studied galaxies are 2.7 . Then, for galaxies J0723+3621, J0737+4724 and J0852+1350, we have, respectively, 6.57, 2.43, 6.05 kpc. Finally, from the relationship: () = /, where is the gravitational constant, one derives the total mass within . They are, respectively, =136107, 32107 and 350107 ⊙.
To estimate a galaxy gas mass, we sum (Hi) and (He) (assuming the mass-fraction of 0.33 for He) and obtain (in the same order): =38.6107, 3.43107 and 35.2107 ⊙. These estimates have the interesting implications. The galaxies, as expected, are dark-matter dominated, but not too much. Taking into account the contribution of the stellar mass (which is quite small, see below), the ratio is 7.5–9.1 for J0737+4724 and J0852+1350, and only 3.0–3.4 for J0723+3621. These values (except that of J0723+3621) are similar to those for two other extreme void dwarfs: DDO 68 and J0926+3343 (5.3 and 12) (Pustilnik et al., 2005; Pustilnik et al., 2010, and Table 5) and do not differ much from the universal value 1/ = / = 0.27/0.04695.8, derived from the most updated WMAP7 data (Jarosik et al., 2011). For the galaxy J0723+3621, due to the rather approximate decomposition of its complex Hi profile, we may have underestimated the parameter and the related values of and . In any case, for a better estimate of in these LSBDs, one needs their resolved Hi kinematics.
To estimate the stellar mass of the studied galaxies, we follow the recipe of the stellar ratio () from the recent paper by Zibetti et al. (2009). To compare the gas mass-fractions in our galaxies with those in LSBGs from the other studies, we also obtain the stellar masses via the from the frequently used recipes in Bell et al. (2003). We notice that both these recipes use the initial mass functions (IMF) with the significant deficit of the subsolar-mass stars with respect to the standard Salpeter IMF. Hence, the resulting values of are noticeably smaller.
We take from Table 4 the total -magnitudes and the colours of the integrated light, corrected for the foreground Galactic extinction and calculate on a linear fit using the coefficients given in Table B1 of Zibetti et al. (2009). We use this as the most robust value according to Zibetti et al. (2009). Similar values of are obtained using to the coefficients in Table 7 of Bell et al. (2003). The range of the derived estimates of stellar masses with these two prescripts for each of the five LSBDs is given in Table 5. Despite both recipes having approximately the same IMF for subsolar mass stars, the resulting values of derived via the recipe from Zibetti et al. (2009) are smaller by a factor of 4 to 9, depending on the colour. As Zibetti et al. (2009) explain this difference, this is mainly related not to the different IMF, but to the different assumptions about SF history in terms of ages and bursts.
We also provide the related estimates of , the ratio of . For comparison, we also present similar estimates of and for the other Lynx-Cancer void galaxies added to Table 5.
4.2 Galaxy masses versus model predictions
It is interesting to compare the derived values of / and the estimated for the five mentioned above extreme void dwarfs with the predictions from the numerical simulations by Hoeft et al. (2006); Hoeft and Gottlöber (2010), who found a significant baryon deficiency for objects with 40 km s-1 due to the UV radiation heating of the infalling baryon gas. One should account for the difference in definition in the model DM halos. The latter corresponds to the virial mass of a DM halo , defined at the radius . For dwarfs, the radius at which is close to the flat part of the rotation curve, is a factor of 5–10 smaller than (see, e.g., Trujillo-Gomez et al., 2010). The related mass of a DM halo is therefore much higher than the directly measured at the last point of the observed rotation curve. With this difference in mind, the correspondence of our estimates to the results of simulations for the ratio Mtot/Mbary versus , shown in Fig. 2h of Hoeft and Gottlöber (2010), can be considered acceptable at the zero approximation for the galaxies with 30 km s-1. However, the resolved Hi-mapping and modelling of the mass distribution are necessary to make the comparison more reasonable. As for the two galaxies with = 50–55 km s-1, their observed baryonic mass-fractions appear too small. Namely, after correction of the measured Mtot to that of the DM halo, they fall much lower with respect to the predicted baryon mass-fraction.
Another option of the examining the dynamical properties of the studied void LSBDs is to confront them with the results of recent state-of-art models. In particular, Trujillo-Gomez et al. (2010), using the CDM cosmological simulations of the very large volume, present the Baryonic Tully-Fisher (BTF) relation (their Fig. 11) for measured at kpc, which well matches the parameters of galaxies in the wide range of =60-400 km s-1. Of course, the data of Hi-mapping are prerequisite for a more reliable comparison with the model predictions since one cannot be confident on the real extent of the rotation curve and its inclination correction (due to the possible difference in inclination of the optical body and its Hi-disc). However, the baryon masses of the two fastest rotators – J0852+1350 and DDO 68 – are not much different to the model-predicted values. For DDO 68 we use the GMRT Hi-maps from (Ekta et al.2008). But this object is likely the result of a recent merger. The smaller void LSBDs fall outside the modelled rotation velocity range, but all of them have much too large baryonic masses as compared with naive extrapolation of the theoretical curve. This part of the BTF curve, is defined, according to Trujillo-Gomez et al. (2010), mostly by the ‘observed’ luminosity function of SDSS galaxies. One of the possible solutions of the apparent problem is that for the void LSBD galaxies with = 20–30 km s-1 their baryonic mass-fractions are 5–10 times larger than the more typical SDSS galaxies. One needs larger dwarf galaxy samples in the wide range of the environment density to probe the parameter space which affects the galaxy baryonic mass-fraction.
4.3 Faint companion LSBDs
The incidence of dwarf pairs and interactions in voids was already noticed in earlier studies (e.g., by Pustilnik et al., 2002, 2003) and recently by van de Weygaert et al. (2011). Here we add the information on two more dwarf pairs in the Lynx-Cancer void.
At 2.6 NEE from J0723+3621, approximately along the direction of its major axis, there is a faint very blue LSB galaxy SDSS J072313.46+362213.0 (hereafter, J0721+3622), with the total size of 10″(1 kpc), =19.10, = –0.06 and = –0.25. From the BTA long-slit spectrum described in Sec. 2.2, with both galaxies on the slit, we derived on H-line the radial velocity of J0721+3622, which is 90 km s-1 larger than that of J0723+3621. This implies that the galaxies are in a rather high-velocity encounter. The higher spectral resolution spectrum (with FWHM=5.5 Å) of J0723+3621 is insufficient for a good quality rotation curve in H. However, this permits a determination of the direction of rotation and to obtain a rough estimate of its amplitude: the eastern edge is receding and the full amplitude of rotation is 40 km s-1 at the radial distances 17″. The respective value of 20 km s-1 is by a factor 1.4 lower than that derived from the Hi profile (see Table 5). This is quite natural since the H estimate corresponds to the internal region where the full extent is several times smaller than that for based on the Hi profile.
From the analysis of the two Hi profiles in Fig. 3, corresponding to the NRT pointings to two both components of this pair, the first approximation of the Hi gas distribution can be inferred. This consideration should account for the signal drop due to the beam off-set. The lower velocity peak, corresponding to that of J0723+3621, drops by a factor of 5 at the antenna beam pointing to J0723+3622. However, the second peak, containing approximately the same amount of Hi-flux, does not change for this pointing as one could expect. This suggests that the Hi gas responsible for the emission in this velocity range is situated mid-way between the two galaxies and probably represents a strong tidal bridge. Since the total luminosity of J0723+3622 in -band is only 1/8 of that for J0723+3621, the strong tidal effect in this collision poses the question on the relative total masses of both galaxies. The orientation of the mutual orbital motion and of the rotation vector for J0723+3621, determined on the long-slit spectrum in this paper, indicates that this galaxy experiences a prograde encounter. The latter usually infers a strong tidal effect. But still, the strong tidal bridge needs a significant mass for the disturber. The Hi mapping of the system should help to better estimate the dynamical mass of J0723+3622. Besides, the N-body simulations of the system can better constrain the minimal total mass of this very faint, but quite a massive LSBD.
Similarly, at 2 NE from the galaxy J0852+1350 (13 kpc in projection), approximately along its minor axis, there is a faint (9 times less luminous) blue Irr galaxy, SDSS J0852+1351, with a total size of 8″ (1 kpc), =19.47, =0.34 and =0.08. As described in Sec. 3.1.3, its radial velocity, obtained on the BTA spectrum is 30 km s-1 higher than that of its larger companion. A somewhat disturbed morphology of J0852+1350, with a circular type feature at the SE edge, can be considered as an indication on the substantial effect of interaction between the two objects.
These two pairs can be the analogs of other binary/interacting systems of the very gas-rich metal-poor galaxies such as the well known SBS 0335–052E,W (Pustilnik et al., 2001a; , Ekta, Pustilnik & Chengalur 2009; Moiseev, Pustilnik & Kniazev, 2010) and the Lynx-Cancer void pair HS 0822+3542 and SAO 0822+3545 (Pustilnik et al., 2003; Chengalur et al., 2006). It is worth noting that in such very metal-poor and gas-rich pairs the optical luminosity ratio may not provide a useful indicator of the baryon or the total mass ratio. In particular, the -band light ratio for the E and W galaxies in SBS 0335–052 system is 7:1 (Pustilnik, Pramskij & Kniazev, 2004), while the Hi-mass ratio is 0.8:1, and the total mass ratio is of 1 (, Ekta, Pustilnik & Chengalur 2009). For the other mentioned pair we see rather the opposite situation. The LSBD galaxy SAO 0822+3545 is a factor 1.4 more luminous and a factor of 3 is more massive in Hi. In such galaxies Hi-mass is a good proxy of the baryon mass, since their stellar mass contributes to baryons no more than 5–20%. Therefore, to understand whether these two void LSB pairs are minor or major encounters, it is crucial to obtain their Hi-maps.
4.4 Unusual LSBDs in Lynx-Cancer void versus more typical LSBDs
In the previous sections we described several new gas-rich Lynx-Cancer void LSBDs with unusual properties: the extremely low O/H and/or blue outer colours which imply a relatively recent main episode of star formation. In Table 5 we included three additional similar objects in this void identified in our earlier papers - SAO 0822+3545, SDSS J0926+3343 and DDO 68. It is reasonable to ask, whether these ‘extreme/unusual’ void LSBDs really differ from the more common LSBDs.
One of the options is to check how they are similar to other known LSBDs in respect of various relationships involving O/H. Also, since they are very gas-rich, it is reasonable to compare them to LSBDs with the large value of (Hi)/. Many such dwarf galaxies are collected in the FIGGS sample (Begum et al., 2008b). Unfortunately, it is not an easy task - to obtain the reliable O/H estimates in LSBGs, since their Hii regions are rather faint. On the other hand, for many late-type dwarfs in the Local Volume, the reliable O/H data are available. However, the data in their surface photometry with the estimates of the central SB of the underlying LSB disc are absent. The samples with known O/H and the SB data are poorly correlated and to separate LSBD galaxies with known O/H is a problem. Therefore, we use for comparison the relationship ’O/H versus ’ from van Zee & Haynes (2006). There are two more complementary samples from the Local Volume, those of van Zee et al. (2006) and Lee et al. (2003). They result in similar relationships ’O/H versus ’, but with somewhat higher scattering for the fit lines.
For comparison with other correlations between optical and Hi properties, one can use the Hi-selected galaxies from the Equatorial Survey (ES) based on HIPASS (Garcia-Appadoo et al, 2009; West et al., 2009). These authors, in particular, found in their sample of 195 galaxies a fraction of the smallest objects assigned to the type of ”inchoate” galaxies which are blue dwarf LSB gas-rich objects apparently similar to part of our void sample objects. Their inchoate objects are not outliers. From the relationships between the whole sample galaxy parameters, they comprise probably the low-mass tail of the broad parameter distributions of the Hi identified galaxies. Therefore, it is of interest to understand how the parameters other than O/H for our ‘extreme’ void LSBDs are similar to those of the ”inchoate” type.
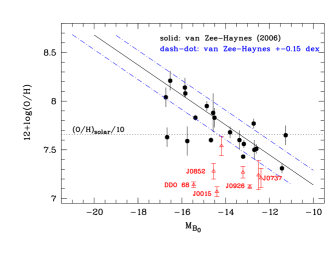
In the left panel of Fig. 8 we show the five ‘extreme’ Lynx-Cancer LSBDs (red triangles) from Table 5 in the diagram ‘O/H vs ’. The solid line shows the general relationship for late-type dwarfs from the Local Volume and its surroundings, as derived by van Zee & Haynes (2006). As explained in Paper II, we applied the small correction to their regression line to convert their original O/H to the new O/H scale [in which our O/H data are given (Izotov et al., 2006)]. The filled dots show 13 LSBGs from van Zee & Haynes (2006) sample and seven additional LSBDs from the literature. The latter include And IV (Begum et al., 2008b; Pustilnik et al., 2008b), SDSS J1201+0211 and J1215+5223 (Kniazev et al., 2003; Pustilnik & Martin, 2007), ESO489-56, ESO577-27 and ESO146-14 (Rönnback & Bergvall, 1995; Matthews & Gallagher, 1996; Mathewson & Ford, 1996; Pustilnik & Martin, 2007), DDO 154 (NED). The red triangles show two more very metal-poor void galaxies SDSS J0744+2508 and J0812+4836 from Paper II and Izotov & Thuan (2007) and a new LSBD SDSS J0015+0104 with 12+(O/H)=7.07 (Guseva et al., 2009), which is very isolated from luminous galaxies and resides deeply in the Eridanus void.
The majority of LSBDs from the ‘control’ sample appear within the region of 0.15 dex from the ‘standard’ fit line of van Zee & Haynes (2006). This region is shown in the plot as limited by the two dashed lines, parallel to the ‘standard’ line. Indeed, as van Zee & Haynes (2006) demonstrate, the LSB members of their late-type galaxy sample do not show any systematic deviation from their ‘standard’ fit. However, the two southern metal-poor LSBDs ESO577-27 and ESO146-14 from Rönnback & Bergvall (1995) fall significantly below this border (0.3-0.4 dex) and this might hint on the systematic shift of LSB metallicities relative to their high SB counterparts. A newly identified by Mattsson, Pilyugin and Bergvall (2011) very metal-poor LSB galaxy ESO 546-G34 (12+(O/H) 7.4 dex), probably resembles the discussed here LSB dwarfs, but its environment is not studied.
The statistics of LSBDs with well known O/H and the good photometry is not yet large enough to check the impact of LSB galaxies on to the slope and the zero-point of ‘O/H vs ’ relationship. As shown in Paper II, the effect of the global environment on to the dwarf galaxy metallicity does exist. Therefore, to probe the effect of LSB in galaxies, one needs to separate a LSB sample in a more typical global environment. Four of the eight ‘extreme’ void galaxies fall significantly below the lower dashed line. In this sense they are indeed XMD (eXtremely Metal-Deficient) as defined by Ekta & Chengalur (2010). That is their values of O/H are 3-7 times lower than those for typical similar galaxies residing in denser environments. This is indicative of their unusual evolutionary history.
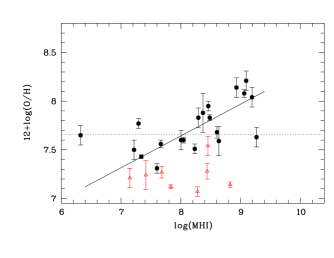
In the right panel we show a similar plot, ‘O/H vs (Hi)’ where the hydrogen mass (Hi) is used as a surrogate of the total baryonic mass. Here the scatter of the control LSBD sample is larger. But again, the three Lynx-Cancer void galaxies with the lowest metallicities and SDSS J0015+0104 show O/H significantly smaller than their analogs from denser environment regions with the same gas mass.
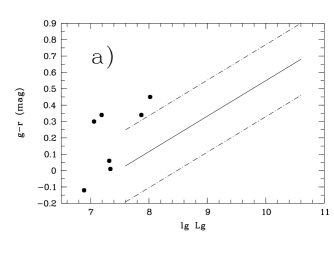
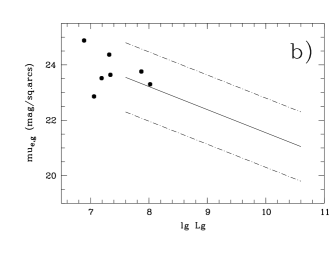
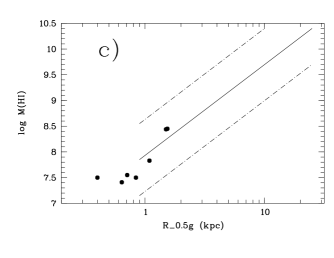
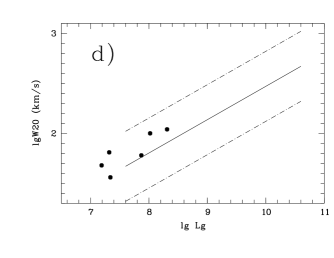
We have checked how the parameters of these extreme void LSBDs match to the correlations between the main parameters of the ES sample of Hi identified galaxies from Garcia-Appadoo et al (2009) on their plots vs , (g) vs , (Hi) vs (g), (Hi) vs . In Fig. 9a,b,c,d we show respectively the sketches of their Figures 15, 16, 17 and 19 with the data for our void galaxies overlaid. For two faint companion LSBDs without Hi-flux estimates we adopted conditionally the same (Hi)/ ratios as for their brighter counterparts. The luminosities and hydrogen masses as well as the Hi profile widths of the considered void LSBDs appear on the lower edges of the respective ES sample distribution or even outside these ranges. But in none of these plots the void galaxies in the question show the deviations larger than the typical scatter of ES sample galaxies from their general trends. This suggests that the global properties of the void LSBDs are similar to the those of the dimmest, ‘inchoate’ part of the ES sample. Currently neither metallicities, nor the global environment are known for these inchoate ES galaxies. In principle, they can be the full analogs of the void lowest metallicity LSBDs. In the case of their O/H are higher and closer to the ‘standard’ ‘O/H vs ’ relationship, they can be just more evolutionary advanced cousins of rather rare ‘extreme’ void LSBDs. The study of both parameters, O/H and global environment of the inchoate ES galaxies will help to understand the possible relation between the unusual Lynx-Cancer void galaxies and the specific subsamples of galaxies separated in large ‘unbiased’ surveys.
Completing the issue of unusual LSBDs residing in this void, we emphasize their high spatial concentration. The full volume of this void with diameter Mpc is 1.5 times larger than that for the Local Volume defined in Karachentsev et al. (2004) as a sphere with Mpc, containing 450 galaxies with known distances. Most of them are situated in a flattened Local Sheet (Tully et al., 2008) with a typical density exceeding the global value. For the significant fraction of the Local Volume galaxies, the parameter O/H is available. Only for two of them - Leo A and UGCA 292, their values of O/H appear to be as low as 12+(O/H) 7.3. But both of them match the van Zee & Haynes (2006) ‘O/H vs ’ relationship, so they just follow the general dependence. The volume of the Lynx-Cancer void relative to that of a large sphere with radius of 26 Mpc, in which the Lynx-Cancer void is immersed, comprises only 5%. There are at least four extremely metal-poor LSBDs in the void (including DDO 68 and SDSS J0926+3343 at the mutual distance of only 1.6 Mpc). We can count only one similar galaxy I Zw 18 for the large sphere. Its real distance is still debated, but the analysis of its environment shows that I Zw 18 is also well isolated, having no luminous neighbours closer than 2 Mpc.
Since no complete study of O/H in galaxies of the LV and the Local Supercluster exists, one can not exclude the role of some selection effects in this drastic enhancement of concentration of the ‘extreme’ metal-poor LSBDs in the Lynx-Cancer void. However, the overall effect of this ”selection” does not look to be significant. Nevertheless, the absence of more or less complete database for O/H in the LV galaxies is an important caveat for the comparative study of galaxy evolution in various environments.
The increased density of such unusual objects in the void region is certainly not by chance. The most metal-poor galaxies prefer the low galaxy-density regions. However, even in voids their fraction is small. The void environment can be favourable for the retarded dwarf galaxy formation and their slower evolution due to significantly reduced effect of galaxy encounters and their induced SF. Thus the ‘inchoate’ galaxies could be a significant fraction of void population. On the other hand, the large fraction of currently detected ‘extreme’ void dwarfs appear to experience a recent stronger or weaker interaction resulted in the extra SF and the enhanced intensities of emission lines. This eased their discovery, determining their optical redshifts and their identification as the void galaxies.
How large a fraction of the dormant gas-rich galaxies is undisclosed in the void, remains an open question. The well-known interacting/merging pair of the most metal-poor dwarf galaxies SBS 0335–052E,W (see new data in , Ekta, Pustilnik & Chengalur 2009; Izotov et al., 2009) is also situated near the border of a large void (Peebles, 2001). The existence of the sizable Hi cloud population in ‘nearby’ voids, with the baryonic masses comparable to those of dwarf galaxies, visible through their Ly- absorption (Manning, 2002, 2003, and references therein), also hints on the unevolved state of the significant fraction of baryons in voids. The more advanced analysis of the Lynx-Cancer void dwarf galaxy census and the summary of their properties will be presented elsewhere.
| Parameter | J0723+3621 | J0723+3622 | J0737+4724 | SAO 0822 | J0852+1350 | J0852+1351 | J0926+3343 | DDO 68 |
|---|---|---|---|---|---|---|---|---|
| AB (from NED) | 0.23 | 0.23 | 0.47 | 0.20 | 0.16 | 0.16 | 0.08 | 0.08 |
| Btot | 17.010.03 | 19.310.03 | 18.060.03 | 17.56 | 17.43 | 19.80 | 17.34 | 14.60 |
| Vhel(Hi)(km s-1) | 8882(3) | 9543(3) | 4732(3) | 7422 | 15073 | 153722 | 5362 | 5022 |
| VLG(Hi)(km s-1) | 8852(3) | 9513(3) | 5212(3) | 7112 | 13603 | 139022 | 4882 | 4282 |
| Distance (Mpc) | 15.6 | 15.6 | 10.4 | 13.5 | 23.1 | 23.1 | 10.7 | 9.9 |
| M (4) | –14.19 | –11.89 | –12.50 | –13.30 | –14.55 | –12.18 | –12.90 | –15.46 |
| Opt. size (″)5 | 4415 | 129.5 | 21.610.4 | 28.215.5 | 24.815.4 | 10.06.4 | 35.89.9 | 10338 |
| Opt. size (kpc) | 3.21.1 | 0.880.69 | 1.120.54 | 1.851.0 | 2.781.72 | 1.120.7 | 0.930.26 | 4.941.82 |
| (4) | 24.14 | 24.36 | 23.66 | 23.40(8) | 23.41 | 23.18 | 25.4(9) | 23.3(11) |
| 12+(O/H) | 7.5: | – | 7.240.20 | …. | 7.280.08 | — | 7.120.02 | 7.140.03 |
| Hi int.flux(6) | 5.050.18 | – | 1.010.08(2,3) | 0.830.08 | 2.100.15 | — | 2.540.07 | 28.93.0 |
| W50 (km s-1) | 463(2,3) | – | 394(2,3) | 33.8(9) | 765 | — | 47.4(9) | 81.4(12) |
| W20 (km s-1) | 705(2,3) | – | 556(2,3) | … | 938 | — | 80.5(9) | 103.0(12) |
| Vrot (Hi)(km s-1) | 29.8(2,3) | – | 23.8(2,3) | 18(9) | 49.8(2,3) | — | 32(9) | 55(12) |
| M(Hi) (10) | 28.4 | – | 2.60 | 3.57 | 27.6 | — | 6.8 | 66.8 |
| Mdyn (10) | 136 | – | 32(2) | 13.9 | 350(2) | — | 124 | 490 |
| M(Hi)/LB(7) | 3.9(2) | – | 1.9(2) | 1.1 | 2.6(2) | — | 3.0 | 2.9 |
| M∗ (10) | 1.37, 6.13 | 0.02, 0.18 | 0.10, 0.66 | 0.20, 1.17 | 3.21, 12.05 | 0.23, 1.00 | 0.14, 0.91 | 1.66, 10.0 |
| fgas | 0.96, 0.86 | – | 0.97, 0.84 | 0.96, 0.80 | 0.92, 0.75 | — | 0.98, 0.91 | 0.98, 0.90 |
| T(main pop.) | 5-13 Gyr(2) | 0.1–3 Gyr | 1–3 Gyr | 1–2 Gyr | 6–13 Gyr | 6–13 Gyr | 1–3 Gyr | 1 Gyr |
| (1) – from NED; (2) – derived in this paper; (3) – derived from NRT Hi profile; (4) – corrected for the Galactic extinction AB and inclination (); (5) – full size at 250 arcsec-2; (6) – in units of Jy km s-1; (7) – in solar units; (8) Pustilnik et al. (2003); (9) - Pustilnik et al. (2010); (10) - Izotov & Thuan (2007);(11) - (Pustilnik et al.2008a); (12) - (Ekta et al.2008). | ||||||||
4.5 Summary
Summarising the results and discussion above, we draw the following conclusions:
-
1.
Three LSB dwarf galaxies SDSS J0723+3621, J0737+4724 and J0852+1350 (=24.14, 23.66, and 23.41 mag arcsec-2, respectively) situated in the nearby Lynx-Cancer void appear to be the new representatives of very metal-poor and/or gas-rich void objects. The oxygen abundances of J0737+4724 and J0852+1350, estimated via the semi-empirical method, correspond to 12+(O/H)=7.24 and 7.28 dex, respectively.
-
2.
All three new void LSBDs (and three other similar void objects) are DM dominated, with the estimated mass ratios of Mtot/M3.4, 9 and 8.8, respectively. The values of this parameter for four LSBDs with 18–32 km s-1 are roughly consistent with those predicted in the model of Hoeft and Gottlöber (2010) with the suppressed gas accretion to small DM halos due to the UV-heating. On the other hand, the baryonic mass of the same four void LSBDs appears too large in respect of extrapolated theoretical BTF relation from Trujillo-Gomez et al. (2010), which well describes the ‘common’ SDSS galaxies. These two findings do not match each other. This issue certainly needs a deeper analysis and comparison with the most updated simulations.
-
3.
In the close surroundings (12–13 kpc in projection) of the two studied void LSBDs J0723+3621 and J0852+1350, we found the faint blue LSBDs SDSS J0723+3622 and J0852+1351, with =24.36 and 23.18 mag arcsec-2. Their relative velocities are +89 km s-1 and +30 km s-1, respectively. The parameters of encounters for the two systems correspond to a prograde and a polar collision, respectively. The Hi data indicate significant gas exchange in the former pair.
-
4.
The , and colours in the outer regions of three of the five studied void galaxies derived from the photometry of their SDSS images, appear rather typical of other galaxies. They correspond to the PEGASE2 model track for the evolving stellar population with the continuous SF for ages of 5–13 Gyr (both Salpeter of Kroupa IMF). For J0737+4724 and the faint LSBD companion J0723+3622, the colours of the outer regions appear bluer, corresponding to the same tracks, but for ages of 1–2 Gyr. The combination of parameters O/H, the gas mass-fraction and the colours of the outer parts of galaxies indicates the slower rate of chemical evolution for all these LSBDs, and suggests a significant delay in the beginning of the main SF episode for galaxies J0723+3622 and J0737+4724.
-
5.
The discovery of new extremely metal-poor and/or ‘unevolved’ dwarf galaxies (J0723+3622, J0737+4724, J0852+1350) significantly extends the list of several such objects previously known as representatives of the Lynx-Cancer void (namely, DDO 68, SDSS J0926+3343, SDSS J0744+2508, SAO 0822+3545, SDSS J0812+4836). The very existence of such a numerous group gives an evidence for the significant concentration of unevolved objects within a relatively small cell of the nearby Universe. The void occupies 5 % of the volume of the sphere with R = 26 kpc, to which it belongs and contains almost all such known objects. This supports the idea on the specific role of voids in providing the most suitable conditions for the survival of unevolved galaxies on the cosmological timescale.
Acknowledgements
The main part of the paper was prepared during the stay of SAP in Paris, supported by the grant from the University of Paris-Diderot. SAP is also thankful to Observatoire de Paris (GEPI) for hospitality. The work on this project was supported through RFBR grant No. 10-02-92650 to SAP, and through RFBR grant No. 11-02-00261 to SAP and ALT. SAP and ALT acknowledge also the support of this work in the frame of the Russian Federal Innovation Program (contract No. 14.740.11.0901). AYK acknowledges support from the National Research Foundation of South Africa. SAP, ALT and AYK acknowledge the BTA Time Allocation Committee for the continuous support of this project at the SAO 6-m telescope. The authors thank A. Burenkov, D. Makarov and R. Uklein for help with BTA observations. SAP is grateful to A. Klypin for useful consultations on the results of recent N-body simulations from Trujillo-Gomez et al. (2010). SAP and JMM acknowledge the NRT Time Allocation Committee for the support of this program in 2009 and 2010. The authors acknowledge the spectral and photometric data and the related information available in the SDSS database used for this study. The Sloan Digital Sky Survey (SDSS) is a joint project of the University of Chicago, Fermilab, the Institute for Advanced Study, the Japan Participation Group, the Johns Hopkins University, the Max-Planck-Institute for Astronomy (MPIA), the Max-Planck-Institute for Astrophysics (MPA), New Mexico State University, Princeton University, the United States Naval Observatory, and the University of Washington. Apache Point Observatory, site of the SDSS telescopes, is operated by the Astrophysical Research Consortium (ARC). This research has made use of the NASA/IPAC Extragalactic Database (NED), which is operated by the Jet Propulsion Laboratory, California Institute of Technology, under contract with the National Aeronautics and Space Administration.
References
- Abazajian et al. (2009) Abazajian K.N., Adelman-McCarthy J.K., Agüeros M.A. et al., 2009, ApJS, 182, 543
- Afanasiev & Moiseev (2005) Afanasiev V.L., Moiseev A.V., 2005, Astron. Lett., 31, 193
- Arkhipova et al. (2007) Arkhipova N.A., Komberg B.V., Lukash V.N., Mikheeva E.V., 2007, Astr.Rep. 51, 787
- Begum et al. (2008a) Begum A., Chengalur J.N., Karachentsev I.D., Sharina M.E., 2008a, MNRAS, 386, 138
- Begum et al. (2008b) Begum A., Chengalur J.N., Karachentsev I.D., Sharina M.E., Kaisin S.S., 2008b, MNRAS, 386, 1667
- Bell et al. (2003) Bell E.F., McIntosh D.H., Katz N., Weinberg M.D., 2003, Ap.J.Suppl., 149, 289
- Blanton et al. (2005) Blanton M.B., Lupton R., Schlegel D.J., Strauss M.A., Brinkmann J., Fukugita M., Loveday J., 2005, ApJ, 631, 208
- Bohlin (1996) Bohlin R.C., 1996, AJ, 111, 1743
- Chengalur et al. (2006) Chengalur J.N., Pustilnik S.A., Martin J.-M., Kniazev A.Y., 2006, MNRAS, 371, 1849
- Cross & Driver (2002) Cross N., Driver S.P., 2002, MNRAS, 329, 579
- Dalcanton, Spergel & Summers (1997) Dalcanton J.J., Spergel D.N., Summers F.J., 1997, ApJ, 482, 659
- (12) Ekta, Chengalur J.N., Pustilnik S.A., 2008, MNRAS, 391, 881
- (13) Ekta B., Pustilnik S.A., Chengalur J.N., 2009, MNRAS, 397, 963
- Ekta & Chengalur (2010) Ekta B., & Chengalur J.N., 2010, MNRAS, 406, 1238
- Fioc & Rocca-Volmerange (1999) Fioc M., Rocca-Volmerange B., 1999, arXiv:astro-ph/9912179
- Fukugita et al. (1996) Fukugita M., Ichikawa T., Gunn J.E., Doi M., Shimasaku K., Schneider D.P., 1996, AJ, 111, 1748
- Garcia-Appadoo et al (2009) Garcia-Appadoo D.A., West A.A., Dalcanton J.J., Cortese L., Disney M., 2009, MNRAS, 394, 340
- Geha et al. (2006) Geha M., Blanton M.R., Masjedi M., West A.A., 2006, ApJ, 653, 240
- Gottlöber et al. (2003) Gottlöber S., Lokas E.L., Klypin A., Hoffman Y., 2003, MNRAS, 344, 715
- Gunn et al. (2003) Gunn J.E., Carr M.A., Rockosi C.M. et al., 1998, AJ, 116, 3040
- Guseva et al. (2009) Guseva N.G., Papaderos P., Meyer H.T., Izotov Y.I., Fricke K.J., 2009, A&A, 505, 63
- Hahn et al. (2007) Hahn O., Carollo C.M., Porciani C., Dekel A., 2007, MNRAS, 381, 41
- Hahn et al. (2009) Hahn O., Porciani C., Dekel A., Carollo C.M., 2009, MNRAS, 398, 1742
- Hoeft and Gottlöber (2010) Hoeft M., Gottlöber S., 2010, Advances in Astronomy, v.2010, Article ID 693968, 16 pp.
- Hoeft et al. (2006) Hoeft M., Yepes G., Gottlöber S., Springel V., 2006, MNRAS, 371, 401
- Izotov et al. (2006) Izotov Y.I., Stasinska G., Meynet G., Guseva N.G., Thuan T.X., 2006, A&A, 448, 955
- Izotov & Thuan (2007) Izotov Y.I., Thuan T.X., 2007, ApJ, 665, 1115
- Izotov et al. (2009) Izotov Y.I., Guseva N.G., Fricke K.J., Papaderos P., 2009, A&A, 503, 61
- Jarosik et al. (2011) Jarosik N., et al. 2011, ApJS, 192, 14
- Karachentsev et al. (2004) Karachentsev I.D., Karachentseva V.E., Huchtmeier W.K., Makarov D.I., 2004, AJ, 127, 2031
- Karachentsev et al. (2011) Karachentsev I.D., Makarov D.I., Karachentseva V.E., Melnik O.V., 2011, Astroph.Bull., 66, 1
- Karachentseva et al. (2010) Karachentseva V.E., Mitronova S.N., Melnik O.V., Karachentsev I.D., 2010, Astroph.Bull., 65, 1
- Kniazev et al. (2000) Kniazev A., Pustilnik S., Masegosa M. et al., 2000, A&A, 357, 101
- Kniazev et al. (2003) Kniazev A.Y., Grebel E.K., Hao L., Strauss M., Brinkmann J., Fukugita M., 2003, ApJ, 593, L73
- Kniazev et al. (2004a) Kniazev A.Y., Pustilnik S.A., Grebel E.K., Lee H., Pramskij A.G., 2004a, ApJS, 153, 429
- Kniazev et al. (2004b) Kniazev A.Y., Grebel E.K., Pustilnik S.A., Pramskij A.G., Kniazeva T.F., Prada F., Harbeck D., 2004b, AJ, 127, 704
- Kniazev et al. (2008) Kniazev A.Y., Zijlstra A., Grebel E.K. et al., 2008, MNRAS, 388, 1667
- Kreckel et al. (2011) Kreckel K., Platen E., Aragon-Calvo M.A., et al, 2011, AJ, 141, 4
- Kroupa et al. ( 1993) Kroupa P., Tout C.A., Gilmore G., 1993, MNRAS, 262, 545
- Lee et al. (2003) Lee H., McCall M.L., Kingsburgh R.L., Ross R., Stevenson C.C., 2003, AJ, 125, 146
- Lupton et al. (2001) Lupton R., Gunn J.E., Ivezić Z. et al., 2001, in: Harnden F.R., Jr., Primini F.A. , & Payne H.E., eds, Astronomical Data Analysis Software and Systems X, ASP Conf. Ser. 238, Astron. Soc. Pac., San Francisco, p. 269
-
Lupton et al. (2005)
Lupton R., et al. 2005,
http://www.sdss.org/dr5/algorithms
/sdssUBVRITransform.html#Lupton2005 - Manning (2002) Manning C., 2002, ApJ, 574, 599
- Manning (2003) Manning C., 2003, ApJ, 591, 79
- Martin et al. (2002) Martin J.-M., Gerard E., Colom P., Theureau G., Cognard I., in: SF2A-2002: Semaine de l’Astrophysique Francaise, meeting held in Paris, France, June 24-29, 2002, Eds.: Combes F. and Barret D., eds, EDP Sciences (Editions de Physique), Conference Series, p. 33
- Mathewson & Ford (1996) Mathewson D.S., Ford V.L., 1996, ApJS, 107, 97
- Matthews & Gallagher (1996) Matthews L.D., Gallagher J.S., 1996, AJ, 111, 1098
- Mattsson, Pilyugin and Bergvall (2011) Mattsson L., Pilyugin L.S., Bergvall N., 2011, MNRAS, 415L, 54
- Mihos, McGaugh & de Block (1997) Mihos J.C., McGaugh S.S., & de Block W.J.G., 1997, ApJ, 477, L79
- Moiseev, Pustilnik & Kniazev (2010) Moiseev A.V., Pustilnik S.A., Kniazev A.Y., 2010, MNRAS, 405, 2453
- O’Neil, Bothun & Schombert (1998) O’Neil K., Bothun G.D., Schombert J., 1998, AJ, 116, 2776
- Pagel et al. (1979) Pagel B.E.J., Edmunds M.G., Blackwell D.E., Chun M.S., Smith G., 1979, MNRAS, 189, 95
- Peebles (2001) Peebles P.J.E., 2001, ApJ, 557, 459
- Pier et al. (2003) Pier J.R., Munn J.A., Hindsley R.B., et al. 2003, AJ, 125, 1559
- Pustilnik & Martin (2007) Pustilnik S.A., Martin J.-M., 2007, A&A, 464, 859
- Pustilnik et al. (2001a) Pustilnik S.A., Brinks E., Thuan T.X., Lipovetsky V.A., Izotov Y.I., 2001, AJ, 121, 1413
- Pustilnik et al. (2002) Pustilnik S.A., Martin J.-M., Huchtmeier W., Brosch N., Lipovetsky V.A., Richter G., 2002, A&A, 389, 405
- Pustilnik et al. (2003) Pustilnik S.A., Kniazev A.Y., Pramsky A.G., Ugryumov A.V., Masegosa J., 2003, A&A, 409, 917
- Pustilnik, Pramskij & Kniazev (2004) Pustilnik S.A., Pramsky A.G., Kniazev A.Y., 2004, A&A, 425, 51
- Pustilnik et al. (2005) Pustilnik S.A., Kniazev A.Y., Pramskij A.G., 2005, A&A, 443, 91
- (61) Pustilnik S.A., Tepliakova A.L., Kniazev A.Y., 2008a, Astron.Lett., 34, 457
- Pustilnik et al. (2008b) Pustilnik S.A., Tepliakova A.L., Kniazev A.Y., Burenkov A.N., 2008b, Astrophys. Bulletin, 63, 102 (arXiv:0712.4205)
- Pustilnik et al. (2010) Pustilnik S.A., Tepliakova A.L., Kniazev A.Y., Martin J.-M., Burenkov A.N., 2010, MNRAS, 401, 333
- Pustilnik & Tepliakova (2011) Pustilnik S.A., Tepliakova A.L., 2011, MNRAS, 415, 1188 (Paper I)
- Pustilnik, Tepliakova & Kniazev (2011) Pustilnik S.A., Tepliakova A.L., Kniazev A.Y., 2011, Astrophys. Bulletin, 66, No.3, 255 (Paper II) (arXiv:1108.4850)
- Roberts (1969) Roberts M.S., 1969, AJ, 74, 859
- Rönnback & Bergvall (1995) Rönnback J., Bergvall N., 1995, A&A, 302, 353
- Schlegel, Finkbeiner, Douglas (1998) Schlegel D.J., Finkbeiner D.P., Douglas M., 1998, ApJ, 500, 525
- Schneider et al. (1986) Schneider S.E., Helou G., Salpeter E.E., Terzian Y., 1986, AJ, 92, 742
- Schombert et al. (2001) Schombert J.M., McGaugh S.S., Eder J.A., 2001, AJ, 121, 2420
- Shaver et al. (1983) Shaver P.A., McGee R.X., Newton L.M., Danks A.C., Pottasch S.R., 1983, MNRAS, 204, 53
- Smith et al. (2002) Smith J.A., Tucker D.L., Kent S., et al. 2002, AJ, 123, 2121
- Trujillo-Gomez et al. (2010) Trujillo-Gomez S., Klypin A., Primack J., Romanowsky A.J., 2010, ApJ, submitted (arXiv/1005.1289)
- Tucker et al. (2006) Tucker D.L., Kent S., Richmond M.W., et al. 2006, Astronomische Nachrichten, 327, 821
- Tully & Fouqué (1985) Tully R.B., Fouqué P., 1985, Ap.J.Suppl., 58, 67
- Tully et al. (2008) Tully R.B., Shaya E.J., Karachentsev I.D., Courtois H.M., Kocevski D.D., Rizzi L., Peel A., 2008, ApJ, 676, 184
- van de Weygaert et al. (2011) van de Weygaert R., Kreckel K., Platen E., et al. 2011, arXiv:1101.4187
- van Zee & Haynes (2006) van Zee L., Haynes M.P. 2006, ApJ, 636, 214
- van Zee et al. (2006) van Zee L., Haynes M.P. Skillman E., 2006, 637, 269
- West et al. (2009) West A.A., Garcia-Appadoo D.A., Dalcanton J.J., Disney M., Rockosi C.M., Ivezic Z., Bentz M.C., Brinkmann J., 2009, AJ, 139, 315
- York et al. (2000) York D.G., Adelman J., Anderson J.E., et al., 2000, AJ, 120, 1579
- Zackrisson, Bergvall & Östlin (2005) Zackrisson E., Bergvall N., Östlin G., 2005, A&A, 435, 29
- Zibetti et al. ( 2009) Zibetti S., Charlot S. & Rix H.-W., 2009, MNRAS, 400, 1181