22email: aweiss@mpa-garching.mpg.de
Helium burning in moderate-mass stars
Abstract
The evolution of low- and intermediate mass stars at the onset and during core helium burning is reviewed. Particular emphasis is laid on structural differences, which may allow to identify a star’s nature and evolutionary phase in spite of the fact that it is found in a region of the Hertzsprung-Russell-Diagram objects from both mass ranges may populate. Seismic diagnostics which are sensitive to the temperature and density profile at the border of the helium core and outside of it may be the most promising tool.
1 Mass ranges
In this talk I will be concerned with stellar models in the mass ranges usually called low and intermediate. While these two ranges are separated by a physical effect – the ignition of helium under degenerate plasma conditions – stars in both ranges share some properties, but within each mass range they also differ in others. Here, we are concentrating on stars which
-
•
are massive enough to ignite helium and had the time to reach the helium-burning stage within a Hubble-time, and
-
•
at helium ignition are not brighter than the tip of the red giant branch, i.e. have approximately .
These requirements limit the mass range of interest to about ; exact numbers, which are not needed here, would depend on composition. I call this mass range that of moderate-mass stars.
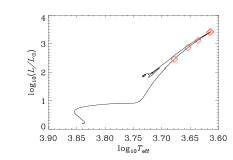
Before and during helium burning moderate-mass stars may be confused, as is demonstrated by the example of Fig. 1, which shows stars of 0.85, 3.0, and 5.0 before and during core helium burning. If the metallicity is not known accurately enough, a low-mass star (LMS) on its ascent on the RGB occupies roughly the same effective temperature and luminosity as a more metal-rich intermediate-mass star (IMS) of during core helium burning. Close to the tip of the RGB it crosses the evolution of a star before and shortly after helium ignition and again during early helium shell burning. In the following I will discuss the structural differences between such models, which occupy similar regions in the HRD.

2 Low-mass stars: the core helium flash
All of the following is based on traditional 1-dimensional, hydrostatic stellar evolution models, which have been calculated through their full evolution from the main-sequence into and past core helium burning; in particular the core helium flash is followed completely, which is possible with the GARSTEC code (Weiss & Schlattl, 2008) which I used. One should keep in mind that these models are still approximations to the real evolution, which is dynamic and multi-dimensional. Such models will be presented by M. Mocak (these proceedings).
The stability of nuclear burning depends mainly on the thermodynamic properties of the plasma, as can be shown with very simple arguments (following Kippenhahn & Weigert, 1990). If we denote a small perturbation to physical quantities by an index 1, we can write the equation of state in the following standard way
| (1) |
with and being the usual logarithmic derivatives with respect to and of density. For the energy generation rate we assume a power law, , and define
| (2) |
With
| (3) |
one can show that , i.e., if , nuclear burning is stable, while for it is unstable, and an exponential runaway will take place for small perturbations.
For a main-sequence star with almost ideal gas conditions, , , and thus and , such that . However, for a LMS near helium ignition, the helium electron gas is (non-relativistically) degenerate and dominating the equation of state. Therefore, and . and are thus and ; helium ignition is thermally unstable and a runaway takes place. This is the reason for the core helium flash.
In spite of its name, the flash starts very slowly and quite early on the RGB. Figure 2 demonstrates how the helium luminosity increases from values of at to peak values of (and above) at the tip. While the star needs 18 Myr from the first to the second point () at , already 3.3 Myr later is reached (basically at the tip), and a mere 180 yrs later the peak luminosity of is reached (the two final diamond symbols in Fig. 2 are at almost the same position). In this final phase the exponential runaway truly takes place.
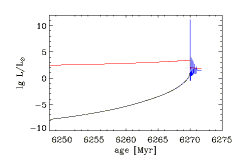
The right panel shows how increases during the final stages of the helium flash in comparison to the almost constant total luminosity. The approach to the horizontal branch (HB) is characterized by secondary flashes in the course of the heating of the core and the progression of helium burning from the off-centre ignition shell to the centre. These correspond to the small loops visible in the left plot of the same figure.
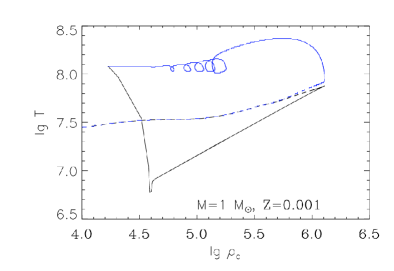
The ignition of helium happens off-centre because of three combined effects: (i) the helium core being inert, to first order it is isothermal, and its temperature defined by the hydrogen shell surrounding it. At the tip of the RGB, the shell temperature is ; (ii) as the core is growing in mass due to the progression of the hydrogen shell, thermal energy is released, since the core, being degenerate, is shrinking in radius and thereby matter is compressed; this creates a positive -gradient towards the centre; (iii) emission of plasma neutrinos is increasingly cooling the core, with two effects: the maximum temperature in the core is limited and helium ignition delayed, and the centre is cooler than outer regions of the core. In consequence, the temperature maximum is at some place outside the centre (typically around a relative mass of 0.1…0.2), but detached from the hydrogen shell. For higher masses, the core being not degenerate, is increasing towards the centre, and helium is ignited centrally, and at much lower helium core mass because of the lack of efficient neutrino cooling. The evolution of density and temperature at the centre and at the location of maximum temperature during the core helium flash is shown in Fig. 3.
The evolution along the RGB is, for LMSs, determined by the mass of the helium core. Simple homology considerations lead to the global relations
| (4) |
More detailed considerations, which include ––relations for degenerate structures lead to slightly different exponents. These qualitative relations are confirmed by numerical models. The consequence of (4) is that independent of total mass, all LMSs reach helium ignition temperatures at virtually the same core mass and therefore identical luminosities. This is the reason that the RGB-tip can serve as a standard candle.
On closer inspection, and at the RGB-tip do depend slightly on stellar parameters, but also on the input physics, and even on the numerical code used. Salaris & Cassisi (2005) give the following gross dependencies: (i) the core helium mass decreases with increasing metallicity by about , and with increasing total mass by (taking a typical range in and for old halo stars); (ii) the luminosity increases with by about 0.1 dex and to a lower degree with decreasing mass ( dex). Raffelt & Weiss (1992) give analytical fits to their numerical results:
| (5) |
( being the helium mass fraction in the envelope). These relations include the effect of mass loss along the RGB.
Recently, Cassisi (Workshop on The Giant Branches; Lorentz Center, Leiden, The Netherlands; 2009; see www.lorentzcenter.nl) showed model comparisons between different codes. The bolometric tip brightness differed by about 0.2 mag for a wide range of metallicities. With the input physics predefined, differences are about half as large, as Weiss (same meeting) demonstrated. Nevertheless, they are at least as important as the global stellar parameters mentioned above.
Updates in input physics have also been the reason for changes in the core mass and luminosity at the RGB-tip. Cassisi et al. (2007) investigated the influence of new conductive opacities and found an almost metallicity-independent decrease in of 0.03 dex for the TRGB, and 0.02 dex for the ZAHB (zero-age HB), when using the new opacities. New nuclear rates for the and reactions were tested by Weiss et al. (2005), both rates being now lower than older values. In the first case, luminosity increases by a small amount of dex (helium igniting later), while in the case of the CNO-bottleneck reaction it decreases by dex. This is one of the largest influences on tip quantities found so far.
An open question concerns the possibility of significant mixing episodes besides that by the convective envelope. C. Charbonnel reports about thermohaline mixing between the lower boundary of the convective envelope and the outer regions of the hydrogen burning shell, and M. Mocak (both these proceedings) about the possibility of mixing between core and envelope during the helium flash. So far, such mixing episodes were found only in extreme situations: either in metal-free LMSs (e.g. Schlattl et al., 2002) or in ordinary Pop. II stars with extremely thin envelopes (Cassisi et al., 2003).
After the core helium flash the next phase of low-mass stellar evolution is the (zero-age) horizontal branch, where the core helium burning takes place. The ZAHB luminosity is, within the errors, in agreement with observations, but differs between codes and depending on the implemented physics by about 0.05 to 0.1 dex in (Cassisi, The Giant Branches, 2009).

The stars burn helium in a convective core, and evolve, with increasing central CO-abundance and thus molecular weight, to higher luminosities. Whether in- or decreases initially, depends on the contribution of H- and He-burning to the total luminosity. At core helium exhaustion the tracks always turn towards cooler temperatures and up to start the early AGB evolution, unless the envelope mass is extremely low. I show three cases in Fig. 4, taken from Serenelli & Weiss (2005), which are the result of full flash calculations with different degrees of mass loss (according to the Reimers formula, characterized by the parameter ) along the RGB. With increasing mass loss, the envelope mass on the HB decreases and the stars settle down at increasingly hotter . The cases shown have HB masses of 0.847, 0.657, and , but, as we saw above, the same core mass. Complications arise due to the retreating convective core, which leaves behind a region of varying molecular weight, which gives rise to semiconvection, an ill-understood secular mixing process. Salaris & Cassisi (2005) describe a method how to treat this in stellar evolution programs. In the case shown in Fig. 4, standard convection and the Schwarzschild-criterion for convective stability was used. This treatment leads to so-called breathing pulses, which are episodes of convection outside the core that result in mixing of fresh helium into the core and the loops visible in the figure. These are most likely artificial effects which disappear, for example, when the Ledoux-criterion for convection is used, since this tends to inhibit convection.
The chemical profile hardly changes from the pre- to the post-flash phase. The helium core increases by at most a few 1/100 , with a very steep composition gradient being kept. The central carbon abundance increases to levels of 3-5% due to the -reactions taking place during the yrs it takes the star to settle down on the ZAHB. Stellar models, which are not followed through the flash, but where the calculations are stopped at the RGB-tip and resumed on the ZAHB, need to change the chemical composition in this respect to be reasonable approximations to full flash calculations (Serenelli & Weiss, 2005).
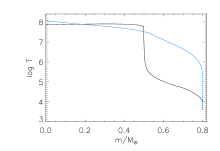
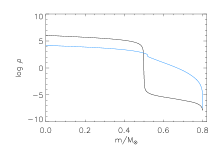
Since the main effect of the core helium flash is the lifting of degeneracy in the core by expansion and heating (see Fig. 3), the - and -profiles before and after ignition differ drastically (Fig. 5): Both are now monotonically decreasing and the very steep gradient at the helium core boundary has vanished almost completely (a small step in density is still discernible). Together with the change of a radiative to an adiabatic temperature gradient at the convective core boundary, seismology should be able to detect these differences, and therefore be able to discriminate between pre- and post-flash structures.
3 Intermediate-mass stars: quiescent helium ignition
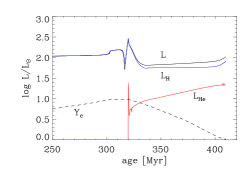
Figure 6 (left panel) displays the evolution of luminosities during the helium ignition in a star. In contrast to LMSs, rises only to moderate levels, which, after some adjustment phase are of the same order as those during the burning phase. The decrease in total luminosity , which is visible in the HRD of Fig. 1, is solely due to the reduction of the luminosity produced in the H-shell. The rise of from -2 to 0.6 during ignition takes 2 Myrs in this model. If one compares helium core sizes and luminosities during core helium burning between the and stars of Fig. 1, one finds that they differ by only resp. 0.8 dex. The general run of these quantities with mass can be found in Fig. 5.19 of Salaris & Cassisi (2005): Almost independent of metallicity it is nearly constant for (as discussed in Sect. 2), then drops over a rather narrow mass interval to values of about . The location and width of the drop depends on metallicity. With increasing mass it then increases almost linearly, reaching the low-mass values again around . Luminosity behaves in a very similar way, but low-mass values are reached again only at much higher mass. This is the reason why at the brightness level of the upper RGB only LMSs are to be expected.
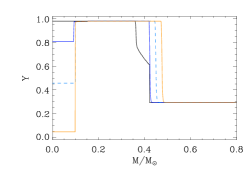
The right panel of Fig. 6 shows the helium profile in the inner of the same model for four stages (lines from top to bottom at left edge: black solid, blue solid, cyan dashed, orange solid): before ignition (), at and 0.458, and finally close to exhaustion (). The burning core is slightly growing in mass (the calculations were done without overshooting and with the Schwarzschild criterion), while the hydrogen shell is advancing by and steepening the chemical profile. In the HRD these phases are at the tip of the red giant phase, during the lower end of the short loop, and on the second red giant ascent.
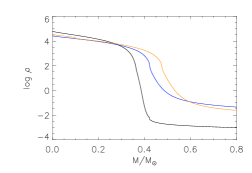
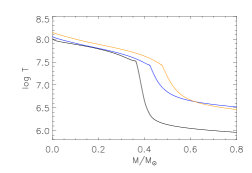
The temperature and density structure of the same model before, during and at the end of core helium burning is shown in Fig. 7, and should be compared to Fig. 5. The change is not as drastic as in the LMS, and the pre-ignition drop is much less pronounced. During and after core helium burning the profiles are more similar, but the curvature is different, and the IMS has a broader hydrogen shell. Note that in these figures the same mass range in absolute mass is shown. The outer parts of the star are not depicted.
A particular feature of IMSs during core helium burning are the blue loops, during which they cross the Cepheid intstability strip. These are very sensitive to the detailed structure of the star, in particular of the chemical profile, which is established during the main-sequence (Kippenhahn & Weigert, 1990). Differences in the appearance and extension of the loops arise from the treatment of overshooting, semiconvection and rotation.

Fig. 8 demonstrates this for a star and two different chemical compositions. Cases with overshooting included have generally higher luminosities during helium burning (as is the case also during the MS phase), but the loops tend to be reduced, which is quite obvious in the , case. Ignoring overshooting and employing the Schwarzschild criterion for convective instability it may happen that during the final phases of core helium burning regions outside the convective core become convective, too, and fresh helium is mixed into the core, rejuvenating the core and leading to a secondary loop in the HRD. There is an indication of this along the dashed line in the case, but it is quite evident in the solid-line track of the upper panel. Here, the “rejuvenation” was provoked by a reduced spatial resolution in the calculation. Notice that apart from this phase during the loop the two tracks with higher and lower numerical resolutions are indistinguishable. A general problem in up-to-date models is that below they do not display blue loops (see Fig. 1), while observed Cepheids, which can be identified with this phase, have luminosities as low as is appropriate for such masses. There is clearly improvement in the modeling of IMSs before and during helium burning.
4 Summary
Low- and intermediate-mass stars populate similar regions in the HRD before, during and after core helium burning. If and composition are accurately known, the LMSs can be identified as the cooler objects. If these parameters are not known, low-metallicity pre-flash LMSs may be confused with helium-burning IMSs of higher metallicity. During helium burning LMSs on the HB may also be found in the same HRD-region that is occupied by blue loops of IMSs.
The interior structure at the helium core boundary is clearly different between stars in these two mass ranges, with LMSs generally showing much steeper and gradients. This is particularly true for pre-flash objects. This opens the possibility for seismology to discriminate between them. If a LMS and an IMS occupy a similar position in the HRD, their masses should be quite different, such that also first-order seismic scaling laws should be able to discriminate between them. And finally, the IMS will have a convective core, while the low-mass pre-flash star will have a degenerate core.
Acknowledgements.
This work was supported by the Cluster of Excellence EXC 153 “Origin and Structure of the Universe”, Garching (http://www.universe-cluster.de).References
- Cassisi et al. (2007) Cassisi, S., Potekhin, A. Y., Pietrinferni, A., Catelan, M., & Salaris, M. 2007, ApJ , 661, 1094
- Cassisi et al. (2003) Cassisi, S., Schlattl, H., Salaris, M., & Weiss, A. 2003, ApJ Letters, 582
- Kippenhahn & Weigert (1990) Kippenhahn, R. & Weigert, A. 1990, Stellar Structure and Evolution, A&A Library (Heidelberg: Springer)
- Raffelt & Weiss (1992) Raffelt, G. G. & Weiss, A. 1992, A&A, 264, 536
- Salaris & Cassisi (2005) Salaris, M. & Cassisi, S. 2005, ”Evolution of Stars and Stellar Populations” (Chichester, UK: Wiley)
- Schlattl et al. (2002) Schlattl, H., Salaris, M., Cassisi, S., , & Weiss, A. 2002, A&A, 395, 77
- Serenelli & Weiss (2005) Serenelli, A. & Weiss, A. 2005, A&A, 442, 1041
- Weiss & Schlattl (2008) Weiss, A. & Schlattl, H. 2008, Ap&SS , 316, 99
- Weiss et al. (2005) Weiss, A., Serenelli, A., Kitsikis, A., & Schlattl, H. 2005, A&A, 441, 1129