The kinetic fragility of liquids as manifestation of the elastic softening
Abstract
We show that the fragility , the steepness of the viscosity and relaxation time close to the vitrification, increases with the degree of elastic softening, i.e. the decrease of the elastic modulus with increasing temperature, in universal way. This provides a novel connection between the thermodynamics, via the modulus, and the kinetics. The finding is evidenced by numerical simulations and comparison with the experimental data of glassformers with widely different fragilities (), leading to a fragility-independent elastic master curve extending over eighteen decades in viscosity and relaxation time. The master curve is accounted for by a cavity model pointing out the roles of both the available free volume and the cage softness. A major implication of our findings is that ultraslow relaxations, hardly characterised experimentally, become predictable by linear elasticity. As an example, the viscosity of supercooled silica is derived over about fifteen decades with no adjustable parameters.
pacs:
64.70.P-Glass transitions of specific systems and 62.20.deElastic moduli and 66.20.-dViscosity of liquids; diffusive momentum transport1 Introduction
Glassformers are classified in terms of their kinetic fragility, as quantified by the fragility index , where and denote the structural relaxation time and the glass transition temperature, respectively AngellJNCS91 . Fragility is a measure of the degree of departure from the Arrhenius scaled temperature dependence, which is weak for ”strong” glassformers and quite apparent for ”fragile” ones StilliDebe01 ; EdigerHarrowellJCP12 . It is worth noting that the terminology ”strong” and ”fragile” was introduced in relation to the evolution of the short-range order close to BerthierBiroliRMP11 . Different, often controversial, viewpoints concerning the link of fragility with structure, thermodynamics and dynamics have been reportedAngelNgai00 ; TarjusJPCM05 ; DudowiczEtAl08 ; NgaiBook ; BerthierBiroliRMP11 ; SokolovFragility13 ; RoyallWilliamsPhysRep15 ; EdigerHarrowellJCP12 ; McKennaFragilityThermodynJCP01 ; FragilityMauroSciRep15 .
Here, we argue that the fragility is related to the mechanical properties of the liquid, and the structural relaxation time (or viscosity ) is an universal function of the linear elastic modulus , irrespective of the kinetic fragility. Then, different fragilities just reflect different degrees of elastic softening, i.e. the decrease of the elastic modulus with increasing temperature, being weak for strong glassformers and more marked for fragile ones. This provides a connection between the thermodynamics, via , and the kinetics.
The present paper contributes to the living discussion on the role of elasticity and internal stresses in the structural relaxation of supercooled liquids. It has been proposed that structural relaxation in deeply supercooled liquids proceeds via the accumulation of Eshelby events, i.e. local rearrangements that create long-ranged and anisotropic stresses in the surrounding medium LemaitrePRL14 . Fragility and elastic softening have been correlated GranatoFragilityElasticityJNCS02 in the framework of the interstitialcy GranatoPRL92 and the conventional elastic DyreRevModPhys06 ; Nemilov06 models of the glass transition. Theoretical work supports the conclusion that glass elasticity affects the fragility of supercooled liquids WyartPNAS2013 , see also NovikovEtAl05 ; Novikov04 . An elastically collective nonlinear Langevin equation has been derived and successfully compared to van der Waals liquids by mapping real molecules to an effective hard sphere fluid SchweizerJPCLett13 ; SchweizerElastic1JCP14 ; SchweizerElastic2JCP14 . The approach has diminished quantitative accuracy when the fragility decreases. Recently, quantitative relations between cooperative motion, elasticity, and free volume have been found in model polymeric glass-formers DouglasStarrPNAS2015 .
Universal aspects of the caging effects in viscous liquids are central to the present results. Close to the glass transition, particles tend to be trapped in transient cages formed by their nearest neighbours with subsequent slowing down of their mean square displacement within time BerthierBiroliRMP11 . The particles rattle about in the cage on picosecond time scales with mean square amplitude and are later released with average escape time . Structural relaxation and cage rattling are correlated and one finds the universal master curve wolyNatPhys :
| (1) |
, and are suitable constants independent of the kinetic fragility. Eq.1 has been tested on experimental data wolyNatPhys ; OttochianLepoJNCS11 ; UnivPhilMag11 ; CommentSoftMat13 ; SokolovNovikovPRL13 and numerical models of polymers wolyNatPhys ; lepoJCP09 ; Puosi11 ; Puosi12SE , colloids DeMicheleDelGadoLepo11 and atomic liquids lepoJCP09 ; PuosiSpecialIssueJCP13 . The fast rattling motion of particles during the trapping periods in liquids has strong analogies with the oscillatory elastic behaviour of particles in crystalline and amorphous solids, a major difference being that liquids exhibit transient elasticity terminated by the structural relaxation Puosi12 .
In this paper we first characterize polymer melts with different fragilities by extensive Molecular-Dynamics (MD) simulations. We evidence that, irrespective of the fragility, the relaxation time exhibits the same scaling with the elastic modulus:
| (2) |
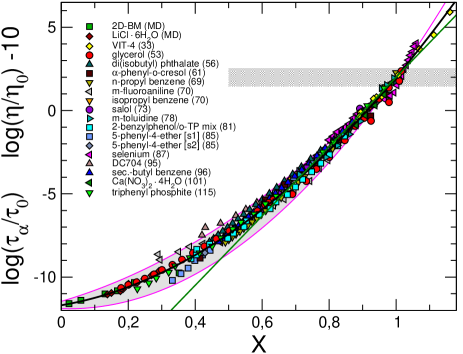
where , and are constants independent of the fragility. We show that the MD results do not support the assumption that the kinetic unit is embedded in an elastic continuum (EC) and develop a novel elastic model combining packing effects with elasticity. Furthermore, we reveal the elastic scaling in glassformers with intermediate and high fragilities () and collapse the experimental relaxation times (or viscosity) over about eighteen decades on a universal master curve given by Eq. 2 recast in terms of the reduced quantity:
| (3) |
where . Finally, to test the robustness of the scaling, we predict the viscosity of the strong glassformer SiO2 () by its linear elasticity with no adjustable parameters. We find excellent agreement over a range spanning about fifteen orders of magnitude where the viscosity exhibit deviations from the Arrhenius behaviour.
We compare our findings to the conventional elastic models of the glass transition DyreRevModPhys06 ; Nemilov06 . Their main result is:
| (4) |
where and are adjustable parameters. With respect to these models, we provide totally new insight (the fragility- independent scaling), fix known problems with fragile liquids Rouxel11 ; NelsonJCP09 and improve the agreement with the paradigmatic strong liquid SiO2 without any adjustable parameter.
2 MD simulations
We perform extensive molecular-dynamics (MD) simulations of a melt of fully-flexible linear chains of soft spheres (monomers, in total). The interacting potential between non-bonded monomers has the form
| (5) |
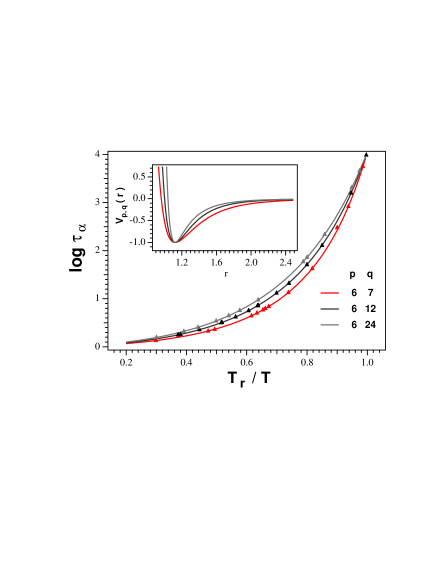
with . Changing the and parameters does not affect the position and the depth of the potential minimum but only the steepness of the repulsive and the attractive wings (see Fig.1 and Supplementary Information (SI)). The potential has adjustable anharmonicity which, according to studies on atomic liquids BordatNgai04 , is able to tune the kinetic fragility. Fig. 1 shows that this occurs for the polymer melt too. All quantities are in reduced units (Boltzmann constant ): length in units of , temperature in units of , and time in units of , where is the monomer mass. The potential is cut and shifted to zero by at . The bond length is . For each form of the potential several physical states are collected by changing the temperature , the number density and the number of monomers per chain . Further details about the MD simulation are given in SI where all the states characterised by their elasticity () are also listed.
The collective elastic dynamics is described by the transient elastic modulus of a volume , , being expressed by the correlation function Puosi12 :
| (6) |
is the off-diagonal component of the stress tensor:
| (7) |
where , , are the components of the velocity of the th monomer with mass , the force between the th and the th monomer and their separation, respectively. The symbol represents the canonical average. The monomer mean square displacement is defined as: , where is the position of the -th monomer at time , the sum runs over the total number of monomers. At early detrapping of the monomers from their cages occurs and the quantity shows a well-defined minimum ( is independent of the physical state in the present model) wolyNatPhys ; lepoJCP09 ; Puosi11 ; Puosi12SE ; PuosiSpecialIssueJCP13 . We define the mean square amplitude of the position fluctuations of the monomers in the cage as wolyNatPhys ; lepoJCP09 ; Puosi11 ; Puosi12SE ; PuosiSpecialIssueJCP13 ; DeMicheleDelGadoLepo11 :
| (8) |
One finds Puosi12 that in a time mechanical equilibration is reached, the total force on each particle vanishes, and the off-diagonal stress correlation function has reached the intermediate-time plateau setting the linear shear modulus:
| (9) |
The incoherent intermediate scattering function is defined as , being the q-vector of the maximum of the static structure factor LariniCrystJPCM05 ; PrevostoEtAl04 ; AndreozziEtAl98 ; AndreozziEtAl99 . The structural relaxation time is defined by the relation .
3 Results
3.1 Elastic scaling in simulations of a polymer melt.
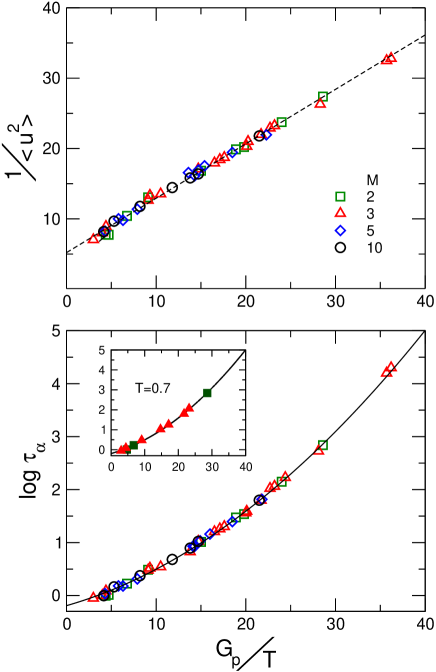
First, we investigate the relation between the mean square amplitude of the cage rattling and the elasticity in polymer systems with different fragility. It is known that does sense the fragility Ngai04 . Fig.2(top) summarises the results and evidences a fragility-independent master curve:
| (10) |
The two length scales and are nearly constant, most probably due to the limited changes of the local structures in virtue of the high packing of the investigated states HallWoly87 ; StarrEtAl02 ; BerniniJCP13 ; VoroBinarieJCP15 ; BarbieriGoriniPRE04 . This means that and depend on the density and the interacting potential - both affecting the fragility BordatNgai04 ; Sastry01 - and the temperature in much weaker way than the elastic modulus. This suggests that the fragility-dependence of occurs mainly via the elasticity.
Fig.2 (bottom) shows that the elastic scaling also collapses the relaxation time of polymer melts with different fragilities, e.g. see Fig.1, on a fragility-independent master curve. The insert shows that the scaling holds also under isothermal conditions and exposes the wide range of elastic moduli under consideration. The master curve in Fig.2(bottom) has the form of Eq.2 and is achieved by combining the best-fit of Eq.10 with Eq.1 without adjustment. Note that the master curve is not a straight line, namely it differs from the prediction of the conventional elastic models, Eq.4, confirming - as reported Rouxel11 ; NelsonJCP09 - that they face problems when dealing with fragile glassformers like the present simulated ones, see Fig.1.
Eq.10, cannot be rationalised within the picture of a particle embedded in an elastic continuum (EC). In fact, a particle embedded in EC with shear modulus undergoes position fluctuations with mean square amplitude given by DyreRevModPhys06 ; SchmidtEtAl97 ; VanZantenRufener00 ; Maradudin_DebyeModel ; Dyre04 :
| (11) |
where is comparable with the particle size. Fig.2(top) shows that Eq.11 is inadequate if applied to a particle trapped in a discrete environment. The disagreement is anticipated since Eq.11 relies on the affinity of the microscopic and the macroscopic displacements, a feature which breaks down in discrete systems DePablo04 ; Maloney06 ; BarratPRE09 ; Wallace72 . We present in Sec.3.2 a theoretical treatment which includes the microscopic discreteness of the system and correct Eq.11 to yield Eq.10. Before to start, it is worth noting that discreteness is apparent in the elastic response of the particle position if the elasticity is weak and is large. Instead, if the rigidity increases and tends to vanish, say , Eq.10 reduces to Eq.11. From this respect, we are in harmony with the microscopic single particle barrier hopping theory of glassy dynamics which in the same limit, dubbed ”ultralocal”, also derives Eq. 11 SchweizerUltraLocJCP07 ; note3 .
3.2 Elastic cavity model.
The inverse of the mean square rattling amplitude of the monomer in the cage is a measure of the average activation free-energy barrier for structural relaxation DyreRevModPhys06 ; HallWoly87 :
| (12) |
where is the average distance to get to the transition state (for the present polymer model , where the parameter is taken from ref. wolyNatPhys ). We interpret the barrier as the reversible work to bring about a local expansion and create a cavity with radius DyreRevModPhys06 :
| (13) |
It must be noted that, while the expansion occurs in any EC site with equal probability, the cavity nucleates only outside the particles in a discrete ensemble. This results in an entropic barrier which adds to the elastic one.
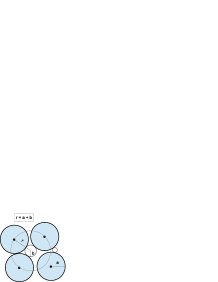
To estimate the effect, we consider the simplest discrete ensemble of particles, i.e. a liquid of hard spheres. In this case the work has been evaluated by Reiss et al. in the framework of the so called scaled particle theory (SPT) Lebowitz59 ; Lebowitz60 . SPT defines a cavity of radius as an empty domain being able to exclude the centers of other particles from a region of radius , see Fig.3. The insertion of a sphere of radius in a liquid of molecules with radius is equivalent to the creation of a cavity of radius Lebowitz60 . is conveniently written as:
| (14) |
where is the work to expand the cavity radius from to . The term is written by SPT as Lebowitz59 ; Lebowitz60 :
| (15) |
is the number density. The argument of the logarithm expresses the probability that the center of the cavity is located in the available space between the particles. For , SPT writes the term of Eq.14 as (see Eq. 1.8 of ref. Lebowitz60 ):
| (16) |
, are constants being set by requiring that the first and second derivatives of are continuous at (note that for , see Eq. 1.4 of ref. Lebowitz60 ), whereas is related to the external hydrostatic pressure. By neglecting the volume work against the external hydrostatic pressure (), a safe assumption for liquids under normal conditions, SPT expresses the limit form of for large cavities in terms of the surface work as Lebowitz59 ; Lebowitz60 :
| (17) |
is a planar surface free-energy, i.e. the interfacial tension between the bulk liquid and the cavity in the limit of infinite radius. The factor corrects the surface free-energy for the finite curvature of the interface, where is the Tolman length which is of the order of the thickness of the layer near the interface.
We propose to write the term in Eq. 14 as:
| (18) |
The term on the right hand side accounts for the elastic energy if the expansion is performed preserving local mechanical equilibrium Frenkel . Mechanical equilibration is completed in our polymer model in times shorter than , the time scale where the modulus and the position fluctuations are evaluated, see Sec.2. Eq.18 has the form of Eq.16 with and for large cavity, , recovers Eq. 17 with and .
By plugging Eq.15 and Eq.18 into Eq. 14 and resorting to Eqs.12 and 13 one recovers Eq.10 with:
| (19) | |||||
| (20) |
The EC limit is reached by setting (). In this case one approximates and Eq.11 is recovered.
The cavity model fits with the MD results far from the EC limit. To check this, we notice that the best-fit values of Eq.10 to the MD results (Fig.2top) correspond to and by taking as typical density (the radius compares well with the effective monomer radius estimated as in Ref.StarrEtAl02 ). Then, the local expansion involved in the relaxation, , is too small to be dealt with by the continuum picture (), see Fig.3.
Interestingly, the characteristic length , Eq.20, has been derived as SchweizerElastic09 :
| (21) |
with and one finds , to be compared with our best-fit value .
The cavity model interprets, via Eq.19, the characteristic length scale as due to packing effects, so that the mean square rattling amplitude in the cage is seen to be affected by both the local free volume and the cage softness. This remark suggests a simplified version of the cavity model. Suppose that the particle of radius is located in a cavity of radius ( must not be confused with the radius of the cavity involved in the local expansion, see Fig.1). The centre of the atom traces out a free volume ZimanBook ; LennardJonesDevonShire37 ; StarrEtAl02 . One expects that the rattling amplitude in the cage is proportional to HallWoly87 ; StarrEtAl02 ; DouglasStarrPNAS2015 :
| (22) |
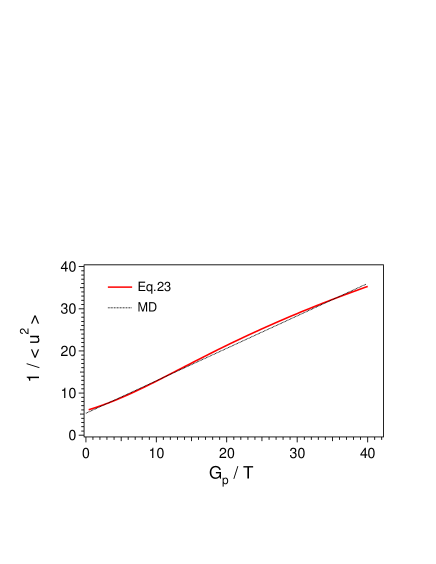
where is a constant and the subscript reminds that the average has to be intended at fixed . We take the cavity radius as a quantity elastically fluctuating around the average size on much slower time scale than the time needed by the trapped particle to rattle in the allowed free volume. Then, is a weighted average over the distribution of the cavity size:
| (23) |
where and is the elastic energy of a cavity with radius , Frenkel . Eq.23 takes into account that the fluctuations of the cavity size occur between the particle diameter and a quantity slightly larger, , due to high packing. Fig.4 compares the simplified model with the best-fit line of the MD results. The best-fit values of the model parameter comply with some expected constraints, namely and the inequalities .
The two models that we discussed are rather different from each other but they share the common assumption that the mean square rattling amplitude is affected by both the available free volume and the softness of the surroundings. The fact that both models consistently support Eq.10 suggests the robustness of this hypothesis and strengthen their interpretation of the characteristic length scale appearing in Eq.10 as a free-volume effect not accounted for by the EC description.
3.3 Experimental evidence of the elastic scaling.
We recast the MD master curve, Eq.2, in a scaled form by considering the reduced variable defined in Eq.3 ( is defined by the familiar relations s or Pas corresponding to in MD units wolyNatPhys ). We obtain:
| (24) |
where and are deemed to be universal constants and . and are derived as follows. From the best-fit of Eq.10 to the MD data (Fig2 top), and reminding that in MD units wolyNatPhys , one finds in MD units. Then, one finds with , . and are taken from Fig.2. The parameter is set so as to get at .
Fig.5 shows the elastic scaling and the comparison with the fragility-independent master curve, Eq.24, for several glassformers spanning a wide range of fragilities (, sources in SI). Note the most fragile glassformer, decaline, has DecalineFragility . The effectiveness of the elastic scaling reveals that, as it happens in MD simulations, the temperature dependence of and is highly correlated with the one of the elastic modulus.
Fig.5 compares the results also with the prediction of the conventional elastic models DyreRevModPhys06 ; Nemilov06 , Eq.4. It is seen that Eq.4 fits the scaled data around the glass transition () but departs when relaxation is faster in spite of two adjustable parameters (the slope and ).
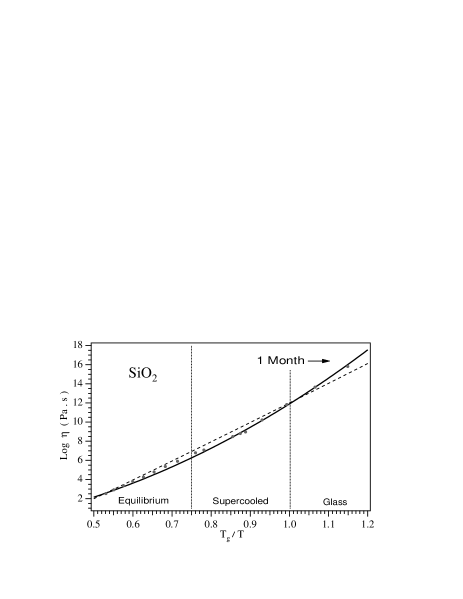
3.4 Prediction of the silica viscosity.
To assess the predictability of Eq.24, we evaluate the viscosity of the strong glass former SiO2 (fragility index ) on the basis of the sole elasticity data Rouxel11 . Then, we compare the result with the recommended viscosity values measured over a wide range of temperatures from the glassy state up to the equilibrium where the non-Arrhenius dependence becomes apparent DoremusSiO2 . The test is severe in that, up to now, both MD simulations and experimental data concern liquids with high and intermediate fragility, whereas silica is extremely strong. The results are in Fig.6. Apart from adding a vertical shift to Eq.24 by to ensure , no adjustment is done. We find excellent agreement over about fifteen decades from below up to liquid states. It is known that the conventional elastic models work well for strong glassformers Rouxel11 . However, in spite of the adjustable parameter ( is set by the constraint = 12), Eq.4 is unable to account for the non-Arrhenius dependence and exhibits larger deviations than our prediction.
4 Conclusions
Simulation results compared with relaxation data covering eighteen decades in glassformers with widely different fragilities () show that relaxation and linear elasticity scale to a fragility-independent master curve. The scaling allows to derive the viscosity of supercooled silica () over about fifteen decades with no adjustable parameters. The elastic scaling is related to the previously reported scaling between the fast mobility and the structural relaxation by a cavity model interpreting the rattling motion of a particle in the cage of the first neighbours as affected by both the available free volume and the softness of the cage. This picture appears to be robust.
The paper strongly suggests that the kinetic fragility just reflects the degree of elastic softening, i.e. the decrease of the elastic modulus with increasing temperature. This provides a connection between the thermodynamics, via , and the kinetics.
Acknowledgements.
S.Capaccioli and A. Ottochian are warmly thanked for several discussions. A generous grant of computing time from IT Center, University of Pisa and ® Dell Italia is gratefully acknowledged.References
- (1) C.A. Angell, J. Non-Cryst. Solids 131-133, 13 (1991)
- (2) P.G. Debenedetti, F.H. Stillinger, Nature (London) 410, 259 (2001)
- (3) M.D. Ediger, P. Harrowell, J. Chem. Phys. 137, 080901 (2012)
- (4) L. Berthier, G. Biroli, Rev. Mod. Phys. 83, 587 (2011)
- (5) C.A. Angell, K.L. Ngai, G.B. McKenna, P. McMillan, S.W.Martin, J. Appl. Phys. 88, 3113 (2000)
- (6) G. Tarjus, S.A. Kivelson, Z. Nussinov, P. Viot, J. Phys.: Condens. Matter 17, R1143 (2005)
- (7) J. Dudowicz, K.F. Freed, J.F. Douglas, Adv. Chem. Phys. 137, 125 (2008)
- (8) K.L. Ngai, Relaxation and Diffusion in Complex Systems (Springer, Berlin, 2011)
- (9) A.L. Agapov, V.N. Novikov, A.P. Sokolov, Fragility and other properties of glass-forming liquids: Two decades of puzzling correlations, in Fragility of glass forming liquids, edited by L.A. Greer, K. Kelton, S. Sastry (Hindustan Book Agency, 2013)
- (10) C.P. Royall, S.R. Williams, Phys. Rep. 560, 1 (2015)
- (11) D. Huang, G.B. McKenna, J. Chem. Phys. 114, 5621 (2001)
- (12) J.C. Martinez-Garcia, S.J. Rzoska, A. Drozd-Rzoska, S. Starzonek, J.C. Mauro, Sci. Rep. 5, 8314 (2015)
- (13) A. Lemaître, Phys. Rev. Lett. 113, 245702 (2014)
- (14) A. Granato, J. Non-Cryst. Solids 307-310, 376 (2002)
- (15) A. Granato, Phys. Rev. Lett. 68, 974 (1992)
- (16) J.C. Dyre, Rev. Mod. Phys. 78, 953 (2006)
- (17) S. Nemilov, J. Non-Cryst. Sol. 352, 2715 (2006)
- (18) L. Yan, G. Düring, M. Wyart, PNAS 110, 6307 (2013)
- (19) V.N. Novikov, Y. Ding, A.P. Sokolov, Phys.Rev.E 71, 061501 (2005)
- (20) V.N. Novikov, A.P. Sokolov, Nature 431(7011), 961 (2004)
- (21) S. Mirigian, K.S. Schweizer, J. Phys. Chem. Lett. 4, 3648 (2013)
- (22) S. Mirigian, K.S. Schweizer, J. Chem. Phys. 140, 194506 (2014)
- (23) S. Mirigian, K.S. Schweizer, J. Chem. Phys. 140, 194507 (2014)
- (24) B.A. Pazmiño Betancourt, P.Z. Hanakata, F.W. Starr, J.F. Douglas, Proc. Natl. Acad. Sci. USA 112, 2966 (2015)
- (25) L. Larini, A. Ottochian, C. De Michele, D. Leporini, Nature Physics 4, 42 (2008)
- (26) A. Ottochian, D. Leporini, J. Non-Cryst. Solids 357, 298 (2011)
- (27) A. Ottochian, D. Leporini, Phil. Mag. 91, 1786 (2011)
- (28) A. Ottochian, F. Puosi, C. De Michele, D. Leporini, Soft Matter 9, 7890 (2013)
- (29) V.N. Novikov, A.P. Sokolov, Phys. Rev. Lett. 110, 065701 (2013)
- (30) A. Ottochian, C. De Michele, D. Leporini, J. Chem. Phys. 131, 224517 (2009)
- (31) F. Puosi, D. Leporini, J.Phys. Chem. B 115, 14046 (2011)
- (32) F. Puosi, D. Leporini, J. Chem. Phys. 136, 211101 (2012)
- (33) C. De Michele, E. Del Gado, D. Leporini, Soft Matter 7, 4025 (2011)
- (34) F. Puosi, C. De Michele, D. Leporini, J. Chem. Phys. 138, 12A532 (2013)
- (35) F. Puosi, D. Leporini, J. Chem. Phys. 136, 041104 (2012)
- (36) T. Rouxel, J.Chem.Phys. 135, 184501 (2011)
- (37) D.H. Torchinsky, J.A. Johnson, K.A. Nelson, J. Chem. Phys. 130(6), 064502 (2009)
- (38) P. Bordat, F. Affouard, M. Descamps, K.L. Ngai, Phys. Rev. Lett. 93, 105502 (2004)
- (39) L. Larini, A. Barbieri, D. Prevosto, P.A. Rolla, D. Leporini, J. Phys.: Condens. Matter 17, L199 (2005)
- (40) D. Prevosto, S. Capaccioli, M. Lucchesi, D. Leporini, P. Rolla, J. Phys.: Condens. Matter 16, 6597 (2004)
- (41) L. Andreozzi, M. Giordano, D. Leporini, J. Non-Cryst. Solids 235-237, 219 (1998)
- (42) L. Andreozzi, M. Faetti, M. Giordano, D. Leporini, J.Phys.:Condens. Matter 11, A131 (1999)
- (43) K.L. Ngai, Phil. Mag. 84, 1341 (2004)
- (44) R.W. Hall, P.G. Wolynes, J. Chem. Phys. 86, 2943 (1987)
- (45) F. Starr, S. Sastry, J.F. Douglas, S. Glotzer, Phys. Rev. Lett. 89, 125501 (2002)
- (46) S. Bernini, F. Puosi, M. Barucco, D. Leporini, J.Chem.Phys. 139, 184501 (2013)
- (47) S. Bernini, F. Puosi, D. Leporini, J. Chem. Phys. 142, 124504 (2015)
- (48) A. Barbieri, G. Gorini, D. Leporini, Phys. Rev. E 69, 061509 (2004)
- (49) S. Sastry, Nature (London) 409, 164 (2001)
- (50) B. Schnurr, F. Gittes, F.C. MacKintosh, C.F. Schmidt, Macromolecules 30, 7781 (1997)
- (51) J.H. van Zanten, K.P. Rufener, Phys. Rev. E 62, 5389 (2000)
- (52) A.A. Maradudin, E.W. Montroll, G.H. Weiss, Theory of Lattice Dynamics in the Harmonic Approximation (Academic Press, New York, 1963)
- (53) J.C. Dyre, N.B. Olsen, Phys. Rev. E 69, 042501 (2004)
- (54) K. Yoshimoto, T.S. Jain, K.V. Workum, P.F. Nealey, J.J. de Pablo, Phys. Rev. Lett. 93, 175501 (2004)
- (55) C.E. Maloney, A. Lemaître, Phys. Rev. E 74, 016118 (2006)
- (56) M. Tsamados, A. Tanguy, C. Goldenberg, J.L. Barrat, Phys. Rev. E 80, 026112 (2009)
- (57) D.C. Wallace, Thermodynamics of Crystals (Wiley, New York, 1972)
- (58) K.S. Schweizer, G. Yatsenko, J. Chem. Phys. 127, 164505 (2007)
- (59) The ultralocal limit is expected to hold if the localisation length of the theory SchweizerUltraLocJCP07 ; SchweizerElastic1JCP14 . Since , this implies .
- (60) H. Reiss, H.L. Frisch, J.L. Lebowitz, J.Chem.Phys. 31, 369 (1959)
- (61) H. Reiss, H.L. Frisch, E. Helfand, J.L. Lebowitz, J.Chem.Phys. 32, 119 (1960)
- (62) J. Frenkel, Kinetic Theory of Liquids (Dover Publications, New York, 1955)
- (63) M. Tripathy, K.S. Schweizer, J. Chem. Phys. 130, 244906 (2009)
- (64) J.M. Ziman, Models of Disorder: The Theoretical Physics of Homogeneously Disordered Systems (Cambridge University Press, Cambridge, 1979)
- (65) J.E. Lennard-Jones, A.F. Devonshire, Proceedings of the Royal Society of London. Series A, Mathematical and Physical 163, 53 (1937)
- (66) L.M. Wang, V. Velikov, C.A. Angell, J. Chem. Phys. 117, 10184 (2002)
- (67) R.H. Doremus, J. Appl. Phys. 92, 7619 (2002)