A Study of Giant Radio Galaxies at RATAN-600
Abstract
We report the results of flux density measurements in the extended components of thirteen giant radio galaxies, made with the RATAN-600 in the centimeter range. Supplementing them with the WENSS, NVSS and GB6 survey data we constructed the spectra of the studied galaxy components. We computed the spectral indices in the studied frequency range and demonstrate the need for a detailed account of the integral contribution of such objects into the background radiation.
Key words: Radio lines: galaxies—techniques: radar astronomy
1 INTRODUCTION
According to the generally accepted definition, giant radio galaxies (GRGs) are the radio sources with linear sizes greater than 1 Mpc, i.e. the largest radio sources in the Universe. They mostly belong to the morphological type FR II [1] and are identified with giant elliptical galaxies and quasars. In comparison with normal galaxies, GRGs are quite rare. This makes their statistical study and a detailed research into the causes of their formation as a population quite difficult. They are the biggest objects in the visible universe, and it is possible that they could play a special role in the formation of the large-scale structure. Radio observations of GRGs allow to clarify what caused such gigantic objects to appear. Large dimensions of GRGs as well suggest that these sources must be at the last stages of evolution.
![[Uncaptioned image]](/html/1108.4490/assets/x9.png)
![[Uncaptioned image]](/html/1108.4490/assets/x10.png)
![[Uncaptioned image]](/html/1108.4490/assets/x11.png)
![[Uncaptioned image]](/html/1108.4490/assets/x12.png)
![[Uncaptioned image]](/html/1108.4490/assets/x13.png)
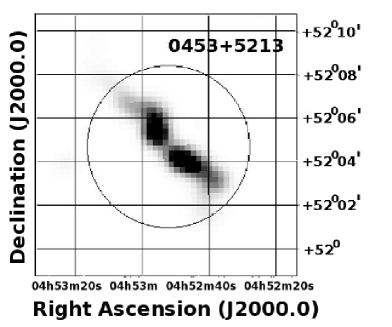
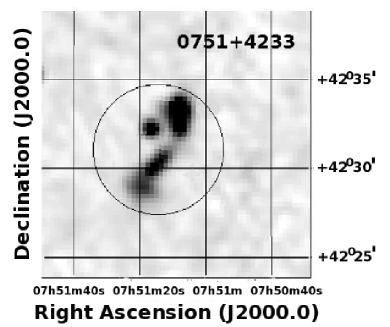
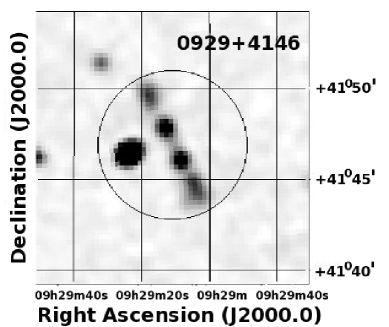
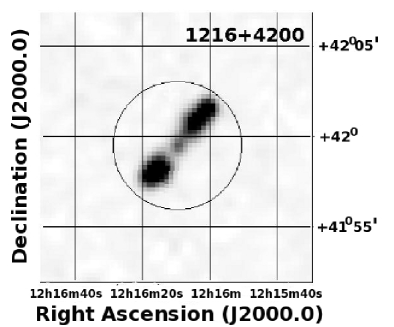
Fig. 1. (Contd.)
The study of these objects began with the source 3C 236 [2]. The models of radio sources [3],[4] predict temporal variations in the radio luminosity and linear sizes of giant radio sources. According to these models, GRGs should be very old objects (aged over yrs) that are presumably located in the environments with decreased matter density, as compared to the smaller sources with comparable radio luminosities [5]. Komberg and Paschenko [6] have analyzed the radio and optical data (SDSS, APM) for the radio galaxies and quasars, and concluded that apart from the effect of the environment, the giant sizes of radio sources can be attributed to the population of long-lived radio-loud active nuclei, which in turn can evolve into to GRGs. Multi-frequency observations [7] have shown that the spectral age of GRGs is longer than the one, expected from the evolutional models. As noted in [8], such radio galaxies may affect the processes of galaxy formation, since the pressure of gas, outflowing from the radio source, may compress the cold gas clouds thus initiating the development of stars on the one hand, and stop the formation of galaxies on the other hand. Several groups [9]-[18] continue to study the characteristics of GRGs, longing to explain their gigantic sizes. However, no unambiguous solution of this problem exists up to date.
| Source | Coordinates | Redshift | Type | Angular | Flux density |
| RA+Dec (J2000.0) | size, | (1.4 GHz), | |||
| hhmmss+ddmmss | arcmin | mJy | |||
| GRG 0139+3957 | 013930+395703 | 0.211 | II | 5.7 | 801.1 |
| GRG 0452+5204 | 045253+520447 | 0.109 | I | 9.7 | 2869.1 |
| GRG 0751+4231 | 075109+423124 | 0.203 | II | 6.0 | 162.3 |
| GRG 0912+3510 | 091252+351016 | 0.249 | II | 6.2 | 157.4 |
| GRG 0929+4146 | 092911+414646 | 0.365 | II | 6.6 | 165.5 |
| GRG 1032+2759 | 103214+275600 | 0.085 | II | 11.0 | 284.1 |
| GRG 1216+4159 | 121610+415927 | 0.243 | II | 5.2 | 415.5 |
| GRG 1343+3758 | 134255+375819 | 0.227 | II | 11.3 | 131.0 |
| GRG 1400+3017 | 140040+301700 | 0.206 | II | 10.8 | 451.9 |
| GRG 1453+3308 | 145303+330841 | 0.249 | II | 5.7 | 455.5 |
| GRG 1521+5105 | 152115+510501 | (0.37) | II | 4.3 | 1197.5 |
| GRG 1552+2005 | 155209+200524 | 0.089 | II | 19.6 | 2385.6 |
| GRG 1738+3733 | 173821+373333 | 0.156 | II | 6.5 | 236.0 |
| GRG 1918+516 | 191923+514334 | 0.284 | II | 7.3 | 920 |
| GRG 2103+6456 | 210314+645655 | 0.215 | II | 4.8 | 119.7 |
| Source | Section | Coordinates of center | |
| observed regions | |||
| GRG 0139+3957 | c | 013927.4+395653 | 1 |
| GRG 0452+5204 | c | 045343.7+520556 | 11 |
| GRG 0751+4231 | c | 075153.9+422945 | 10 |
| GRG 0912+3510 | n | 091252.0+351231 | 5 |
| GRG 0912+3510 | s | 091250.0+350631 | 1 |
| GRG 0929+4146 | c | 092951.8+414353 | 10 |
| GRG 1032+2756 | n | 103212.5+275925 | 3 |
| GRG 1032+2756 | c | 103214.4+275555 | 3 |
| GRG 1032+2756 | s | 103215.1+275115 | 1 |
| GRG 1216+4159 | c | 21641.4+415545 | 11 |
| GRG 1343+3758 | c | 134255.0+375819 | 2 |
| GRG 1400+3017 | n | 140045.0+302214 | 3 |
| GRG 1400+3017 | s | 140038.4+301325 | 3 |
| GRG 1453+3308 | n | 145302.0+331046 | 4 |
| GRG 1453+3308 | c | 145303.0+330856 | 2 |
| GRG 1453+3308 | s | 145301.4+330556 | 1 |
| GRG 1521+5105 | c | 152132.5+510232 | 7 |
| GRG 1552+2005 | c | 155209.0+200524 | 8 |
| GRG 1738+3733 | n | 173820.6+373658 | 2 |
| GRG 1738+3733 | c | 173821.0+373333 | 2 |
| GRG 1738+3733 | s | 173821.8+373108 | 1 |
| GRG 2103+6456 | c | 210322.1+645929 | 9 |
| Source | 2.7 cm | 3.9 cm | 6.25 cm | 13 cm | 92 cm | 21 cm | 6.2 cm |
| component | RATAN | RATAN | RATAN | RATAN | WENSS | NVSS | GB6 |
| 0139+3957w | – | – | 470 | 857 | – | 2120 | 656 |
| c | – | – | 139 | 252 | – | 744 | 317 |
| e | – | – | 82 | 212 | – | 133 | – |
| 0452+5204c | 417 | 827 | 1141 | 1984 | 18760 | 3003 | 844 |
| 0751+4231c | 103 | 227 | 274 | 476 | 1365 | 202 | 35 |
| 0912+3510n | – | – | 21 | 120 | 160 | 56 | 20 |
| s | – | – | 70 | 144 | 512 | 101 | 20 |
| 0929+4146c | – | – | 215 | 315 | 1560 | 200 | 91 |
| 1032+2759n | – | – | 46 | 120 | – | 92 | 20 |
| c | – | – | 35 | 120 | – | 75 | 59 |
| s | – | – | 86 | 108 | – | 138 | 56 |
| 1216+4159c | – | – | 123 | 207 | 1604 | 264 | 77 |
| 1400+3017n | – | – | 61 | 178 | 1258 | 333 | 73 |
| s | – | – | 40 | 155 | 1053 | 155 | 37 |
| 1453+3308n | – | – | 19 | 40 | 420 | 245 | 20 |
| c | – | – | 109 | 138 | 593 | 149 | 131 |
| s | – | – | 76 | 40 | 488 | 89 | 20 |
| 1521+5105c | – | – | 317 | 549 | 4903 | 747 | 377 |
| 1552+2005w | – | – | 82 | 212 | – | 133 | 20 |
| e | – | – | 139 | 252 | – | 744 | 317 |
| ee | – | – | 470 | 857 | – | 2120 | 656 |
| 1738+3733n | – | – | 36 | 56 | 152 | 64 | 20 |
| c | – | – | 46 | 113 | 720 | 117 | 93 |
| s | – | – | 29 | 30 | 133 | 58 | 20 |
| 2103+6456c | – | – | 54 | 180 | 337 | 124 | 32 |
In our recent work [19],[20], based on the analysis of radio spectra of giant radio galaxies we have come to the conclusion that the change in the spectral index of giant radio galaxies, depending on the shift with respect to the galactic center, noted earlier in [10] is linked with the particle energy variations in the components, caused by the pressure variation of the gas, flowing around, i.e. due to the changes in the medium depending on the distance from the host galaxy. However, general conclusions will be more significant at the integral approach to the GRG population as a whole. An essential step in the study of the causes of large sizes of giant radio galaxies is a comparative study of similar properties of “normal” radio galaxies [21]-[24]. Note that Soboleva [25] has earlier made the observations of radio galaxies with minute dimensions in the centimeter wavelength range with the RATAN-600, and discovered that the morphological structures have virtually identical spectral indices. Therefore, the study of the GRG sample objects will supplement the data on the radio spectra of this population of galaxies.
| Source | Radio spectrum |
|---|---|
| component | |
| 0139+3957w | |
| c | |
| e | |
| 0452+5204c | |
| 0751+4231c | |
| 0912+3510n | |
| s | |
| 0929+4146c | |
| 1032+2759n | |
| c | |
| s | |
| 1216+4159c | |
| 1400+3017n | |
| s | |
| 1453+3308n | |
| c | |
| s | |
| 1552+2005w | |
| e | |
| ee | |
| 1521+5105c | |
| 1738+3733n | |
| c | |
| s | |
| 2103+6456c |
| Source | Spectral index | Spectral index |
|---|---|---|
| component | 6.25 cm | 13 cm |
| 0139+3957w | –1.29 | –1.29 |
| c | –2.24 | –2.24 |
| e | –1.18 | –1.18 |
| 0452+5204c | –0.83 | –0.83 |
| 0751+4231c | –0.70 | –0.70 |
| 0912+3510n | –0.77 | –0.77 |
| s | –0.56 | –0.56 |
| 0929+4146c | –0.58 | –0.58 |
| 1032+2759n | –1.40 | –1.40 |
| c | –0.24 | –0.24 |
| s | –0.62 | –0.62 |
| 1216+4159c | –0.88 | –0.88 |
| 1400+3017n | –1.54 | –1.27 |
| s | –1.20 | –1.20 |
| 1453+3308n | –1.13 | –1.13 |
| c | –0.31 | –0.43 |
| s | –0.69 | –0.69 |
| 1521+5105c | –0.73 | –0.73 |
| 1552+2005w | –0.46 | –0.46 |
| e | 0.03 | –1.63 |
| ee | –1.00 | –1.00 |
| 1738+3733n | –0.57 | –0.57 |
| c | –0.80 | –0.80 |
| s | –0.56 | –0.56 |
| 2103+6456c | –0.92 | –0.92 |
![[Uncaptioned image]](/html/1108.4490/assets/x20.png)
![[Uncaptioned image]](/html/1108.4490/assets/x21.png)
![[Uncaptioned image]](/html/1108.4490/assets/x22.png)
![[Uncaptioned image]](/html/1108.4490/assets/x23.png)
![[Uncaptioned image]](/html/1108.4490/assets/x24.png)
![[Uncaptioned image]](/html/1108.4490/assets/x25.png)
![[Uncaptioned image]](/html/1108.4490/assets/x26.png)
Fig. 2. (Contd.)
GRGs are as well interesting to study the contamination of the microwave background due to their morphological properties (as well as their size, shape and orientation) in the pixel domain, or the phase characteristics in the harmonic domain [26]. While their apparent contribution in the background maps in the millimeter range seems to be weak, the angular sizes of sources (up to 10 minutes of arc) produce problems in the component separation due to the changes in the spectral index in the locations of extended radio components of galaxies. Therefore, one of the interesting problems is to evaluate and account for a possible contribution of GRGs to the background anisotropy, both their radiation in the millimeter range, and the effects, occurring in the component separation on the multipole scales in different frequency ranges.
In this paper, we present the results of measurements of the flux densities of giant radio galaxies at the centimeter and decimeter ranges based on the results of two observational sets at the RATAN-600.
2 RATAN-600 DATA
2.1 RATAN-600 Observations
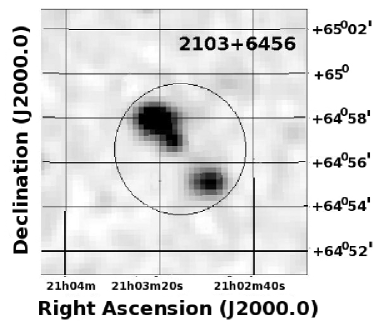
The initial GRG sample is selected based on the lists from [9]-[11] within the operational range of the RATAN-600. The observations of the GRGs were performed at the Northern sector of the RATAN-600 in the second decade of December 2008, and at the Southern sector in early January 2010. The continuous spectrum radiometers of the Feed Cabin 1 [27] were used at the 1.38, 2.7, 3.9, 6.25, 13 and 31 cm wavelengths. Note that despite the large range of wavelengths, the elevated noise conditions during the period of observations have restricted the data, suitable for the analysis to four bands only: 2.7, 3.9, 6.25 and 13 cm. The size of beam patterns in the central section at the observational elevation amounted to 25′′, 36′′, 43′′and 57′′, 90′′ and 119′′, respectively. For the wavelengths of 6.25 and 13 cm we used the spectral analyzer subchannels to effectively deal with the interference. The list of observed sources is given in Table 1, the log book—in Table 2. Note that for the galaxies GRG 1343+3758 and GRG 2103+64 we did not manage to reach a sufficient signal-to-noise ratio to be able to detect the sources.
Depending on the position angle of the radio structure, from one to three sections of the source have been made (Table 2). The number of object transits through the telescope’s beam pattern (BP) was limited by the observational time, granted by the program committee.
2.2 Data Reduction
To bind the flux densities with the international scale [28] we observed standard calibration sources from the RATAN-600 standard list [29],[30]. The curves of source transits were analyzed in the FADPS standard processing system [31],[32]. The first stage of data processing consists in subtracting the low-frequency trend with a window smoothing of 8 minutes of arc from the source transit records. A transition to flux densities was performed by integrating the extended signal, approximated by a set of Gaussians, and a transition to the flux density scale through calibration. The noise level in the records of single transits at the wavelengths of 1.38, 2.7, 3.9, 6.25 and 13 cm in the observations at the northern sector at the elevation of 76∘ amounted to 8.1, 5, 36, 3.3 and 65 mK/s1/2, respectively, while in the southern sector at the elevation of 82∘ it amounted to 17.2, 8.9, 18.1, 10.7 and 96.6 mK/s1/2, respectively. The measurements of flux densities at the wavelengths of 2.7, 3.9, 6.25 and 13 cm are given in Table 3. The table also lists the values of integrated flux densities of the studied sources, computed from the NVSS (NRAO VLA Sky Survey) maps [33] at 21 cm, constructed on the VLA radio interferometer (USA), and WENSS (Westerbork Northern Sky Survey) maps [34], constructed at the Dutch radio interferometer in Westerbork at 92 cm. The table as well gives the data from the GB6 (Green Bank) catalog [35]. Integration of the radio brightness distribution in the maps was carried out using an interactive image analysis package SkyView111http://www.ipac.caltech.edu/Skyview/ with a preliminary subtraction of the trend. For identifying the objects and making the estimates of their parameters we also used the CATS database [36],[37]. Among the CATS catalogs, we found the identifications in the GB6 [35], VLSS [38], 6C [39], 7C [40], 8C [41], Texas [42], and B3 [43] surveys.
One of the problems in observing the GRGs with the RATAN-600 is the evaluation of flux densities of multicomponent sources, where the components have close right ascensions, but different declination angles. In this case, the radio source is oriented coaxially (vertically, if projected on the plane) with the beam pattern in the observations at the meridian. Then, in each section there appears a contribution of different radio components of the source object due to an extended form of the beam pattern vertically. One way to restore the obtained signal is to simulate an extended source with more accurate data from the NVSS catalog, its convolution with the calculated beam pattern of the RATAN-600 and the calculation of the signal correction, caused by the confusion in the contributions of different components. This approach, applied in [19] gave a somewhat inflated estimate of the fluxes after the signal reconstruction, which may be due to inaccurate plotting of the source shape. Therefore, we used other estimates based on the additivity of the convolution operator. In this case, when the same beam pattern is used to observe two components of the source, separated by an angular distance , the observed flux density of one component, apart from the incoming flux , gets a part of the flux from the second component , where is the coefficient (the value from the antenna beam pattern), corresponding to a vertical shift from the center of the beam by the angular distance .
Hence, we find that a real signal from one component can be estimated as . This algorithm was used in the analysis of the GRG observations in several sections. The results are listed in Table 3.
The error in determining the flux densities in the RATAN-600 observations of the sources with flux densities greater than 50 mJy was about 10%, and for the flux densities below 50 mJy it amounted to 13% at the wavelength of 6.25 cm. Similarly, at 13 cm the error of 10% was found for the values greater than 180 mJy, and 15 %—for the flux densities below 180 mJy.
For the sources GRG 0452+5204 and GRG 0751+4231 at the wavelengths of 2.7 and 3.9 cm the observations were carried out in the “beam switching” mode. To take into account a possible flux density drop of an extended object when observed in this mode, we modelled the passage of two sources through two horns. The modelling procedure included: the calculation of a two-dimensional beam pattern of the RATAN-600 applying Korzhavin’s method [44] within the FADPS system [31] at the observed wavelength, convolution with the components of the observed source, and modelling the object transit through the RATAN-600 beam pattern. In addition, we also used in the data analysis the BP calculations made by Majorova [45]. The conversion factor estimate of the integral flux density of a given extended radio source in the beam switching mode model was accounted for in the analysis of real observations.
2.3 Spectra
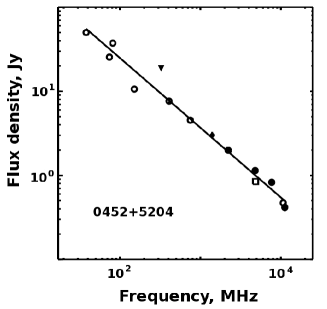
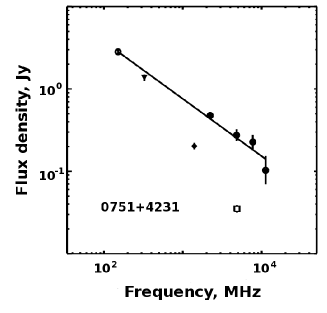
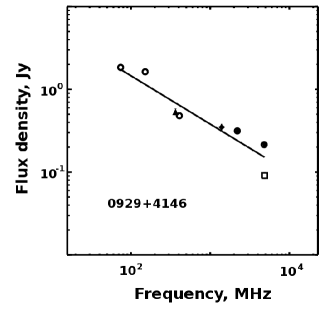
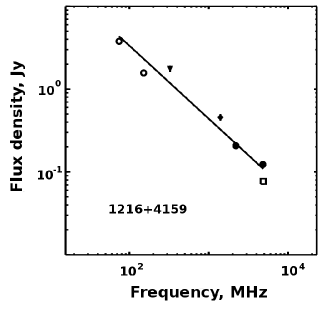
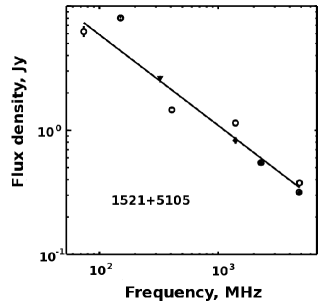
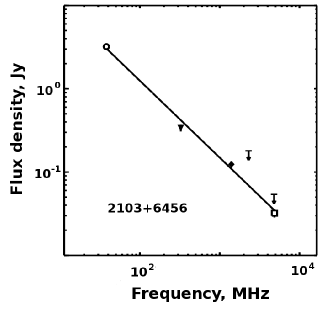
Based on the measurement data we have constructed the spectra of the radio source components. Describing the spectra, we fitted them by the formula , where is the flux density in Jy, is the frequency logarithm in MHz, and is one of the following functions: , or . The spg system was used for the spectral analysis [46]. The spectra of the components are demonstrated in Fig. 2. The analytical description of the continuous spectrum curves for the components of the studied GRGs is shown in Table 4.
3 DISCUSSION OF RESULTS
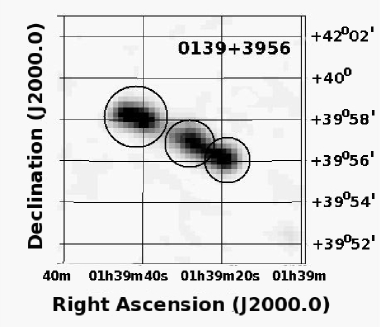
The spectra constructed (Fig. 2) demonstrate a variety of GRG properties. The fact that the spectral indices in the components of the observed radio galaxies vary significantly is obvious, even the shapes of the spectra are different: from a very steep spectrum of the GRG 0139+3957 source, to the spectra with flattening, like in the GRG 1453+3308 source component.
For the sources, observed only in the central section, the values of flux densities, measured at the wavelengths of 2.7, 3.9, 6.25 and 13 cm, are listed in Table 3, and spectral indices amount to the argument coefficients from Table 4. For the rest of sources the results are presented in Table 5. Note that in the case of the GRG 0751+4231 source spectrum the RATAN-600 data points are located higher than the data from the GB6 and NVSS. In the GB6 catalog this object is nearly a point object, which explains the low level of the cataloged flux value. It is most likely that the level of the corresponding value from the NVSS is caused by the same factor as in the case when the integration by peak values leads to an incomplete account of weak diffuse emission. The object GRG 1738+3733 stands out among the observed sources, as both of its extended components have similar radio spectra, and identical spectral indices.
Note that the change in the spectral index of giant radio galaxies, depending on the shift from the galactic center was already noted [10]. It is associated with particle energy variations in the components, caused by the pressure variation in the surrounding gas, i.e. it is due to the changes in the medium, depending on the distance from the host galaxy.
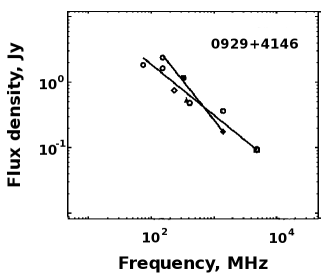
The radio source, observed on the RATAN-600 in the region of GRG 0929+4146 turned out to be composed of two radio galaxies: GRG 0929+4146 as such in the shape of a multidimensional object, stretching along one line, and a double type-FR II radio source with the coordinates (, ), which merge into one extended object that can be seen to the left of the GRG 0929+4146 in Fig. 1. The RATAN-600 does not resolve radio galaxies in the meridian transits, and hence Fig. 2 presents the total spectrum. We built a separate spectrum for each radio galaxy according to the NVSS, WENSS and 7C survey data (see Fig. 3). The integral radio spectrum of GRG 0929+4146 alone was approximated by the dependence , and the spectrum of the neighboring radio galaxy was approximated by the dependence , which has a smaller slope and thus demonstrates that the short-wave observations on the RATAN-600 are dominated by the radio emission from the source J092924+414618.
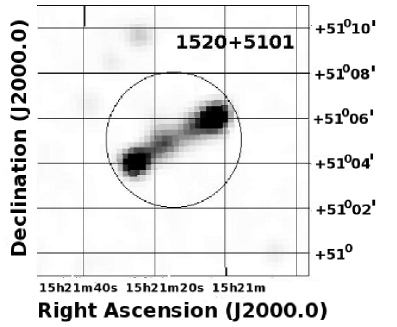
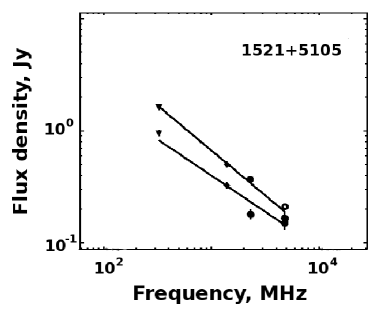
The radio galaxy GRG 1521+5105 was resolved into two components. Their spectra are demonstrated in Fig. 4. The integrated radio emission flux densities for the two components are: 368 mJy at the wavelength of 13 cm and 167 mJy at 6.25 cm for J152103+510600, and 181 mJy and 150 mJy, respectively for J152125+510401.
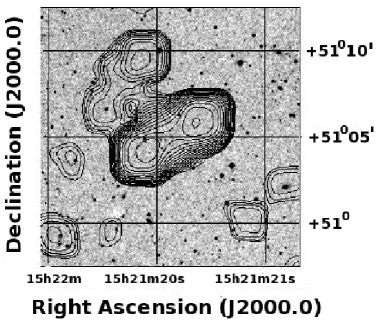
The approximations for the radio spectra of the components are described by the functions: and . The radio galaxy GRG 1521+5105, identified with the galaxy SDSS J152114.55+510500.9, and having the photometric redshift of (according to the NED database222http://nedwww.ipac.caltech.edu), is located on the outskirts of the projection of the cluster NSCS J152018+505306 with the redshift (NED) at the angular distance of 15 arc minutes from the center. Nevertheless, within 10 minutes of arc from the radio galaxy there are more than 1700 galaxies (according to the NED), and a large number of radio sources (Fig. 4). As we do not have any redshift data for the vast majority of them it is difficult to judge the physical belonging of GRG 1521+5105 to any group of galaxies. Still, a rich neighborhood of this radio galaxy brings additional interest to search for the reasons of its gigantic size.
The RATAN-600 observations allowed to specify the GRG component spectra and estimate their fluxes in the millimeter wavelength range at the extrapolation of the integrated radio spectrum. The flux densities of the studied GRG components lie in this part of the spectrum at the level above 0.6 mJy. As the expected number of GRG-type objects amounts to several hundred on the full sphere [26], their contribution to the background radiation can, in principle, result in a bias in computing the background fluctuation level, not to mention the problem of signal isolation.
We plan to further accumulate the data, compile the lists of new GRGs and perform their observations with the RATAN-600.
4 ACKNOWLEDGMENTS
The authors thank Yu. Sotnikova for her help with the RATAN-600 observations and S.A. Trushkin for valuable discussions. The study made use of the NED database of extragalactic objects, the NASA/IPAC Extragalactic Database, operated by the Jet Propulsion Laboratory, California Institute of Technology, under the contract with the National Aeronautics and Space Administration. The authors also used the CATS333http://cats.sao.ru [36],[37] database of radio astronomy catalogs, and the FADPS444http://sed.sao.ru/vo/fadps_e.html [31],[32] system for processing the radio astronomy data. This work was supported by the Leading Scientific Schools of Russia (S. M. Khaikin school) grant, and the RFBR grant (project nos. 09-02-92659-IND and 09-02-00298). O.V.V. is also grateful for the partial support of the Dynasty foundation.
References
- [1] B. L. Fanaroff and J. M. Riley, MNRAS 167, 31 (1974).
- [2] R. G. Strom and A. G. Willis, A&A 85, 36 (1980).
- [3] C.R. Kaiser, J. Dennett Thorpe, and P. Alexander, MNRAS 292, 723 (1997).
- [4] K. Blundell, S. Rawlings, and C.J. Willott, AJ 117, 677 (1999).
- [5] C.R. Kaiser and P. Alexander, MNRAS 302, 515 (1999).
- [6] B. L. Komberg, I. N. Paschenko, Astronomy Reports 53, 1086 (2009), arXiv:0901.3721.
- [7] K. H. Mack, U. Klein, C. P. O’Dea, et al. A&A 329, 431 (1998).
- [8] M. Jamrozy, J. Machalski, K. H. Mack, and U. Klein, A&A 433, 467 (2005).
- [9] A. P. Schoenmakers, K. H. Mack, A. G. de Bruyn, et al., A&AS 146, 293 (2000).
- [10] A. P. Schoenmakers, A. G. de Bruyn, H. J. A. Roettgering, and H. van der Laan, A&A 374, 861 (2001).
- [11] L. Lara, I. Marquez, W. D. Cotton, et al., A&A 378, 826 (2001).
- [12] L. Lara, G. Giovannini, W. D. Cotton, et al., A&A 421, 899 (2004).
- [13] L. Saripalli, R. W. Hunstead, R. Subrahmanyan, and E. Boyce, AJ 130, 896 (2005).
- [14] C. Konar, D. J. Saikia, C. H. Ishwara-Chandra, and V. K. Kulkarni, MNRAS 355, 845 (2004).
- [15] C. Konar, M. Jamrozy, D. J. Saikia, and J. Machalski, MNRAS 383, 525 (2008).
- [16] M. Jamrozy, C. Konar, J. Machalski, and D. J. Saikia, MNRAS 383, 525 (2008).
- [17] J. Machalski, M. Jamrozy, S. Zola, and D. Koziel, A&A 454, 85 (2006).
- [18] S. Nandi, A. Pirya, S. Pal, et al., MNRAS 404, 433 (2010), arXiv:1001.3998.
- [19] M. L. Khabibullina, O. V. Verkhodanov, M. Singh et al., Astron. Zh. 87, 627 (2010), arXiv:1009.4539.
- [20] M. L. Khabibullina, O. V. Verkhodanov, M. Singh et al., Astron. Rep. 55, 392 (2011), arXiv:1108.3295.
- [21] M. L. Khabibullina and O. V. Verkhodanov, Astrophys. J. Suppl. 64, 123 (2009), arXiv:0911.3741.
- [22] M. L. Khabibullina and O. V. Verkhodanov, Astrophys. J. Suppl. 64, 276 (2009), arXiv:0911.3747.
- [23] M. L. Khabibullina and O. V. Verkhodanov, Astrophys. J. Suppl. 64, 340 (2009), arXiv:0911.3752.
- [24] O. V. Verkhodanov and M. L. Khabibullina, Astron. Lett. 36, 7 (2010), arXiv:1003.0577.
- [25] N. S. Soboleva, Astrofiz. Issl. (Izvestiya SAO) 14, 50 (1981).
- [26] O. V. Verkhodanov, M. L. Khabibullina, M. Singh, et al., in Proc. Intern. Conf. Problems of Practical Cosmology, Ed. by Yu.V. Baryshev, I.N.Taganov, and P. Teerikorpi (Russian Geograph. Soc., St. Petersburg, 2008), p. 247.
- [27] N. A. Nizhelskii, A. B. Berlin, A. M. Pilipenko et al., in Proc. All-Russian Astroph. Conf. VAK-2001 (St. Petersburg, 2001), p.133.
- [28] J. W. M. Baars, R. Genzel, I. I. K. Pauliny-Toth, and A. Witzel, A&A 61, 99 (1977).
- [29] K. D. Aliakberov et al., Astrofiz. Issl. (Izvestiya SAO) 19, 60 (1985).
- [30] S. A. Trushkin, Spravochnik Nabliydatelia v Radiokontinyyme (Observer’s Guide in the Radio Continuum), http://w0.sao.ru/hq/lran/ /manuals/ratan_manual.html [in Russian].
- [31] O. V. Verkhodanov, B. L. Erukhimov, M. L. Monosov, et al., Bull. of the SAO 36, 132 (1993).
- [32] O. V. Verkhodanov, ASP Conf. Ser., 125, 46 (1997).
- [33] J. J. Condon, W. D. Cotton, E. W. Greisen, et al., AJ 115, 1693 (1998).
- [34] R. B. Rengelink, Y. Tang, A. G. de Bruyn, et al., A&AS 124, 259 (1997).
- [35] P. C. Gregory, W. K. Scott, K. Douglas, and J. J. Condon, ApJS 103, 427 (1996).
- [36] O. V. Verkhodanov, S. A. Trushkin, H. Andernach and V. N. Chernenkov, Bull. of the SAO 58, 118 (2005), arXiv:0705.2959.
- [37] O. V. Verkhodanov, S. A. Trushkin, H. Andernach, and V. N. Chernenkov, Data Science Journal 8, 34 (2009), arXiv:0901.3118.
- [38] A. S. Cohen, W. M. Lane, W. D. Cotton, et al., AJ 134, 1245 (2007).
- [39] S. E. G. Hales, C. R. Masson, P. Warner, et al., MNRAS 262, 1057 (1993).
- [40] J. M. W. Riley, E. M. Waldram, and J. M. Riley, MNRAS 306, 31 (1999).
- [41] S. E. G. Hales, E. M. Waldram, N. Rees, and P. J. Warner, MNRAS 274, 447 (1995).
- [42] J. N. Douglas, F. N. Bash, F. A. Bozyan, et al., AJ 111, 1945 (1996).
- [43] A. Ficarra, G. Grueff, and G. Tomassetti, A&AS 59, 255 (1985).
- [44] A. N. Korzhavin, Astrofiz. Issl. (Izvestiya SAO) 9, 71 (1977).
- [45] E. K. Majorova, Astrophys. J. Suppl. 65, 196 (2010).
- [46] O. V. Verkhodanov in Proc. of the 27 Radio Astron. Conf. Current Radio Astronomy Problems (IAA RAS, St. Petersburg, 1997), p. 322.