Signatures of Fractional Quantum Hall States in Topological Insulators
Abstract
The fractional quantum Hall (FQH) state is a topological state of matter resulting from the many-body effect of interacting electrons and is of vast interest in fundamental physics Tsui1982 ; Jain2000 . The experimental observation of topological surface states (SSs) in three-dimensional bulk solids has allowed the study of a correlated chiral Dirac fermion system, which can host a single Dirac valley without spin degeneracy Hasan2010 ; Hsieh2008 ; Hsieh2009 ; Roushan2009 ; Chen2009 ; Qu2010 ; Analytis2010 ; Xia2009 . Recent theoretical studies suggest that the fractional quantum Hall effect (FQHE) might be observable in topological insulators DaSilva2011 ; Moore2010 . However, due to the dominant bulk conduction it is difficult to probe the strong correlation effect in topological insulators from resistivity measurements Qu2010 ; Analytis2010 . Here we report the discovery of FQH states in Bi2Te3 from thermopower measurements. The surface thermopower is ten times greater than that of bulk, which makes possible the observation of fractional-filled Landau levels in SSs. Thermopower hence provides a powerful tool to investigate correlated Dirac fermions in topological insulators. Our observations demonstrate that Dirac topological SSs exhibit strongly correlated phases in a high magnetic field, and would enable studies of a variety of exotic fractional quantum Hall physics and other correlated phenomena in this newly discovered chiral Dirac system.
Topological insulators (TIs) are a new class of quantum states of matter with topologically protected conducting SSs, arising from the topology of the bulk electronic band structure Kane2005 ; Bernevig2006 ; Moore2007 ; Fu2007 ; Qi2008 . There are two distinguishing features of topological surface states. One is the existence of an odd number of Dirac cones on each surface, and the other is the helical spin arrangement Hsieh2009 ; Roushan2009 ; Xia2009 . Theoretically, the relativistic nature of Dirac fermions is believed to significantly modify the electron-electron interactions, with the possibility to produce more robust ground states at the Landau level (LL) in TIs than in conventional two-dimensional electron systems Goerbig2006 ; Yang2006 ; Apalkov2006 ; Toke2006 . The unique spin texture and the coexistence of non-insulating bulk states also raise the intriguing question of whether TIs may host exotic FQH states owing to the non-trivial Berry’s phase Fu2007 , huge Zeeman energy Liu2010 , and the screening effect from bulk carriers DaSilva2011 . The potential realization of more stable non-Abelian FQH states in TIs is of practical interest for topological quantum computing Moore2010 ; Nayak2008 .
There have been magnetoresistance measurements at and LLs in (Bi1-xSbx)2Se3 Analytis2010 and at and 5 LLs in Bi2Se2Te Xiong2011 . However, the sub-integer oscillations at LL in (Bi1-xSbx)2Se3 can only be resolved in the second-derivative trace and their best linear fit intersects the filling-factor axis at instead of , inconsistent with a Dirac spectrum. Such a property makes the exact origin of these oscillations unclear Analytis2010 . On the other hand, the FQHE in TIs is theoretically precluded in the LLs DaSilva2011 , suggesting the features in Bi2Se2Te unlikely to be ascribed to the FQHE. So far, transport studies of FQHE in TIs have been limited to samples with mobility below 3,000 cmVs and the SS conduction is susceptible to conducting bulk states.
To explore the existence of FQH states in TIs, we present thermoelectric measurements on the Bi2Te3 crystals. The surface mobility of these crystals is up to cmVs Qu2010 , comparable to the Hall mobility ( cmVs) of high quality graphene where the FQHE has been recently discovered Dean2011 . We first examined the dependence of thermopower on temperature in both metallic and nonmetallic samples (Fig. 1, insets). Though shows a low- peak in all these samples, the peak of the nonmetallic samples Q1 and Q2 is significantly stronger than that of the metallic sample M1. These observed peaks indicate the occurrence of phonon-drag effect that is expected to appear at K in high purity Bi2Te3 crystals Kittel1996 . It has been demonstrated that the phonon-drag thermopower from a two-dimensional (D) conducting layer on a three-dimensional (D) crystal can display giant quantum oscillations due to the phonon intra- and inter-LL scattering in the presence of a strong magnetic field. In such a D system, surface electrons are dragged by non-equilibrium D phonons of the whole specimen, while in a purely D system such as graphene, electrons of a wavevector can only interact with D phonons of a wavevector . In addition, the bulk thermopower is considerably suppressed due to the existence of two types of bulk carriers with opposite signs Qu2010 . Therefore, we expect that the magneto-thermopower of SSs is orders of magnitude larger than that of bulk in the high field limit. The thermopower measurement thus provides a powerful tool to elucidate the nature of the topological SSs that is difficult to be probed by the conductance measurement.
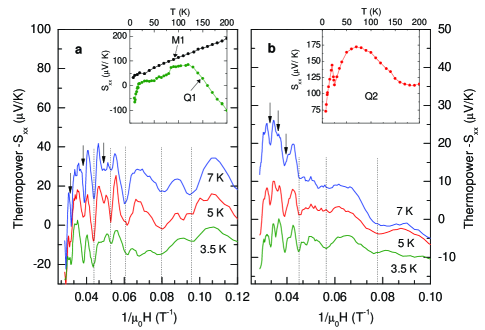
Figure 1, a and b, show the thermopower response versus the inverse magnetic field in samples Q1 and Q2, respectively. Large LL oscillations begin to emerge at T and their amplitude becomes smaller as decreases from to K. A prominent feature of these oscillations is that at T-1 sharp dips (black arrows) appear, with an aperiodic spacing smaller than the oscillating structure in the low field limit.
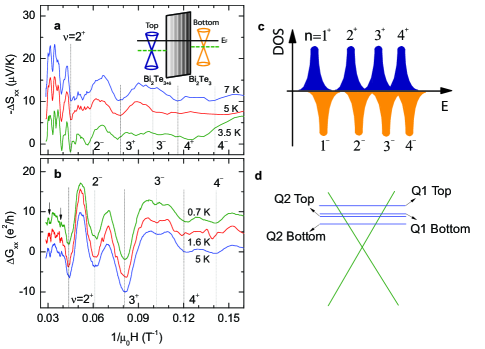
It is illuminating to compare the oscillations in and the Shubnikov-de Hass (SdH) effect in the conductance tensor , which was confirmed to arise from the 2D SSs in the previous study Qu2010 . As shown in Fig. 2, a and b, the extrema in coincide with the extrema in . This occurs because both ( for electron-like carriers) and peak when the Fermi level () aligns with each LL, whereas vanish when lies between LLs. Furthermore, we observe pronounced LL splitting near , 0.102, and 0.142 T-1 (gray dashed lines in Fig. 2b). This splitting indicates that the degeneracy is lifted between top () and bottom () surfaces. Similar effect has been seen in strained HgTe 3D TIs Brune2011 . Here, a weak Te composition gradient in Bi2Te3 breaks the inversion symmetry and generates displaced Dirac points (see the inset of Fig. 2a). By cleaving the crystal into bulk samples with a thickness m, we obtain slightly different surface carrier densities, which then leads to two sets of Landau filling factor in one piece of sample (Fig. 2c). Hence, we can pinpoint the top and bottom surface index fields and from the periodic spacing of strong (black dashed lines) and weak (grey dashed lines) minima in for sample Q2. Similar results were observed in sample Q1, with its bottom surface cleaved adjacent to the top surface of sample Q2. As shown below, the extracted bottom surface carrier concentration in Q1 is almost the same as the top surface carrier concentration in Q2. The Fermi energy levels relative to the Dirac point in samples Q1 and Q2 are sketched in Fig. 2d.
In terms of the carrier concentration on one surface, is related to by
| (1) |
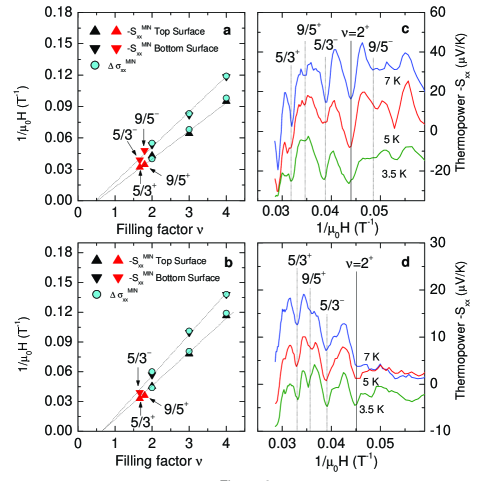
where is the magnetic flux quanta, Planck’s constant, the charge of electron, and the filling factor shift. A shift with corresponds to a conventional spectrum, whereas a deviation from the zero-shift with implies a Dirac spectrum. The arises from the LL at the Dirac point. In the following, we label the filling factors as , where indexes the top and bottom SSs. With the identified in both and , we plot them against integers (triangles and circles in Fig. 3, a and b). The slopes of the linear-fit to the data yield the carrier concentration () and () cm-2, with the Fermi wavevector and , for the top (bottom) SSs in samples Q1 and Q2, respectively. The linear-fit intercepts the axis at in Q1 and in Q2, consistent with a Dirac dispersion. Hence, we are again convinced that the D Dirac states give rise to the LL indexing shown in Fig. 2. Furthermore, the weak-field Hall anomaly provides an independent measurement of the average surface wavevector. The value of derived from surface Hall conductance is in reasonable agreement with the quantum oscillation analysis.
We then illustrate the fine structure of in the range of for samples Q1 and Q2 (Fig. 3, c and d). We observed narrow, reproducible minima at the fields (dashed lines) with . In addition to the minima at , a valley-like structure at is discernable in Q1, and the dip at becomes prominent in Q2 as the temperature decreases. As seen in Fig. 3, a and b, the fractional Landau fillings lie on a straight line with the integer ones. To examine the oscillating profiles of the most pronounced sub-integer structures, we plot the versus the filling factor calculated as (Fig. 4, a and b). The traces obtained at various are almost overlapped, and their minima are all located around (traces are displaced for clarity). Both features strongly suggest that the observed high-field structures are associated with the FQH states at LL. Based on the theory of theomopower in the QHE regime, a minimum in should accompany a minimum in thermopower. As shown in Fig. 2b (black arrows), two sub-integer dips are clearly resolved in with close to . Noting that for conventional 2D electron gas in the FQH regime, should be quantized with ()-1 at filling factor . Unfortunately, the present of the bulk conduction channel does not allow us to measure exact Hall magnitude. Even in most resistive TIs, Hall quantization is obscured by dominate bulk contribution and no quantized Hall plateaus have so far been observed.
In spite of the limited data set, we may roughly estimate the lower bound of the gap energy of the state () from the dependence of the thermopower and resistivity minima, both of which scale as . As shown in Fig. 2b and Fig. 3, c and d, the state persists until K, indicating K. This value is more than an order of magnitude larger than the corresponding gap () in the GaAs system with a much higher mobility Pan2008 , but comparable to the gap in graphene with a similar mobility Dean2011 . This is not surprising because the LL in the topological SSs is a mixture of the and 1 LLs in non-relativistic systems. It makes the FQH states in the LL in the Dirac system more robust than those in the GaAs system Apalkov2006 ; Goerbig2006 ; Yang2006 ; Toke2006 ; DaSilva2011 ; Bolotin2009 ; Du2009 . Compared with graphene, the surface states in Bi2Te3 has only one Dirac valley with no spin degeneracy, analogous to a completely four-fold degeneracy lifted graphene system where the FQH states do not mix between spin- and valley-bands. Moreover, the helical spin texture of topological SSs and the presence of conductive bulk states may lead to enhanced effective Coulomb interactions, rendering the FQH states even more robust in TIs DaSilva2011 .
We next extract the surface thermopower from the observed thermopower response. The measured thermopower tensor can be expressed as the sum,
| (2) |
where is the total resistivity tensor, with or , the bulk or surface thermoelectric conductivity tensor, and the bulk or surface conductivity tensor. Since , , , and for nonmetallic Bi2Te3 in the high-field regime, can be approximated as
| (3) |
where is the bulk thermopower and the surface conductance. The bulk thermopower only gives rise to a featureless background. The term can be obtained from the resistivity measurements. We find that the maximum magnitude of and in Q1 and Q2, respectively. From Eq. (3), we can extract the versus in Q1 and Q2 (Fig. 4, c and d, red curves). The peak magnitude of is in the range of mV K-1, which is more than an order of magnitude higher than that of the bulk V K-1 at K. Unlike conventional D systems where the thermopower magnitude roughly displays a linear field dependence Fletcher1986 , the surface thermopower at higher order LLs such as is comparable or even greater than that of lower LLs (). This giant oscillating magnitude and the specific field profile of the surface thermopower can be understood within the scenario of the D Dirac electron and D phonon interaction.
Because of the relativistic dispersion of topological surface states, the wave function of a Dirac electron in the th LL is the superposition of the th and th LL wave functions of a non-relativistic electron. The mixture nature of the wave function significantly modifies the electron-phonon matrix element in the LLs, leading to a thermopower profile different from an ordinary D system.
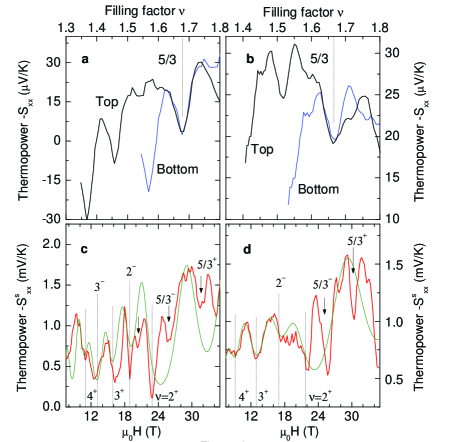
Using a general model given in ref. 29 and the wave function for topological SSs Liu2010 , we numerically simulate the thermopower induced by the integer Landau quantization in Q1 and Q2, with the phonon mean free path treated as a fitting parameter (Fig. 4, c and d, green curves). We include the average LL broadening width and meV for Q1 and Q2, respectively. The simple electron-phonon interaction model (Eq. S5) does not capture the fractional features, as FQHE is not included in the model. However, it reproduces the index field position and the oscillation magnitude from the integer Landau quantization. This suggests that the observed giant integer Landau oscillations can be explained by 2D Dirac fermion and 3D phonon interaction. A more comprehensive FQHE framework is needed to model the fractional-filling states in thermopower response.
By performing thermopower measurements, we have resolved fractional Landau quantization of SSs at and . The observed gap energy at the state is ten times larger than that of the non-relativistic electron systems. The demonstration of the FQH states in the topological surface bands opens the door to future studies of fractional quantum Hall effect physics in the topological insulator, which is expected to display strong correlation effects between chiral Dirac fermions.
The authors would like to thank N. P. Ong, F. D. Haldane, L. Fu, and C.-X. Liu for helpful discussion.
References
- (1) Tsui, D. C., Stormer, H. L. & Gossard, A. C. Two-dimensional magnetotransport in the extreme quantum limit. Phys. Rev. Lett. 48, 1559-1562 (1982).
- (2) Jain, J. K. The composite fermion: a quantum particle and its quantum fluids. Phys. Today 53 , 39-45 (2000).
- (3) Hasan, M. Z. & Kane, C. L. Colloquium: Topological insulators. Rev. Mod. Phys. 82, 3045-3067 (2010).
- (4) Hsieh, D. et al. A topological Dirac insulator in a quantum spin Hall phase. Nature 452, 970-974 (2008).
- (5) Hsieh, D. et al. Observation of unconventional quantum spin textures in topological insulators. Science 323, 919-922 (2009).
- (6) Roushan, P. et al. Topological surface states protected from backscattering by chiral spin texture. Nature 460, 1106-1109 (2009).
- (7) Chen, Y. L. et al. Experimental Realization of a Three Dimensional Topological Insulator, Bi2Te3. Science 325, 178-181 (2009).
- (8) Qu, D.-X. et al. Quantum oscillations and Hall anomaly of surface states in the topological insulator Bi2Te3. Science 329, 821-824 (2010).
- (9) Analytis, J. G. et al. Two-dimensional surface state in the quantum limit of a topological insulator. Nat. Phys. 6, 960-964 (2010).
- (10) Xia, Y. et al. Observation of a large-gap topological-insulator class with a single Dirac cone on the surface. Nature Phys. 5, 398-402 (2009).
- (11) DaSilva, A. M. The stability of the fractional quantum Hall effect in topological insulators. Solid State Communications 151, 1444-1446 (2011).
- (12) Moore, J. E. The birth of topological insulators. Nature 464, 194-198 (2010).
- (13) Kane, C. L. & Mele. E. J. Z2 topological order and the quantum spin Hall effect. Phys. Rev. Lett. 95, 146802 (2005).
- (14) Bernevig, B. A. & Zhang, S.-C. Quantum spin Hall effect. Phys. Rev. Lett. 96, 106802 (2006).
- (15) Moore, J. E. & Balents, L. Topological invariants of time-reversal-invariant band structures. Phys. Rev. B 75, 121306 (R) (2007).
- (16) Fu, L. & Kane, C. L. Topological insulators with inversion symmetry. Phys. Rev. B 76, 045302 (2007).
- (17) Qi, X.-L., Hughes, T. L. & Zhang, S.-C. Topological field theory of time-reversal invariant insulators. Phys. Rev. B 78, 195424 (R) (2008).
- (18) Xiong, J. et al. Quantum Oscillations in a Topological Insulator Bi2Te2Se with Large Bulk Resistivity (6 cm). arXiv:1101.1315v1, to appear in Physica E.
- (19) Brune, C. et al. Quantum Hall Effect from the Topological Surface States of Strained Bulk HgTe. Phys. Rev. Lett. 106, 126803 (2011).
- (20) Goerbig, M. O., Moessner, R. & Doucot, B. Electron interactions in graphene in a strong magnetic field. Phys. Rev. B 74, 161407 (2006).
- (21) Yang, K., Sarma, S. D. & MacDonald, A. H. Collective modes and skyrmion excitations in graphene SU(4) quantum Hall ferromagnets. Phys. Rev. B 74, 075423 (2006).
- (22) Apalkov, V. M. & Chakraborty, T. Fractional quantum Hall states of Dirac electrons in Graphene. Phys. Rev. Lett. 97, 126801 (2006).
- (23) Toke, C. et al. Fractional quantum Hall effect in graphene. Phys. Rev. B 74, 235417 (2006).
- (24) Liu, C.-X. et al. Model Hamiltonian for topological insulators. Phys. Rev. B 82, 045122 (2010).
- (25) Nayak, C. et al. Non-Abelian anyons and topological quantum computation. Rev. Mod. Phys. 80, 1083-1159 (2008).
- (26) Dean, C. R. et al. Multicomponent fractional quantum Hall effect in graphene. Nature Phys. 7, 693 696 (2011).
- (27) Kittel, C. Introduction to Solid State Physics (John Wiley & Sons, NY, 1996).
- (28) Fletcher, R. et al. Thermoelectric properties of GaAs-Ga1-xAlxAs heterojunctions at high magnetic fields. Phys. Rev. B 33, 7122 (1986).
- (29) Lyo, S. K. Magnetoquantum oscillations of the phonon-drag thermoelectric power in heterojunctions. Phys. Rev. B 40, 6458 (1989).
- (30) Pan, W. et al. Experimental studies of the fractional quantum Hall effect in the first excited Landau level. Phys. Rev. B 77, 075307 (2008).
- (31) Bolotin, K. I. et al. Observation of the fractional quantum Hall effect in graphene. Nature 462, 196-199 (2009).
- (32) Du, X. et al. Fractional quantum Hall effect and insulating phase of Dirac electrons in graphene. Nature 462, 192-195 (2009).