Back-action Induced Non-equilibrium Effect in Electron Charge Counting Statistics
Abstract
We report our study of the real-time charge counting statistics measured by a quantum point contact (QPC) coupled to a single quantum dot (QD) under different back-action strength. By tuning the QD-QPC coupling or QPC bias, we controlled the QPC back-action which drives the QD electrons out of thermal equilibrium. The random telegraph signal (RTS) statistics showed strong and tunable non-thermal-equilibrium saturation effect, which can be quantitatively characterized as a back-action induced tunneling out rate. We found that the QD-QPC coupling and QPC bias voltage played different roles on the back-action strength and cut-off energy.
A quantum point contact (QPC) nearby a quantum dot (QD) is widely used to perform electron charge counting, which is important in many aspects such as the read-out of electron charge- or spin-based qubits Petta-Charge-Qubit-DQD ; Delft-Single-Spin-Readout . However, the measurement with a QPC has inevitable side effects, known as the back-action Kouwenhoven-Backaction-Theory . For example, the back-action can drive the QD electrons out of thermal equilibrium, facilitating ground to excited-state transitions Ensslin-Backaction-eVqpc ; Ludwig-Backaction-QPC-Current , and possibly causing qubit relaxation and dephasing Weizman-Backaction-WhichPath . Thus, cautions have to be exercised to minimize the back-action, in order to use the QPC as a non-invasive read-out sensor.
However, back-action is usually indirect and hard to quantitatively analyze. In QDs the excited tunneling through higher-energy levels has been utilized to study back-actionKouwenhoven-Backaction-Theory ; Ensslin-Backaction-eVqpc ; Ludwig-Backaction-QPC-Current ; Gustavsson-Backaction-Terahertz . Here we found that we can relate the non-thermal-equilibrium effect in the charge counting statistics to back-action. This effect arises from the back-action induced tunneling directly out of the QD, without the help of excited levels. We developed a phenomenological model to quantitatively characterize the back-action strength. We also found the different contributions of the QD-QPC Coulomb coupling and QPC bias voltage. Especially we revealed that the back-action cut-off energy is proportional to the QD-QPC coupling, whereas independent of the QPC bias.
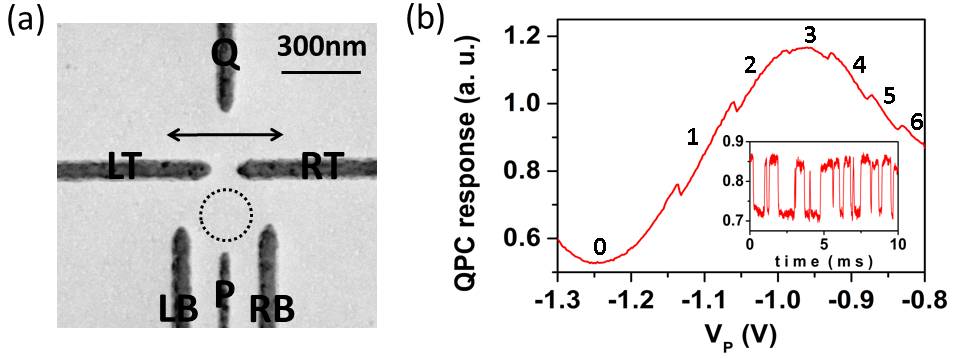
We fabricated a QD with a QPC on side in a GaAs/AlGaAs heterostructure. The two-dimensional electron gas (2DEG) is 95 nm below the surface. The 2DEG has a density of and a mobility of . Fig. 1 (a) shows the scanning electron microscopy (SEM) picture of the surface gates. Five gates LT, RT, LB, RB and P shaped the QD. Gate Q, along with LT and RT, formed a QPC channel to count the QD electron number via capacitive coupling. A small gap between LT and RT was created to maximize this coupling. The experiment was done in a Helium-3 refrigerator with base temperature of . We operate the QD in such a way that the left barrier is closed and the electrons only tunnel through the right barrier (tunneling rate conveniently controlled by gate RB). The voltages on LT and RT are set below pinch-off, so that no leakage tunneling to the QPC was found. Both the source and drain of the QD are grounded. A small dc bias is applied through the QPC channel. Fig. 1 (b) shows the QPC response while gate P is used to control the number of QD electrons. The insert is a trace of random telegraph signal (RTS) for the transition.
When studying the RTS statistics carefully, in some conditions we found large deviation from a thermal equilibrium picture. We studied all the last six electrons and found similar phenomena, except the complication of additional tunneling channels through spin excited levels for and only for the even electron numbers Ming-Backaction-SpinST . Here we focus on the transition which contains all the basic features without this complication . Fig. 2 (a) - (c) showed the RTS statistics with different QD-QPC gap opening (controlled by voltage ), including the and occupancy ratio , total tunneling rate , tunneling out rate , and tunneling in rate . In comparison we also showed the simulation of the RTS statistics for a thermally activated two-level switching in dotted lines Uren-RTS-Review :
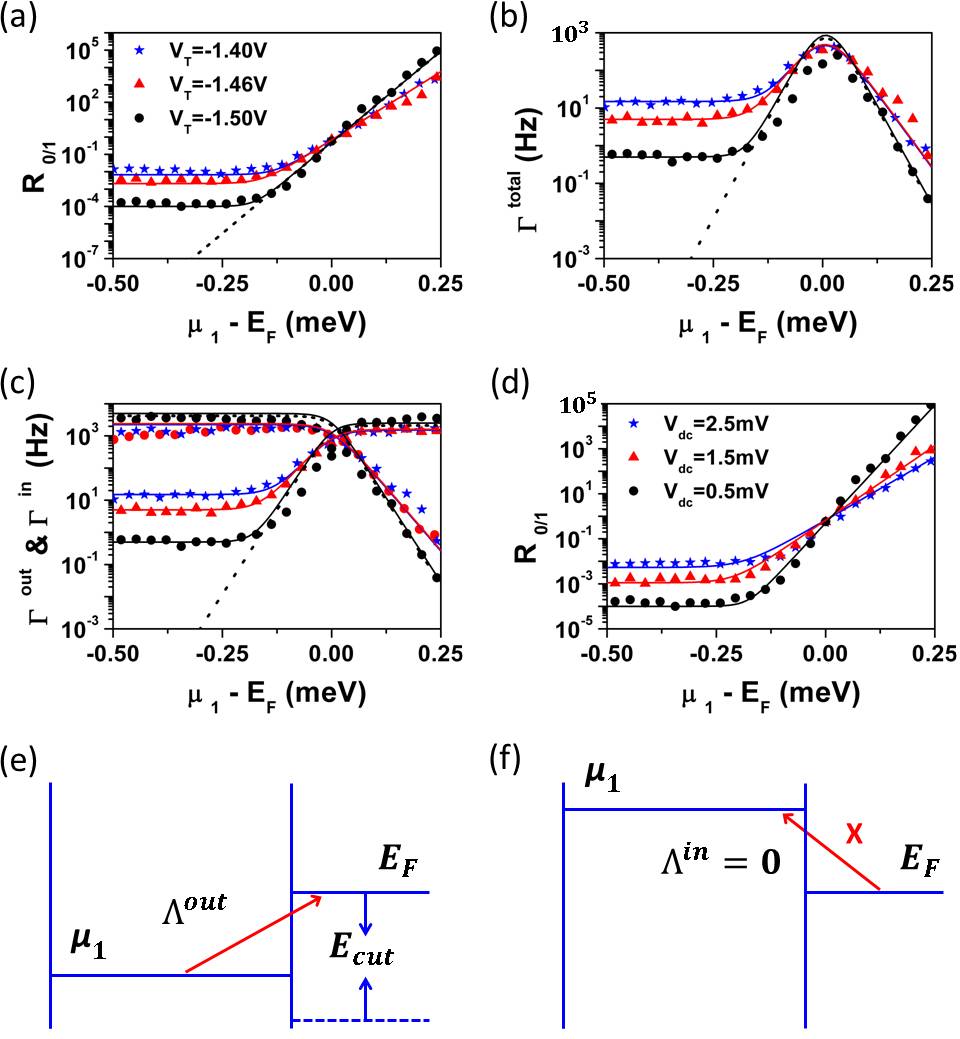
Here is the spin degeneracy; denotes the addition energy for the electron; Maximum tunneling rate where the electron density of energy and is the tunneling matrix element; is the Fermi distribution function. We used the energy-voltage conversion factor obtained in transport experiment and temperature 240mK read by a sensor.
Our data can be well described by the thermal equilibrium equations when . However, a deviation appears when , where the first electron is mostly trapped in the QD. should exponentially decay when drops below since the electron loses energy to tunnel out of the QD. Not as expected, we observed that saturates in this region. The same phenomena happens for the tunneling rates and , but not for . This saturation effect is found to increase with either the QD-QPC coupling or the QPC dc bias voltage. For example, in Fig. 2 (a) we see that when , starts to saturate when its value drops to , two magnitude larger than the saturation point under the condition. We also observed stronger saturation effect by increasing the QPC dc bias voltage , as shown in Fig. 2 (d).
Although not open enough to allow direct tunneling, the QD-QPC gap increases their coupling strength drastically. The RTS amplitude reaches as high as . Such huge coupling must mean strong back-action as well. Principally the back-action strength is determined by the QPC condition and QD-QPC interaction together. The former can be controlled by the QPC dc bias voltage Ensslin-Backaction-eVqpc ; Ludwig-Backaction-QPC-Current , and the latter can be controlled by voltage . So by increasing either or we introduce stronger back-action. The effect of back-action is illustrated in Fig. 2 (e) and (f). When is below , the QD should have been mostly filled with one electron. However, after receiving phonons emitted by the QPC, the electron gains energy and tunnels out. The outcome is that the QD empty occupancy increases and so does the ratio . This phonon-assisted tunneling remains there when is less than a certain cut-off energy Ludwig-Backaction-DQD . On the other hand, when is way above , the phonon doesn’t apparently assist the electrons to tunnel inside since the 2DEG is supposed to be a huge reservoir in thermal equilibrium. This explains why doesn’t show saturation effect. We developed a phenomenological model about the effect of back-action:
Here we introduced two extra tunneling rates and . They refer to the back-action driven tunneling out and in rates. Their values can be easily estimated from and in the extreme conditions: , when ; and , when . We can immediately tell two basic features: is invariant and is negligible. is constant since the saturation tails are flat, implying a constant phonon spectrum before a certain cut-off energy. is found to be at least two-magnitude less than and two more magnitudes smaller than the other tunneling rates so we can safely ignore it. We showed our simulation as solid lines in Fig. 2 (a) -(d). Good agreement with the experiment was found.
We summarized all the simulation results in table I. As or is increased, the back-action induced tunneling out rate shows observable increase. We use the percentage of on as a more objective measure since or alone could be affected in different experimental conditions. Table I shows that steadily increases from to as we increase alone, and from to as we apply larger bias . Hence, we think that serves as a sensitive quantitative measure of the back-action strength.
Also shown in Table I is that the electron temperature keeps warming up with , while only slightly increases with . When goes from to , the electron temperature nearly has no change although increases by three times. This difference may indicate different back-action mechanisms. As we know, the inelastic back-action could be either direct or indirect. The QPC current heats up the electron bath and emits high frequency quasi-particles such as acoustic phonons Ludwig-Backaction-QPC-Current . The partial re-absorption of these particles by the QD electrons causes indirect back-action. At large , the QPC current heats up the electron bath substantially and thus the indirect back-action could dominate. On the contrary, increasing the gap opening doesn’t cause severe heating. Instead it increases the direct QD-QPC Coulomb coupling strength efficiently. In this case the direct back-action should prevail. In general, both the indirect and direct back-action should exist.
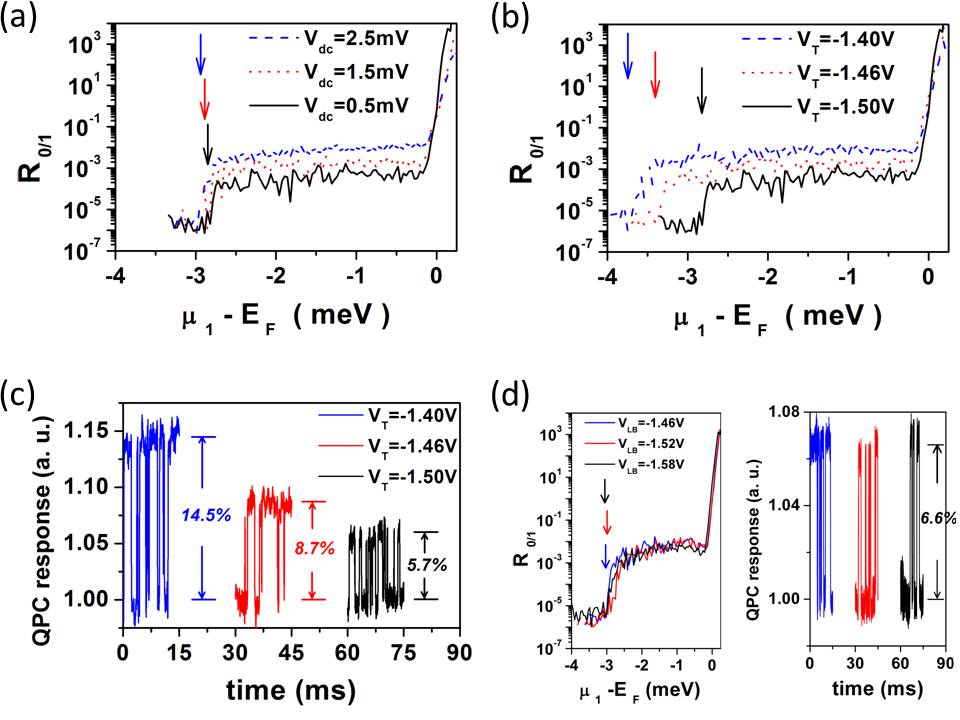
Another difference is in the cut-off energy , beyond where the saturation effect suddenly relieves. Fig. 3 (a) - (b) show in a large energy scale for varying or . We determined as where drops to since we only take data points. The results are listed in the last column of Table I. shows very small change (between and ) with , and increases dramatically (from to ) for increasing . In both cases, the observed is much larger than . Since is the maximum single phonon energy the QPC emits Kouwenhoven-Backaction-Theory ; Ensslin-Backaction-eVqpc , in our system there must involve multi-phonon absorption process Ludwig-Backaction-DQD . And the independence on indicates that is not limited by the number of phonons to absorb. Instead, from its increase with , we conclude that has to do with the QD-QPC coupling strength. We found that effectively and exclusively controls the QD-QPC coupling. Fig. 3 (c) shows that with less negative the RTS amplitude, an indicator of the coupling strength, increases quickly. On the contrary, the other gate voltages such as changes neither the coupling strength nor the cut-off energy, as shown in Fig. 3 (d). Thus we suspect that depends on through the QD-QPC coupling strength. However, at this moment we can not analytically determine this dependence. It may need further theoretical models, especially which incorporate multi-phonon process, to explicitly determine the cut-off energy.
In conclusion, we found that the non-equilibrium effect in QPC charge counting statistics is a benchmark of its back-action. We gave a quantitative measure of the back-action strength. This paved a way for further study, such as the back-action driven spin excitations Ming-Backaction-SpinST .
This work was supported by the NFRP 2011CBA00200 and 2011CB921200, NNSF 10934006, 11074243, 10874163, 10804104, 60921091.
References
- (1) K. D. Petersson, et. al., Phys. Rev. Lett. 105, 246804 (2010).
- (2) J. M. Elzerman, et. al., Nature 430, 432 (2004).
- (3) R. Aguado and L. P. Kouwenhoven, Phys. Rev. Lett. 84, 1986 (2000).
- (4) S. Gustavsson, et. al., Phys. Rev. Lett. 99, 206804 (2007).
- (5) V. S. Khrapai, et. al., Phys. Rev. Lett. 97, 176803 (2006).
- (6) E. Buks, et. al., Nature 391, 871 (1998).
- (7) S. Gustavsson, et. al., Phys. Rev. B 78, 035324 (2008).
- (8) G. Cao, et. al., arXiv:1109.5734v1 (2011).
- (9) M. J. Kirton and M. J. Uren, Adv. Phys. 38, 367 (1989).
- (10) D. Harbusch, et. al., Phys. Rev. Lett. 104, 196801 (2010).