Portfolios and the market geometry
Abstract
A geometric analysis of the time series of returns has been performed in the past and it implied that the most of the systematic information of the market is contained in a space of small dimension. Here we have explored subspaces of this space to find out the relative performance of portfolios formed from the companies that have the largest projections in each one of the subspaces. It was found that the best performance portfolios are associated to some of the small eigenvalue subspaces and not to the dominant directions in the distances matrix. This occurs in such a systematic fashion over an extended period (1990-2008) that it may not be a statistical accident.
Keywords: Return correlations, Market geometry, Portfolios
1 Introduction
Correlations in return fluctuations of market securities play an important role in the analysis of market structure [1], forecasting and portfolio theory. The quantity
| (1) |
where is the correlation coefficient of two (return) time series and
| (2) |
(), has been shown [2] to satisfy all the metric axioms. Hence it may be used as a basis to develop a geometrical analysis of the market structure. Such an analysis has been performed in Ref.[3]. Given a matrix of distances, obtained from (1), for a set of time series in a time window, one obtains coordinates in compatible with these distances. For that time window the returns of the companies are now represented by a set of points in . Assigning to each point a mass proportional to the market capitalization, the center of mass and the center of mass coordinates are obtained. Then the tensor
| (3) |
is diagonalized to obtain the set of eigenvalues and normalized eigenvectors {}. The eigenvectors define the characteristic directions of the set of stocks. The same analysis is performed for random and time permuted data and the relative behavior of the eigenvalues is compared. Having carried out this analysis for the companies in the Dow Jones and SP500 indexes [3] [4] the following conclusions were obtained:
1 - The eigenvalues decrease very fast and soon become indistinguishable from those obtained from random data. It means that the systematic information related to the market structure is contained in a reduced subspace of low dimension. From the extensive amount of data that was analyzed (ranging from 70 to 424 stocks) one concludes that the dimension of this subspace is at most six.
2 - The characteristic directions in the reduced subspace do not in general correspond to the traditional industrial sectors, mixing companies of many different sectors, thus showing the interlocked nature of the market. The characteristic directions provide a natural basis for a model of market factors.
3 - Carrying out the geometric analysis over many different periods, some noticeable differences were found between business-as-usual and crisis periods. During market crisis there is a contraction of volume in the reduced space. It corresponds to a greater synchronization of the market fluctuations. In addition, whereas the geometric ”market cloud” of points in business-as-usual periods looks like a smooth ellipsoid, during some crisis it displays distortions, which may be detected by computing higher moments of the distribution. Whether these distortions appear sufficiently ahead of the crisis to act as precursors is still an open question.
The question that is addressed in this paper is whether the geometric market structure and the characteristic dimensions have any bearing on the construction of portfolios. From the geometric analysis we have seen that part of the correlations is indistinguishable from those in random data, the market systematic structure being carried by a smaller dimensional subspace. On the other end the characteristic directions are uncorrelated to each other. Therefore, when forming portfolios that mimic these directions one is exploring the systematic components of the market. There is no obvious relation between the geometrical status of the market directions and the return performance of its associated portfolio. To explore this issue the following experimental approach was used:
A specific time interval, herein called the past, is used to construct the effective dimensions of the market. For each direction, portfolios are formed with the companies that have projections along this direction above a threshold. They are called dominant for that direction. Then the behavior of these portfolios is followed for a later time interval, called the future. Afterwards a new dimension analysis is performed using the data of the period called ”the future” and the portfolio is adjusted accordingly. Portfolios were also formed mixing dominant companies in several directions. Carrying out this analysis for the data of 20 years some surprising results were found. The portfolios corresponding to the largest eigenvalue directions tend to perform poorly, whereas it is some of the smaller eigenvalues portfolios that perform better. Whether this is an accident or there is some deep reason it is an open question. In any case if it is an accident, it is an accident that consistently occurs over very many years.
In the final section we place our portfolios in the Markowitz plane. It turns out that the better performing ones are close to a frontier portfolio.
2 Portfolios and characteristic market directions: An empirical study
We have analyzed a set of 319 NYSE stocks for a time period from 1989 to 2008. Once the characteristic market directions (for a time interval called the past) and the reduced dimensional subspace are identified, the first step consists in determining the amount of each stock to be included in each one the directional-portfolios. Once this is done, the performance of the portfolios is followed for a time period called the future and is compared with the performance of the Dow Jones and SP500 indexes. Afterwards the data of the future is used to redo the geometrical analysis and new directional-portfolios (using the accumulated capital of the previous ones) are formed which are then followed for an equal period. etc. For the results presented in this paper past and future are six months.
To obtain the contribution of each stock () to a dimensional subspace , we compute the ratio between the projection of the stock to that subspace and the projection to the whole market space .
The inclusion of the stock () in the -dimensional portfolio depends on the value of , which is required to be greater than an appropriate threshold. The weight of stock in the portfolio is proportional to . At time zero the portfolio is normalized using the value of an index (Dow Jones or SP500) at that time.
On the final day of each time period ( months) the ratio of the portfolio value to the reference index value on that day is computed:
2.1 One-dimensional portfolios
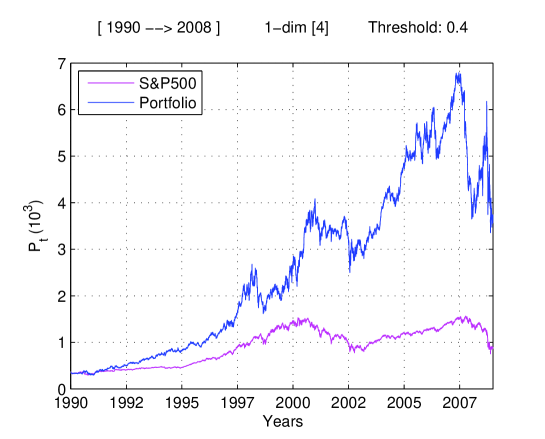
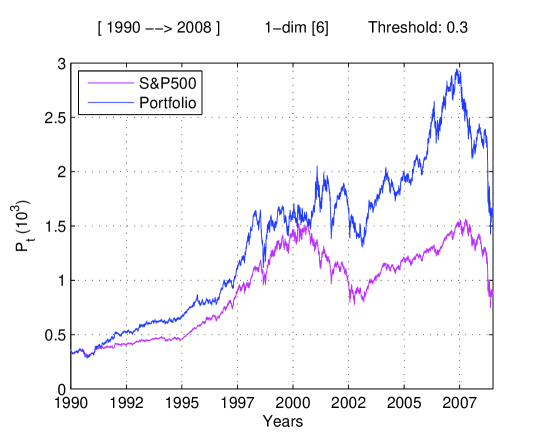
Figs.(1) to (7) show the evolution of six 1-dimensional portfolio for each one of characteristic market directions as well as the simultaneous evolution of the S&P500 index for a period from 1990 to 2008. These plots were built adjusting each six months the corresponding portfolios. The average number of companies in each portfolio ranges from 7 to 42 out of 319. The directions are labeled 1 to 6 from the largest to the smallest eigenvalue in the market space.
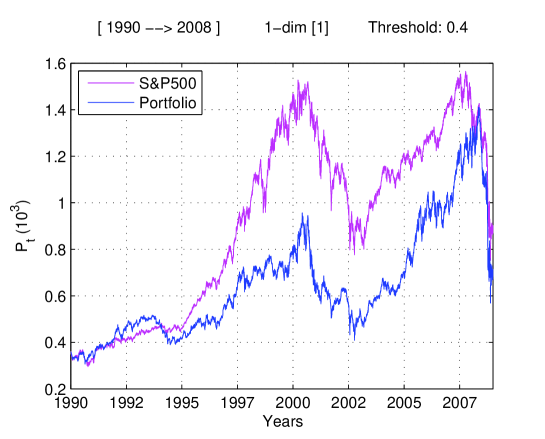
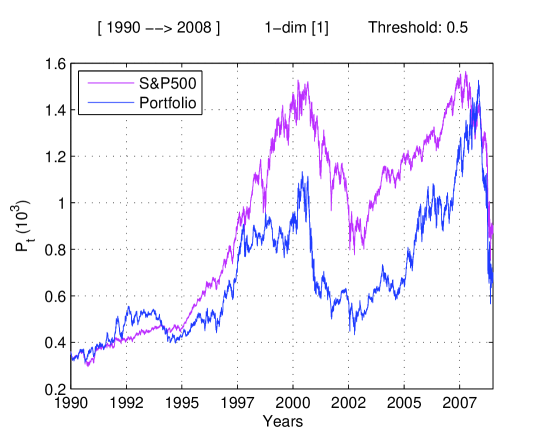
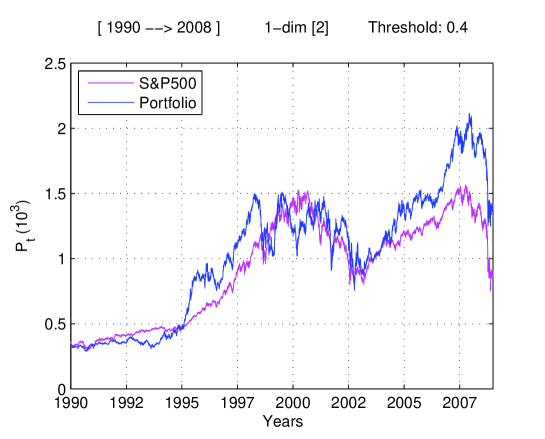
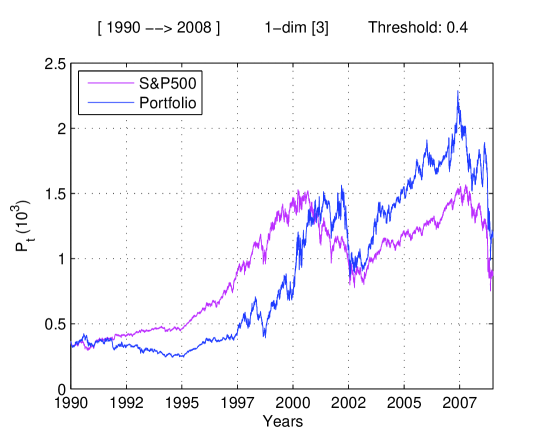
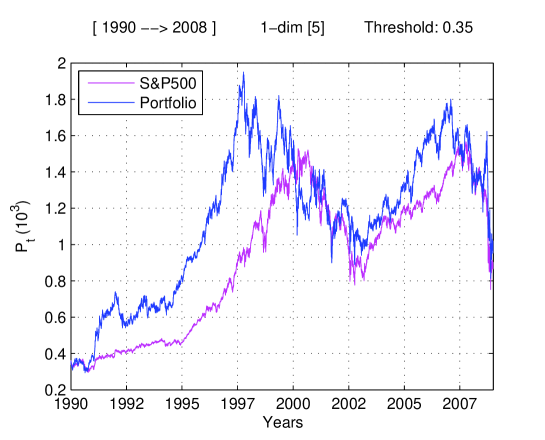
Observing the results in Fig.(1) and (2) it seems obvious that building the portfolio on the first direction - the one associated to the largest eigenvalue - yields negative results when compared to the evolution of the index. The evolution of a 1-dimensional portfolio built on the second effective direction remains very close to the value of the index (Fig.3) and for the third direction (Fig.4) two different behaviors take place. The first one, from 1992 to 2000 yields negative results whereas from 2004 to 2007 one sees the opposite effect. The 1-dimensional portfolio built on the fifth direction display a similar behavior (Fig.6).
However, when the fourth direction is chosen we notice that there is a very significant gain of 314% (Fig.5). Finally, the sixth direction is also related to gains even though, there seems to be some loses at the end of the time period (Fig.7).
In general terms, it is clear that, whenever 1-dimensional portfolios are built, there are two remarkable directions: the first and the fourth. The first one is always associated to negative results, while the fourth direction corresponds to strongly positive ones. Mixed behavior is associated to the other directions.
2.2 Higher dimensional portfolios
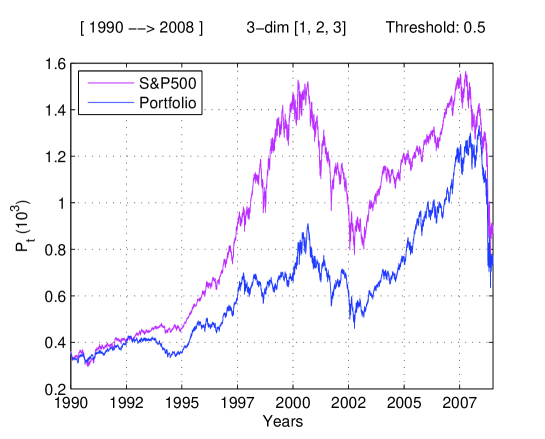
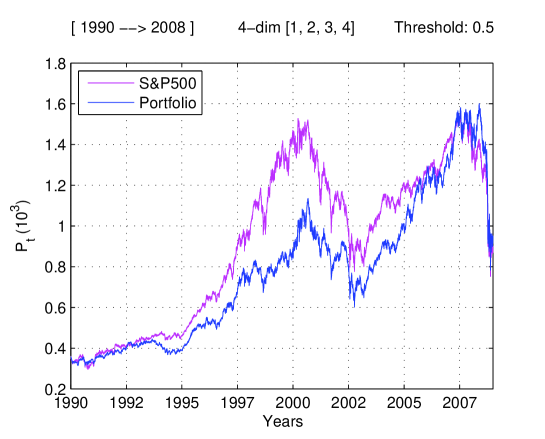
Figs.(8) to (11) show the evolution of multi-dimensional portfolios compared with the evolution of the S&P500 index. These plots were also built from a varying number of stocks, adjusted at each 6-month period from 1990 to 2008.
The negative character of the first dimension is evident even in situations where more than one dimension is involved, as shown in Figs.(8) and (9) for portfolios built on the subspaces, respectively, [1,2,3] and [1,2,3,4]. (with threshold ).
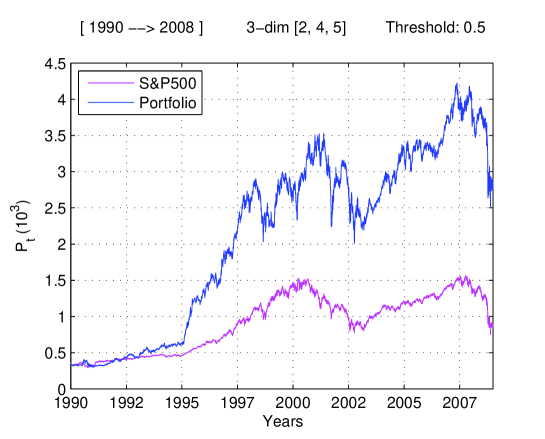
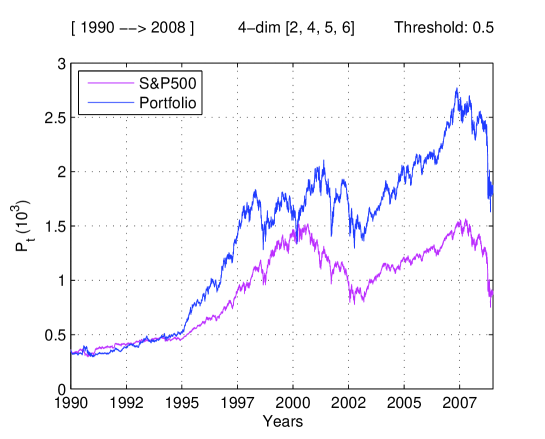
In contrast, 3 and 4-dimensional portfolios containing the second, fourth and fifth directions seem to have consistently higher values as compared to the index, as shown in Figs.(10) and (11).
As mentioned before, the most interesting results were obtained from the fourth direction, for which the gain factor is 314%. The effect of the fourth direction extends to the performance of the portfolio built on the subspace [2,4,5] which yields a gain factor 220%.
3 Subspace-portfolios and the Markowitz plane
Although being questionable that standard deviation of return is a good measure of risk, the mean-variance method of Markowitz has become a standard model against which other portfolio constructions may be compared. Here also, after constructing the efficient frontier for the whole set of companies that were analyzed, we have computed the mean return and standard deviation of our portfolios and placed them in the Markowitz plane.
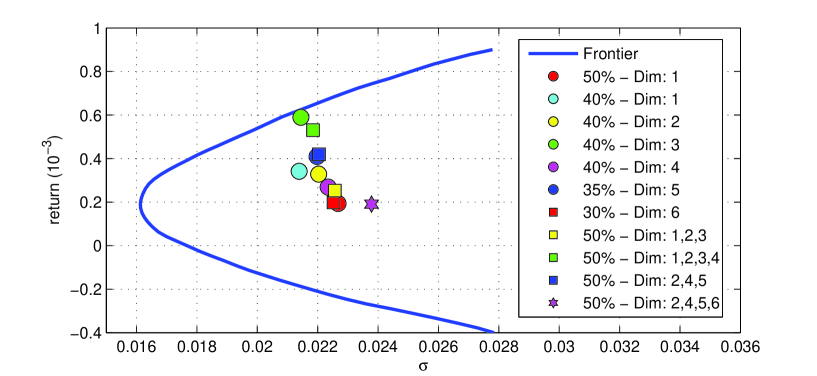
The efficient frontier is constructed considering portfolios which may contain positive amounts (no short positions) of any one of the 319 companies that were used in the analysis. Returns and standard deviations for the whole period from 1990 to 2008 were used. For our portfolios we have computed the return and standard deviation for each one of the six months periods and then have taken the average of these results. The results are shown in Fig.(12) with color codes described in the right-hand table. One finds that the 4th direction portfolio is close to a Markowitz frontier portfolio as also are two of the portfolios that contain this direction.
The results presented in the figures refer to average values in the whole 1990-2008 period. The same analysis for each particular six-month interval displays some fluctuations but it is qualitatively very similar.
4 Conclusions
A geometric analysis of the time series of returns has been performed in the past and it implies that the most of the systematic information of the market is contained in a space of small dimension. In this paper we have explored subspaces of this space to find out the relative performance of portfolios formed from the companies that have larger projections in each one of the subspaces. The subspace directions are ordered according to the decreasing values of the eigenvalues in the distances matrix. This analysis is performed in a dynamical manner, that is, at each six months period the geometrical analysis is performed anew and the companies contained in each subspace portfolio may change.
An interesting and, for us, unexpected result was that the best performance portfolios were associated to some of the small eigenvalue subspaces and not to the dominant directions in the distances matrix. This occurs in such a systematic fashion over an extended period (1990-2008) that it may not be a statistical accident. Whether there is some deep reason or a simple explanation for this effect is an open question.
References
- [1] R. N. Mantegna; Hierarchical structure in financial markets, European Physics Journal B 11 (1999) 193-197.
- [2] R. N. Mantegna and H. E. Stanley; An Introduction to Econophysics: Correlations and Complexity in Finance, Cambridge University Press, Cambridge 2000.
- [3] R. Vilela Mendes, T. Araújo and F. Louçã; Reconstructing an Economic Space from a Market Metric, Physica A 323 (2003) 635-650.
- [4] T. Araújo and F. Louçã; The Geometry of Crashes - A Measure of the Dynamics of Stock Market Crises, Quantitative Finance, 7 (2007) 63-74.