Exploring morphological correlations among H2CO, 12CO, MSX and continuum mappings
Abstract
There are relatively few H2CO mappings of large-area giant molecular cloud (GMCs). H2CO absorption lines are good tracers for low-temperature molecular clouds towards star formation regions. Thus, the aim of the study was to identify H2CO distributions in ambient molecular clouds. We investigated morphologic relations among 6-cm continuum brightness temperature (CBT) data and H2CO (; Nanshan 25-m radio telescope), 12CO (1–0; 1.2-m CfA telescope) and midcourse space experiment (MSX) data, and considered the impact of background components on foreground clouds. We report simultaneous 6-cm H2CO absorption lines and H110 radio recombination line observations and give several large-area mappings at 4.8 GHz toward W49 (), W3 (), DR21/W75 () and NGC2024/NGC2023 () GMCs. By superimposing H2CO and 12CO contours onto the MSX color map, we can compare correlations. The resolution for H2CO, 12CO and MSX data was 10′, 8′ and 18.3′′, respectively. Comparison of H2CO and 12CO contours, 8.28- m MSX colorscale and CBT data revealed great morphological correlation in the large area, although there are some discrepancies between 12CO and H2CO peaks in small areas. The NGC2024/NGC2023 GMC is a large area of HII regions with a high CBT, but a H2CO cloud to the north is possible against the cosmic microwave background. A statistical diagram shows that 85.21% of H2CO absorption lines are distributed in the intensity range from to 0 Jy and the range from 1.206 to 5 km s-1.
Subject headings:
formation; massive; clouds; HII regions; imaging; individual (W49, W3, DR21/W75 & NGC2024/NGC2023)1. Introduction
Absorption lines for formaldehyde (H2CO; = 1; = 4829.659 4MHz), discovered in the interstellar medium by Snyder et al. (1969), are commonly detected toward star formation regions. H2CO is a slightly asymmetric rotor molecule and is inherently sensitive to kinetic temperature. H2CO is an accurate probe of physical conditions in dense molecular clouds (Mangum & Wootten, 2002). Anomalous absorption lines can be seen against the 2.7 K cosmic microwave background (CMB; Palmer et al., 1969) and detected in dark clouds. Absorption is strongest at high density and temperature owing to the collisional pumping mechanism. A survey by Downes et al. (1980) between and 60∘, suggested that HII regions are associated with H2CO. 12 bright galactic HII regions and two dark clouds (W3, W3(OH), NGC2024, W31, W33, M17, W43, W49A, W51A, W51B, K3-50 and DR21/W75; NGC2264 and Heiles cloud 2) have been mapped at an angular resolution of 2.6′ using a 100-m telescope (Bieging et al., 1982), but their mapping areas are smaller than ours. Toward L1551, observations made using the Arecibo Telescope showed that H2CO lines not only trace the outer envelope or quiescent state of molecular clouds, but also provide kinematic information on star formation (Araya et al., 2006). Piepenbrink & Wendker (1973) presented a first extensive survey of the Cyg X-region using H2CO and H110 lines as measured with the 100 m-RT Effelsberg telescope. Heiles clouds 1 and 2 and Lynds cloud L134 were mapped using the Onsala 25-m telescope and the results show that H2CO contours generally coincide with areas of optical obscuration (Sume et al., 1975). Rodríguez et al. (2006) carried out a blind search of anomalous H2CO absorption lines in the general direction of the galactic anticenter radiation using the Onsala 25-m radio telescope. This large-area mapping shows that H2CO absorption and 12CO emission lines spatially coexist and all H2CO absorption features observed are associated with known 12CO emission. In addition, Rodríguez et al. (2007) mapped a large region around L1204/S140 using H2CO absorption line as measured with the Onsala 25-m telescope and concluded that 12CO emission and H2CO absorption lines correlate fairly well, both qualitatively and quantitatively. Nevertheless, large-scale mappings of star formation regions using H2CO absorption lines, especially for large-area GMCs, are relatively few.
McKee & Ostriker (2007) offered a basic description of turbulence, magnetic fields and self-gravity for the key dynamic processes involved in star formation. These three mechanisms influence the systematic velocity and broaden the line width. In general, most massive star formation regions deposit ultra-compact HII (UCHII) regions, which are dense and compact bubbles of photoionized gas of less than 0.1 pc in diameter and are surrounded by massive young stellar objects (YSOs; Thompson et al., 2006). Measurement of H110 radio recombination lines (RRLs; = 4874.157 MHz) and H2CO absorption can be used to determine the kinematic distance of UCHII regions (e.g. Araya et al., 2002; Westerhout, 1958). To discern the overall structure of GMCs, correlations among various molecular clouds should be considered and large-scale surveys are necessary.
In this paper, we report large-scale mappings of W49, W3, DR21/W75 and NGC2024/NGC2023 GMCs, almost all of which have a thermal background. We compare the relations among H2CO, 12CO and MSX data and the continuum brightness temperature (CBT). The remainder of the paper is organized as follows. Section 2 describes the observations, data production and relevant parameters. In Section 3, we presents mappings for H2CO, 12CO, MSX and CBT data. In addition, we report some associations among 12CO, H2CO and continuum spectra, and define ranges for relations between line width and intensity. Finally, conclusions are presented in Section 4.
2. Observations and Data
2.1. Observations
Observations were made discontinuously from October 2009 to January 2011 using the Urumqi Nanshan 25-m telescope, which affords a half-power beam size (HPBW) of approximately 10′ at 4.8 GHz. H2CO absorption and H110 RRL spectra were simultaneously obtained using a 4096-channel digital autocorrelation spectrometer at a bandwidth of 80 MHz using position switching. The central velocity was = 0.0 km s-1, the frequency was = 4851.9102 MHz, and the velocity channel width was 1.206 km s-1. To achieve a better signal-to-noise ratio (S/N), the ON-source integration time was tens of minutes to up to several hours. CBT data at 4.8 GHz were processed with a bandwidth of about 400 MHz. The CBT error was approximately 1% and sensitivity was approximately 75 mJy. The system temperature during observations was 23 K. A diode noise source was used to calibrate the spectra and the flux error was 15%. The pointing accuracy was better than 15′′ for all observations and the antenna efficiency was 62%. The DPFU (degrees per flux unit) value was 0.116 K Jy-1.
2.2. Data Reduction
Data reduction for H2CO absorption lines and H110 RRLs was performed using CLASS and GREG, which are part of the GILDAS software developed by IRAM. Furthermore, 8.28- m mid-infrared MSX archive data were handled using SAOImage DS9, Adobe Photoshop 7.0.1, Origin 8 and Adobe Illustrator CS software. Starlink software was used to process 12CO cube data (Dame et al., 2001) to obtain parameters (integration intensity, velocity, intensity and line width) for comparison with H2CO parameters.
2.3. Data Exhibition
MSX data traces star formation regions, and mainly traces the dust continuum emission from core, so that we could compare the distributional relation between H2CO and MSX data, and shed light on the background environment for star formation regions, CBT data at 4.8 GHz and MSX data for the 8.28- m band were used as the background for H2CO contours. The correlation between MSX colorscale images and H2CO absorption contours is described in Section 3. The 2.6-mm 12CO data from the 1.2-m CfA telescope (Dame et al., 2001) were used as a background to determine their relationship. The CO beam size was 8′, which is comparable to that for H2CO (10′).
The optical depth, column density and mass for measured H2CO absorption lines were calculated in the usual way. According to Bieging et al. (1982), the apparent optical depth is
| (1) |
where is the line intensity measured, is the CBT and is the 2.7 K cosmic background temperature. is the 1.7 K excitation temperature of the H2CO transition. The H2CO column density was calculated at the level as:
| (2) |
where is the H2CO FWHM in km s-1. Thus, the column density is (Scoville & Solomon, 1973):
| (3) |
Finally, we used the following equation (Poeppel et al., 1983)
| (4) |
to indirectly derive the clump’s -mass:
| (5) |
where is the observational area, is the average column density, is the mass of the -molecular and (kpc) is their distances.
Table LABEL:tbl-total lists ID numbers corresponding to the (0, 0) offset position in Figs. 1, 2, 3 and 4 for the four sources. Columns 3 and 4 show equatorial coordinates for the (0, 0) offset position. The distance in Column 5 comes from references (, , and ) in Column 10. The size () in Column 6 is the approximate survey region, which is much larger than in previous studies. Column 7 lists the clouds mass and Column 8 the total integration time in the ON-position for every point source. In Column 9, is the number of all observational positions toward the sources, is the number of H2CO absorption lines, and is the number of H110 RRLs. Hence, the detection rate is 56.95% for H2CO absorption lines and 10.60% for H110 RRLs.
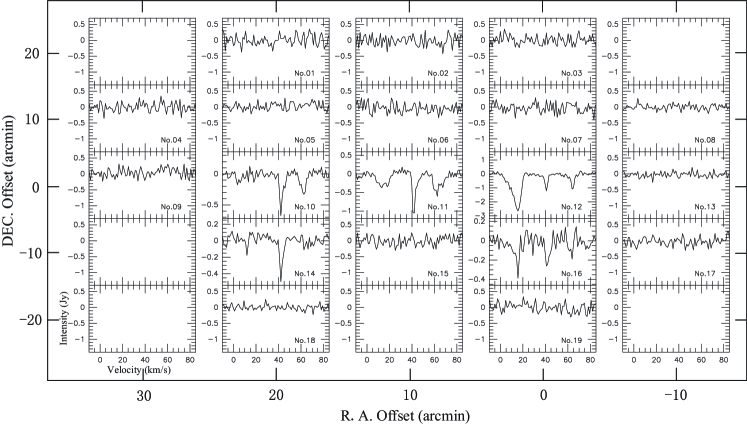
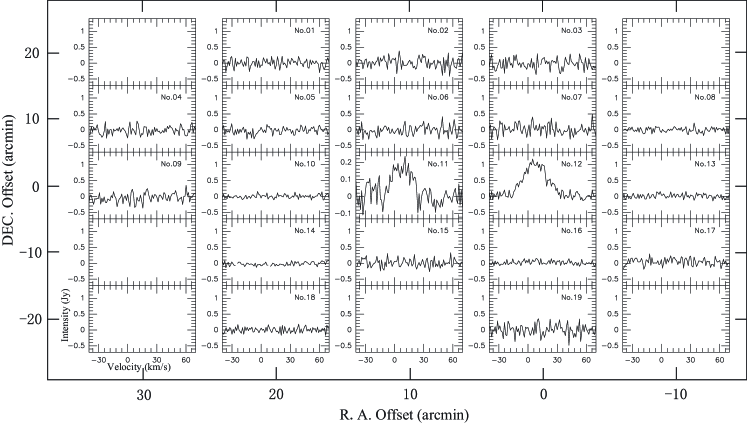
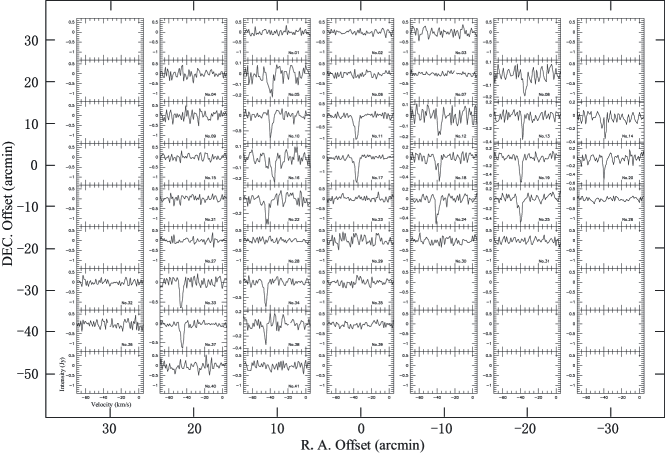
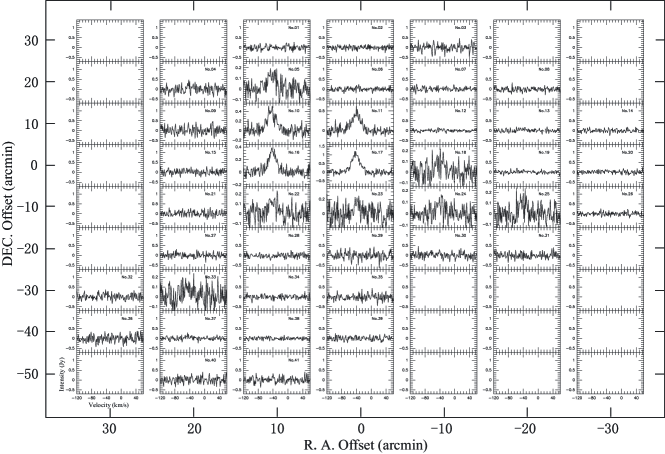
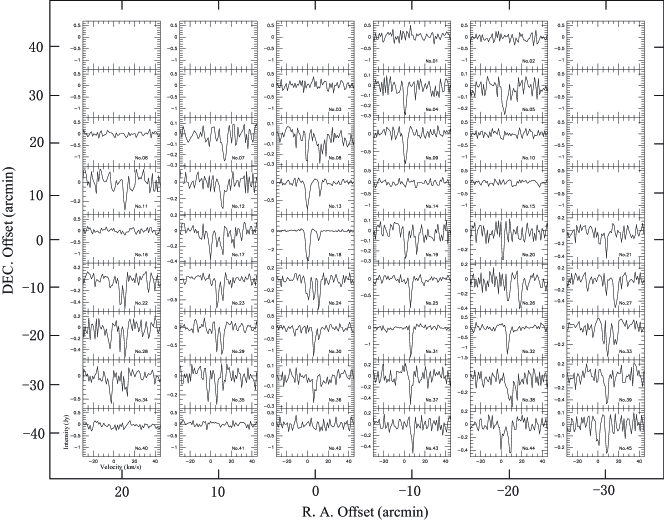
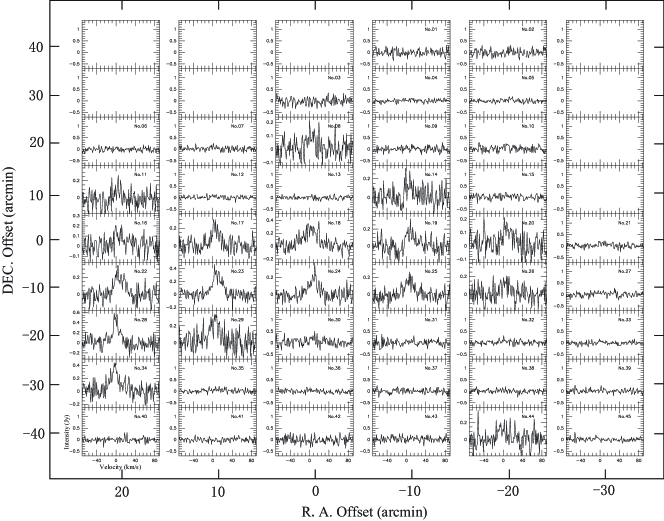
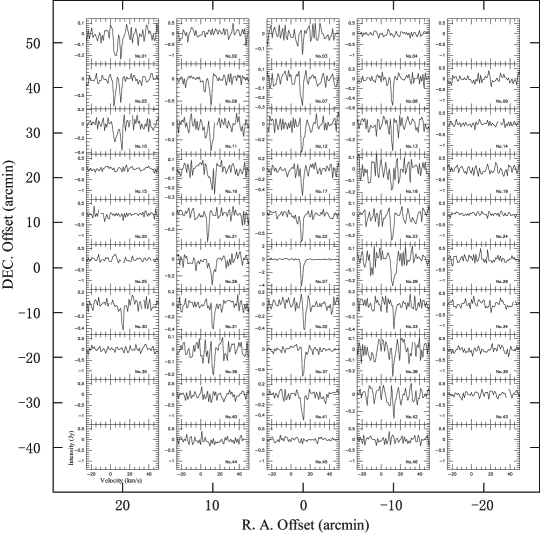
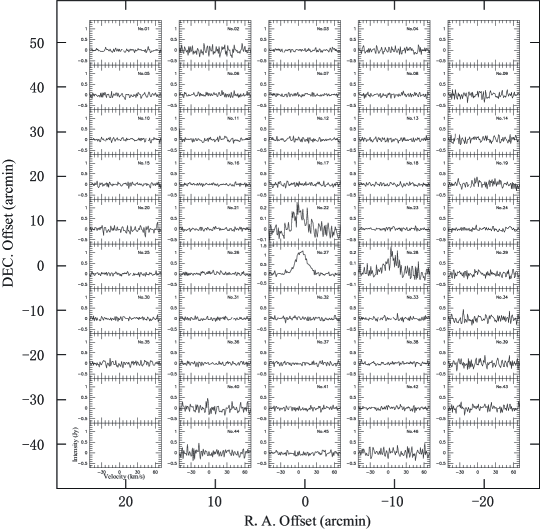
Figs. 1, 2, 3 and 4 present spectral mosaics of H2CO absorption lines and H110 RRLs toward W49, W3, DR21 and NGC2024 GMCs. The relative observational positions and the corresponding parameters are listed in Tables LABEL:tbl-w49, LABEL:tbl-w3, LABEL:tbl-dr21 and LABEL:tbl-ngc2024. The offset position is indicated on the relative coordinate axis and the step size is 10′. The velocity components were identified by Gaussian fitting. All spectra are included, regardless of whether they contain signals. There are many blank panels for which sources could not be detected. Finally, all H2CO absorption lines exhibited are stronger than 3 in intensity. However, some of the H110 RRLs did not reach 3 in intensity, as denoted by in Tables LABEL:tbl-w49, LABEL:tbl-w3, LABEL:tbl-dr21 and LABEL:tbl-ngc2024. For faint () H110 RRLs, the spectra are shown for information only and were not studied further.
Tables LABEL:tbl-w49, LABEL:tbl-w3, LABEL:tbl-dr21 and LABEL:tbl-ngc2024 list the relevant parameters for H2CO absorption lines and H110 RRLs. The serial number and coordinate offset are listed in Columns 1 and 2 for the corresponding spectral mosaics (Figs. 1, 2, 3 and 4). Columns 3–6 lists parameter data for H2CO absorption lines, while those for H110 RRLs are in Columns 11–14. Columns 3 and 11 list line-of-sight velocity data relative to the Sun. Columns 4 and 12 list the integration intensity flux for each velocity component. Columns 5 and 13 list line width (FWHM) data with . Columns 6 and 14 list spectral intensity data. Columns 7–10 list the CBT at 4.8 GHz, the H2CO optical depth, and the H2CO and H2 column density, respectively. The optical depth () range is approximately 0.007–0.188, so H2CO is optically thin. The column density () range is approximately . In addition, indicates that the corresponding spectra could not be detected. H110 RRL data with a signal intensity of are denoted by .
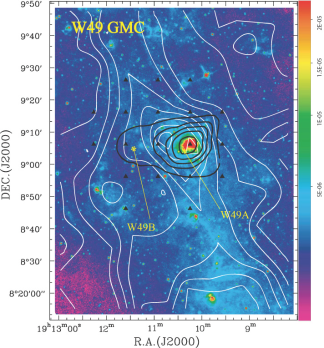
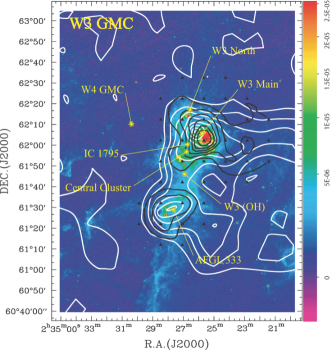
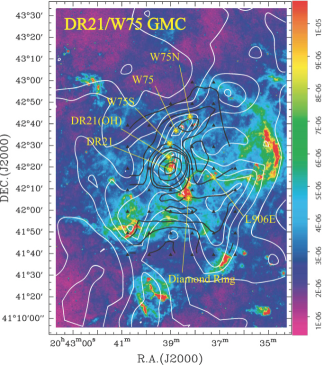
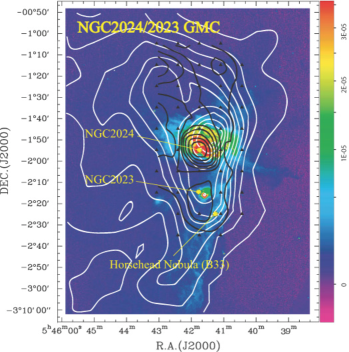
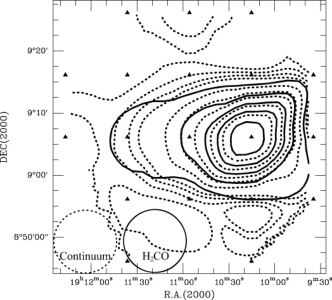
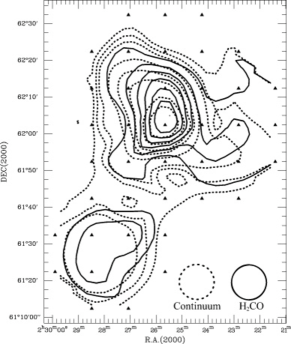
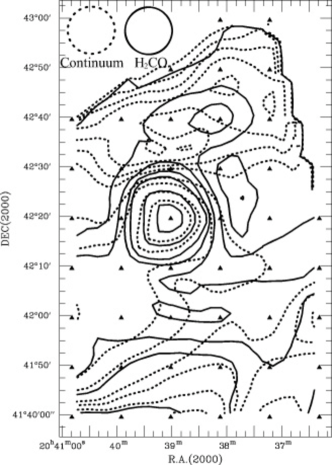
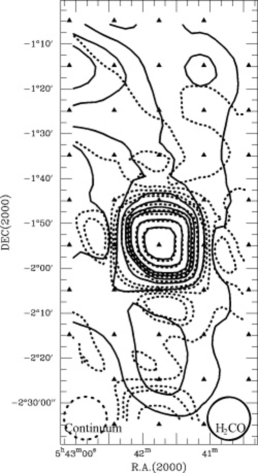
Fig. 5 shows an overlay of the integration intensity for H2CO and 12CO contours onto the 8.28- m MSX color map. And, several representative objects are indicated in the maps. From Fig. 5, we find that the large area distributions of them are consistent, but there are some off-peak discrepancy between 12CO peaks and others. We also compare the relations between velocity (Fig. 8), integration intensity (Fig. 9), intensity (Fig. 10) and line width (Fig. 11) to look for the relations between H2CO and 12CO. Moreover, we also overlay the H2CO contours onto the 4.8 GHz continuum temperature contours in Fig. 6. From Fig. 6, we find that there is a good consistent morphologic distribution between H2CO and CBT, and we also made a relation (Fig. 7) between integration intensity of H2CO and CBT to derive a formula (Eqn. 6). Basing above, we suggest that H2CO contours are more strongly correlated with the distribution of the continuum components than 12CO, so that it is possible to produce the off-peak discrepancy. The character of these four GMCs is analyzed in Section 3.
3. Results and discussion
3.1. GMC descriptions
3.1.1 W49 GMC
The W49 GMC radio source was discovered in a 21-cm continuum survey by Westerhout (1958). The W49 GMC complex consists of a thermal component (W49A) and a nonthermal component (W49B). W49A is one of the most luminous galactic giant radio HII regions (Dreher et al., 1984; de Pree et al., 1997), and W49B is a supernova remnant (SNR). W49B and W49A are separated by 12.5′ along an east–west line at a kinematic distance of 11.4 kpc (Gwinn et al., 1992). At this distance, 10′ = 33.16 pc. A giant-scale area (approx. 50′ 50′) was surveyed toward W49 GMC. During 966 minutes of integration, we observed five H2CO absorption lines and two H110 RRLs. In our spectra (Fig.1(a)), three H2CO components of 15.9, 40.9 and 64.3 km s-1 were detected. Brogan & Troland (2001) mapped the HII region of W49A and W49B with 21-cm HI data, which revealed velocities of 4 and 7 km s-1 toward W49A, and 40 and 60 km s-1 toward W49A and W49B. H2O emission lines were also observed at 39 and 60 km s-1 in W49A (Buhl et al., 1969). Furthermore, three absorption features at velocities of 15, 40 and 60 km s-1 were found for 18-cm OH absorption lines (Pastchenko & Slysh, 1973). It is possible that the W49 GMC has an intricate kinematic structure or different velocity subclouds piled up in the line of sight. The multiple velocity components may arise from the Sagittarius spiral arm clouds (Brogan & Troland, 2001). There is no clear evidence that W49B is closer to the Sun than W49A. However, many researchers are interested in whether W49A and W49B are physically correlated. Considering the uniform velocity components 4.5, 10.5, 15.9, 40.9 and 64.3 km s-1 from W49A and W49B, a physical association between them can be inferred.
3.1.2 W3 GMC
W3 GMC, at 1.95 kpc from the Sun (Xu et al., 2006), lies to the western edge of W4 GMC. At this distance, 10′ = 5.672 pc. W3 GMC is made up of three knots of molecular gas known as W3 Main, W3 North, and W3 OH. The Central Cluster, located between W3 Main and W3 OH, contains a large number of Class II YSOs (Ruch et al., 2007). A giant-scale area (approx. 70′ 90′) was surveyed toward W3 GMC. We detected 19 H2CO absorption lines and four H110 RRLs during 2370 minutes of integration. The W3 GMC is a complex of massive star formation regions, where there are strong H2CO absorption lines, H110 RRLs, 12CO emission lines, MSX sources and a CBT. We can clearly distinguish two cores for W3 GMC. At the junction (W3(OH)) of the two clouds, we cannot detect H2CO absorption lines and the CBT is low, but the integration intensity for 12CO clouds and MSX sources is relatively strong. We hypothesize that many young stars in W3(OH) are surrounded by a thin gas envelope. The velocity for H2CO and H110 ranges from approximately to km s-1, which is similar to HI observations (Read, 1981). Table LABEL:tbl-w3 reveals a strange phenomenon: a sharp velocity gradient is apparent, which is consistent with = 1-0 12CO observations (Thronson et al., 1985). From northwest to southeast, the velocity varies strongly from km s-1 (No. 08) to km s-1 (No. 37) (Fig. 2(a) and Table LABEL:tbl-w3).
3.1.3 DR21/W75 GMC
DR21/W75 GMC is located in the Cygnus constellation, approximately 3.0 kpc from the Sun (Campbell et al., 1982). At this distance, 10′ = 8.727 pc. The MSX color map reveals that DR21/W75 GMC exhibits a complex and dispersive structure, with many separate subclusters assembled together. We surveyed DR21 and W75 GMCs, which include W75N, W75, DR21(OH), DR21, L906E and Diamond Ring (source name). DR21 and W75 GMCs are associated with massive dense cores and are separated by approximately 30′ (Wilson & Mauersberger, 1990; Shirley et al., 2003). A giant-scale area (approx. 60′ 90′) was surveyed toward DR21/W75 GMC. We detected 34 H2CO absorption lines and 8 H110 RRLs during 2742 minutes of integration. The velocity components are multiple and rather intricate (Fig. 3(a)). The velocity is smaller for the northeastern and larger for the southwestern section than for the central section. A velocity gradient exists within these subclouds, and probably arises from GMC rotation. A UCHII region was detected using H110 RRLs as a tracer. The data in Table LABEL:tbl-dr21 reveal that the H110 RRL intensity is so weak (indicated by ) that we could not obtain a good signal, even with long-time integration. In addition, we only detected part of the DR21/W75 GMC. In particular, for the western part there is a giant and strong MSX region, while the 12CO cloud is relatively faint. To determine whether or not there is association between H2CO and 12CO clouds and MSX sources, the western edge of the DR21/W75 GMC should be observed.
3.1.4 NGC2024/NGC2023 GMC
NGC2024/NGC2023 GMC is situated in Orion B at a distance of 415 pc (Menten et al., 2007). At this distance, 10′ = 1.207 pc. The NGC2024/NGC2023 GMC is a bright emission nebula crossed by a prominent dust lane. NGC2024 GMC includes a number of protostars along the star-forming ridge extending in a north–south direction coincident with an HII region, which is in front of filamentary shaped dense molecular material (Gaume et al., 1992). A giant-scale area (approx. 50′ 100′) was surveyed toward NGC2024/NGC2023 GMC. The area has similar velocity components and integration intensity contours to those reported by Cohen et al. (1983), but our observational instrument was more sensitive than theirs. We detected 28 H2CO absorption lines and two H110 RRLs during 3378 minutes of integration. The H2CO velocity is approximately 11.70 km s-1 and comprises a single component (Table LABEL:tbl-ngc2024). To the north of NGC2024/NGC2023, no strong infrared background can be detected and both the NRAO/VLA Sky Survey radio contour plot and the CBT at 4.8 GHz are much fainter than in the central section, whereas H2CO absorption and 12CO emission lines are widely distributed in this area. Hence, it is possible that the northern H2CO absorption lines arise from CMB excitation.
3.2. Comparison of H2CO distributions and the CBT
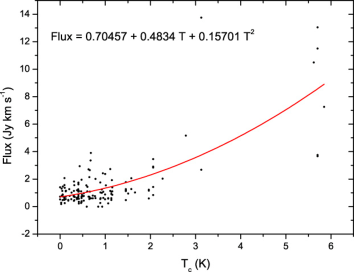
It is well known that the H2CO absorption is strongly biased by the high CBT which is being absorbed by the H2CO molecules along the line of sight to the source of the continuum. Here we will give the empirical relationship between H2CO and CBT. In Fig. 6, continuum contours are overlaid on the H2CO contour maps for W49, W3, DR21 and NGC2024 GMCs. The morphology of the H2CO and continuum distributions matches very well. The H2CO peaks are biased to the CBT peaks. For the offset(0, 0) positions of four GMCs, the CBTs are so high that H2CO maybe mainly come from the CBT collision excitation. According to Tables LABEL:tbl-w49, LABEL:tbl-w3, LABEL:tbl-dr21 and LABEL:tbl-ngc2024, the H2CO column density shows an irregular distribution that does not match the morphology of H2CO intensity contours. By comparing the integration intensity contours for H2CO with the CBT for GMCs (Fig. 7) and by polynomial fitting, we obtained the following equation:
| (6) |
where is integration intensity of H2CO, and is 6-cm CBT. This further suggests in quantity that the H2CO intensity is strongly influenced by the CBT background and that the contribution of CMB excitation to the intensity is very weak.
3.3. Comparison of H2CO, 12CO and MSX data
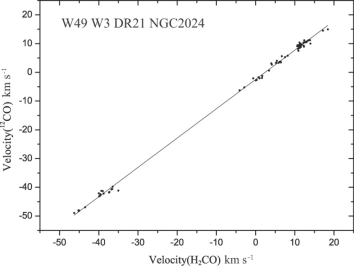
The velocity correlation between H2CO and 12CO is described in Fig. 8 for W49 , W3, DR21 and NGC2024 GMCs. The fitting line passes through (0, 0) and the points are distributed almost on or near the line.
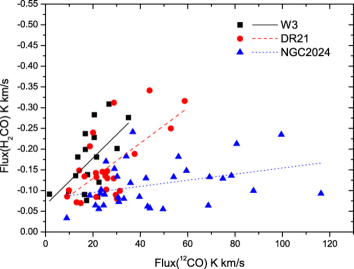
The correlations of integration intensity between H2CO and 12CO are plotted in Fig. 9 (ignoring these points of ) for W3, DR21 and NGC2024 GMCs. The best least-squares fit to a straight line for W3, DR21 and NGC2024 GMCs GMC data sets yield respectively
| (7) |
| (8) |
| (9) |
Fig. 9 shows that the integration intensity relation between H2CO and 12CO for three GMCs is scattered. And the equation coefficients are different but similar between Rodríguez et al. (2007) and our results. It is suggested that there exists different physical condition for different GMCs, however, the correlation between H2CO and 12CO is inherent.
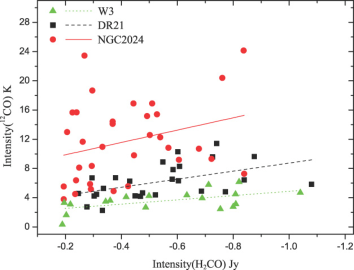
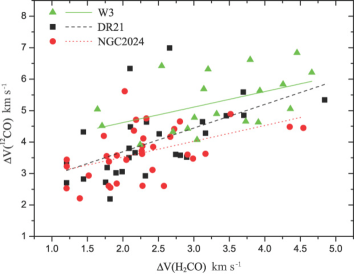
Fig. 10 shows the intensity correlation for H2CO and 12CO (ignoring these points of ). For W3, DR21 and NGC2024 GMCs, the correlation coefficient is 0.558, 0.499 and 0.297, respectively. Thus, the linear relation is better for W3 and DR21 GMCs than for NGC2024. The reason may be that H2CO absorption to the north of the NGC2024 GMC arises from CMB excitation, whereas bright continuum sources are responsible for H2CO absorption in the other regions. The two excitation mechanisms possibly produce different H2CO intensities. The intensity of H2CO absorption is related to the molecular density and background continuum sources. Using Origin Software to draw and calculate, the Pearson’s correlation coefficients for line width between 12CO emission and H2CO absorption are 0.480, 0.556 and 0.478 for W3, DR21 and NGC2024 GMCs respectively (Fig. 11). The line width is greater for 12CO emission than for H2CO absorption on the whole. In general, there is good correlation between 12CO and H2CO clouds basing on these correlation coefficients.
Comparison of H2CO and 12CO contours and MSX data reveals great uniformity in morphology in the large area, especially between H2CO and MSX data. The integrated intensity peaks are located at almost the same positions, but the 12CO peaks are offset from the H2CO peaks. MSX clouds are always located within star formation regions, where the hot core is the energy source for star formation. Basing above, under ambient conditions, H2CO and 12CO clouds form a blanket around star formation regions in morphology. This leads to a uniform structure that can be used as a tracer for star formation regions.
3.4. 12CO peak offset from H2CO and CBT
For the large-area distribution, 12CO and H2CO contours are fairly similar in morphology, but there is a peak offset (about 10′ in Fig. 5(b) and 5(d)) for the small-area distribution. Heithausen et al. (1987) did not find a morphologic correlation between 12CO and H2CO data using a 100-m telescope, but Rodríguez et al. (2007) reported a discrepancy between 12CO and H2CO peaks toward the L1204 dust cloud using the Onsala 25-m telescope. Their H2CO clouds were against the CMB, but our sources are against high CBT sources in HII regions. The background continuum temperature has a strong effect on the H2CO distribution as we showed in Fig. 6, which reveals a fairly consistent morphology between H2CO and the continuum. However, Fig. 5 shows that 12CO peaks are offset from H2CO peaks, although this offset is different from that observed by Rodríguez et al. (2007). Their H2CO peaks were offset from the bright continuum source, while our 12CO peaks are offset from the bright continuum source. Rodríguez et al. (2007) argued that the H2CO peak offset arises from photodissociation in the UV interstellar radiation field. In our opinion, several factors explain the peak offset. First, the H2CO distribution is strongly biased by the background CBT, while the strong HII region background has a relatively weak impact on 12CO emission. Second, differences in star formation regions and evolution stages between sources will lead to discrepancy. Third, it is likely that H2CO absorption is optically thin ( 0.188) and 12CO emission is optically thick (Buckle et al., 2010), so 12CO is a poor tracer for density. Finally, the different resolution may lead to discrepancy.
3.5. Statistical relationship between line width and intensity
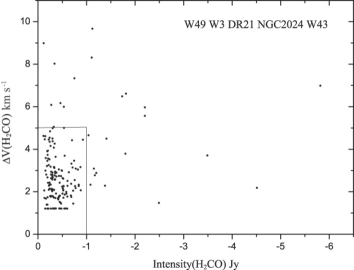
Fig. 12 shows a statistical diagram of the relationship between line width and intensity for H2CO absorption lines toward W49, W3, DR21/W75 and NGC2024/NGC2023 GMCs, and for W43 GMC observations made by Wu et al. (2010) using the same dish. These data points are corresponding to 169 velocity components from our detected 86 H2CO absorption lines. The statistical results show that the most (approximately 85.21%) of the velocity components of the H2CO absorption lines are in the intensity range from to 0 Jy and in the range 1.206–5.0 km s-1.
In Fig. 12 the width for most H2CO absorption lines is relatively narrow and may be narrower than the 1.206 km s-1 for the velocity channel. However, a few lines are rather wide, even up to 9.67 km s-1. According to Bieging et al. (1982), the width of all H2CO absorption lines observed in this paper far exceeds the thermal line width for any reasonable gas kinetic temperature (e.g. (thermal) = 0.3 km s-1 for H2CO at 30 K), so the thermal broadening mechanism can be ignored. We suggest that line broadening is mainly the result of turbulence and velocity dispersion along any given line of sight. Thus, H2CO line broadening should mainly reflect the blending of many velocity components.
4. Summary
H2CO absorption lines are important tracers for detecting the ambient conditions in star formation regions. So far very few people have carried out such large-scale H2CO mapping as ours, especially for GMCs. We conducted discontinuous observations toward four GMCs from October 2009 to January 2011 using the Nanshan 25-m telescope. Long-time integration observations and analysis revealed the following results.
For W49, W3, DR21/W75 and NGC2024/NGC2023 GMCs, we observed 151 points using a beam width of 10′ and integration for 9456 min, and found 86 H2CO absorption lines and 16 H110 RRLs. We processed H2CO absorption lines for four large-area mappings.
We described and gave some relevant physical parameters which are respectively flux, velocity, line width, intensity, CBT, apparent depth and column density for H2CO absorption lines, H110 RRLs and continuum and clump’s -mass for GMCs. Some good correlation coefficients between H2CO and 12CO were gained in terms of velocity components, line width and intensity.
In the large area, comparisons among H2CO and 12CO contours, the 8.28- m MSX color map and CBT at 4.8 GHz revealed a consistent distribution. Regions with a high CBT had much higher collision excitation rates for H2CO. However, in the small area, H2CO and 12CO peaks were not located at the same position. It is likely that the H2CO distribution is strongly biased by the background CBT, while the strong HII region of the background has a relatively weak impact on 12CO emission.
Many other results were observed for these four GMCs. E.g., W49B is a nonthermal SNR and has nearly the same velocity components as the thermal W49A. At the junction of two clouds for W3 GMC, we could not detect H2CO absorption lines, whereas the 12CO and MSX data were relatively strong. DR21/W75 GMCs had a velocity gradient, possibly arising from GMC rotation. It is possible that H2CO absorption lines to the north of NGC2024/NGC2023 GMC arise from CMB excitation.
A statistical diagram of the relation between line width and intensity was constructed for H2CO absorption lines. Approximately 85.21% of the velocity components of H2CO absorption lines were distributed in the intensity range from to 0 Jy and in the range 1.206–5.0 km s-1.
References
- Araya et al. (2002) Araya, E., Hofner, P., Churchwell, E., & Kurtz, S. 2002, ApJS, 138, 63
- Araya et al. (2006) Araya, E., Hofner, P., Olmi, L., Kurtz, S., & Linz, H. 2006, ApJ, 132, 1851
- Bieging et al. (1982) Bieging, J. H., Wilson, T. L., & Downes, D. 1982, A&AS, 49, 607
- Brogan & Troland (2001) Brogan, C. L., & Troland, T. H. 2001, ApJ, 550, 799
- Buckle et al. (2010) Buckle, J. V., Curtis, E. I., Roberts, J. F., White, G. J., Hatchell, J., Brunt, C., Butner, H. M., Cavanagh, B., Chrysostomou, A., Davis, C. J., Duarte-Cabral, A., Etxaluze, M., di Francesco, J., Friberg, P., Friesen, R., Fuller, G. A., Graves, S., Greaves, J. S., Hogerheijde, M. R., Johnstone, D., Matthews, B., Matthews, H., Nutter, D., Rawlings, J. M. C., Richer, J. S., Sadavoy, S., Simpson, R. J., Tothill, N. F. H., Tsamis, Y. G., Viti, S., Ward-Thompson, D., Wouterloot, J. G. A., Yates, J. MNRAS, 2010, 401,204
- Buhl et al. (1969) Buhl, D., Snyder, L. E., Schwartz, P. R., & Barrett, A.H. 1969, ApJ, 158, L97
- Campbell et al. (1982) Campbell, M. F., Hoffmann, W. F., Thronson, Jr., H. A., Niles, D., Nawfel, R., & Hawrylycz, M. 1982, ApJ, 261, 550
- Cohen et al. (1983) Cohen, R. J., Matthews, N., Few, R. W. & Booth, R. S. 1983, MNRAS, 203, 1123
- Dame et al. (2001) Dame, T. M., Hartmann, Dap, & Thaddeus, P. 2001, ApJ, 547, 792
- de Pree et al. (1997) de Pree, C. G., Mehringer, D. M., & Goss, W. M. 1997, ApJ, 482, 307
- Downes et al. (1980) Downes, D., Wilson, T. L., Bieging, J., & Wink, J. 1980, A&AS, 40, 379
- Dreher et al. (1984) Dreher, J. W., Johnston, K. J., Welch, W. J., & Walker, R. C. 1984, ApJ, 283, 632
- Gaume et al. (1992) Gaume, R. A., Johnston, K. J., & Wilson, T. L. 1992, ApJ, 388, 489
- Gwinn et al. (1992) Gwinn, C. R., Moran, J. M., & Reid, M. J. 1992, ApJ, 393, 149
- Heithausen et al. (1987) Heithausen, A., Mebold, U., de Vries, H. W. 1987 A&A, 179, 263
- Mangum & Wootten (2002) Mangum, J. G. & Wootten, A. 1993, ApJS, 89, 123
- McKee & Ostriker (2007) McKee, C. F., & Ostriker, E. C. 2007, ARA&A, 45, 565
- Menten et al. (2007) Menten, K. M., Reid, M. J., Forbrich, J., Brunthaler, A. 2007, A&A, 474, 515
- Palmer et al. (1969) Palmer, P., Zuckerman, B., Buhl, D., & Snyder, L. E. 1969, ApJ, 156, L 147
- Pastchenko & Slysh (1973) Pastchenko, M. I., & Slysh, V. I. 1973, A&A, 26, 349
- Piepenbrink & Wendker (1973) Piepenbrink, A., & Wendker, H. J. 1988, A&A, 191, 313
- Poeppel et al. (1983) Poeppel, W. G. L., Rohlfs, K., Celnik, W. 1983, A&A, 126, 152
- Read (1981) Read, P. L. 1981, MNRAS, 194, 863
- Rodríguez et al. (2006) Rodríguez, M. I., Allen, R. J., Wiklind, T. 2006 ApJ, 652, 1230
- Rodríguez et al. (2007) Rodríguez, M. I., Wiklind, T., & Allen, R. J. 2007, ApJ, 663, 824
- Ruch et al. (2007) Ruch, G. T., Jones, T. J., Woodward, C. E., Polomski, E. F., & Gehrz, R. D. 2007, ApJ, 654, 338
- Scoville & Solomon (1973) Scoville, N. Z., & Solomon, P. M. 1973, ApJ, 180, 31
- Shirley et al. (2003) Shirley Y. L., Evans N. J., Young K. E., Knez C., Jaffe D. T. 2003, ApJS, 149, 375
- Snyder et al. (1969) Snyder, L. E., Buhl, D., Zuckerman, B., & Palmer, P. 1969, Phys. Rev. Lett., 22, 679
- Sume et al. (1975) Sume, A., Downes D., & Wilson, T. L. 1975, A&A, 39, 435
- Thompson et al. (2006) Thompson, M. A., Hatchell, J., Walsh, A. J., Macdonald, G. H., & Millar, T. J. 2006, A&A, 453, 1003
- Thronson et al. (1985) Thronson, H. A., Lada, C. J., & Hewagama, T. 1985, ApJ, 297, 662
- Westerhout (1958) Watson, C., Araya, E., Sewilo, M., Churchwell, E., Hofner, P., Kurtz, S. 2003, ApJ, 587, 714
- Westerhout (1958) Westerhout, G. 1958, B. A. N. 14, 215
- Wilson & Mauersberger (1990) Wilson T. L., Mauersberger R. 1990, A&A, 239, 305
- Wu et al. (2010) Wu, G., Esimbek, J., & Zhou, J. J. 2010, RAA, 11, 63
- Xu et al. (2006) Xu, Y., Reid, M. J., Zheng, X. W., & Menten, K. M. 2006, Science, 311, 54
| Sources | ID | R.A.(J2000) | DEC.(J2000) | Distance | Size() | M() | Int. time | A/B/C | References |
| (No.) | ( h m s) | ( ∘ ′ ′′) | (kpc) | (arcmin2) | (M⊙) | (minutes) | |||
| W49 | 12 | 19 10 15.25 | 09 06 08.4 | 11.4 | 5050 | 2296910 | 966 | 19/5/2 | |
| W3 | 17 | 02 25 38.79 | 62 02 22.0 | 1.95 | 7090 | 71615 | 2370 | 41/19/4 | |
| DR21 | 18 | 20 39 01.23 | 42 19 33.9 | 3.0 | 6090 | 444774 | 2742 | 45/34/8 | |
| NGC2024 | 27 | 05 41 45.49 | -01 54 46.8 | 0.415 | 50100 | 5609 | 3378 | 46/28/2 | |
| Total | 230330 | 9456 | 151/86/16 |
References: () Gwinn et al. (1992); ()
Xu et al. (2006); () Campbell et al. (1982); ()
Menten et al. (2007); () Bieging et al. (1982).
Notes:—— In Column 7 the clump’s -masses
(M()) are derived from Equation 5. In Column 9,
is the number of all observational positions toward the sources,
is the number of H2CO absorption lines, and is the
number of H110 RRLs. Hence, the detection rate is 56.95%
for H2CO absorption lines and 10.60% for H110 RRLs.
| W49 | H2CO | H110 | |||||||||||
| (1) | (2) | (3) | (4) | (5) | (6) | (7) | (8) | (9) | (10) | (11) | (12) | (13) | (14) |
| ID | Offset(, ) | Velocity | Flux | Intensity | Velocity | Flux | Intensity | ||||||
| (No.) | (arcmin) | (km s-1) | (Jy km s-1) | (km s-1) | (Jy) | (K) | ( | ( | (km s-1) | (Jy km s-1) | (km s-1) | (Jy) | |
| 10 | 20, 0 | 4.733(0.68) | -0.73(0.20) | 4.61(1.41) | -0.14(0.036) | 0.406 | 0.012 | 0.503 | 0.403 | N | |||
| 42.18(0.11) | -1.72(0.15) | 2.37(0.25) | -0.68(0.036) | 0.406 | 0.058 | 1.286 | 1.029 | ||||||
| 45.51(0.32) | -0.58(0.13) | 2.32(0.59) | -0.23(0.036) | 0.406 | 0.019 | 0.418 | 0.334 | ||||||
| 62.09(0.30) | -1.75(0.20) | 5.05(0.66) | -0.32(0.036) | 0.406 | 0.027 | 1.270 | 1.016 | ||||||
| 11 | 10, 0 | 12.68(0.69) | -2.91(0.52) | 8.02(1.56) | -0.34(0.073) | 2.060 | 0.013 | 0.978 | 0.782 | 7.52(1.47) | 3.03(0.44) | 19.08(2.74) | 0.15(0.039) |
| 18.64(0.45) | -0.84(0.41) | 2.94(1.12) | -0.26(0.073) | 2.060 | 0.010 | 0.274 | 0.219 | ||||||
| 41.69(0.09) | -3.46(0.22) | 2.77(0.23) | -1.17(0.073) | 2.060 | 0.045 | 1.181 | 0.945 | ||||||
| 61.50(0.39) | -2.84(0.49) | 5.00(0.77) | -0.53(0.073) | 2.060 | 0.020 | 0.954 | 0.763 | ||||||
| 67.36(0.65) | -1.43(0.50) | 4.50(1.74) | -0.29(0.073) | 2.060 | 0.011 | 0.468 | 0.374 | ||||||
| 12 | 0, 0 | 10.49(0.81) | -11.51(2.03) | 9.67(0.90) | -1.12(0.099) | 5.705 | 0.020 | 1.779 | 1.423 | 7.54(0.35) | 31.39(0.82) | 27.88(0.85) | 1.06(0.104) |
| 15.88(0.16) | -13.05(2.03) | 5.56(0.36) | -2.20(0.099) | 5.705 | 0.039 | 2.028 | 1.622 | ||||||
| 40.86(0.11) | -3.67(0.31) | 2.88(0.30) | -1.20(0.099) | 5.705 | 0.021 | 0.568 | 0.454 | ||||||
| 64.25(0.12) | -3.76(0.34) | 3.09(0.38) | -1.15(0.099) | 5.705 | 0.020 | 0.584 | 0.467 | ||||||
| 14 | 20, -10 | 11.99(0.57) | -0.26(0.14) | 1.39(0.71) | -0.17(0.040) | 0.102 | 0.018 | 0.236 | 0.189 | N | |||
| 42.36(0.16) | -1.37(0.18) | 2.73(0.47) | -0.47(0.040) | 0.102 | 0.051 | 1.302 | 1.042 | ||||||
| 16 | 0, -10 | 12.54(1.92) | -1.10(0.41) | 8.99(4.15) | -0.11(0.035) | 0.414 | 0.009 | 0.766 | 0.613 | N | |||
| 15.66(0.30) | -0.58(0.23) | 1.78(0.48) | -0.30(0.035) | 0.414 | 0.025 | 0.417 | 0.333 | ||||||
| 41.93(0.43) | -1.14(0.23) | 4.15(0.92) | -0.26(0.035) | 0.414 | 0.022 | 0.841 | 0.673 | ||||||
| 60.91(0.82) | -0.23(0.26) | 1.70(11.5) | -0.13(0.035) | 0.414 | 0.011 | 0.171 | 0.137 | ||||||
| 63.63(0.70) | -0.36(0.23) | 1.74(0.87) | -0.19(0.035) | 0.414 | 0.016 | 0.257 | 0.206 |
Notes:—— Parameters listed about simultaneously observing H2CO absorption line and H110 RRL, and each one of both. The serial number and offset are indicated in Column one and two corresponding to spectra and color map. indicates that the corresponding spectra could not be detected. These intensity data of H110 RRL is not able to achieve 3 with to line out, so we do not consider them as signal to analysis.
| W3 | H2CO | H110 | |||||||||||
| (1) | (2) | (3) | (4) | (5) | (6) | (7) | (8) | (9) | (10) | (11) | (12) | (13) | (14) |
| ID | Offset(, ) | Velocity | Flux | Intensity | Velocity | Flux | Intensity | ||||||
| (No.) | (arcmin) | (km s-1) | (Jy km s-1) | (km s-1) | (Jy) | (K) | ( | ( | (km s-1) | (Jy km s-1) | (km s-1) | (Jy) | |
| 05 | 10, 20 | -38.73(0.28) | -1.03(0.13) | 4.37(0.62) | -0.22(0.069) | 0.892 | 0.014 | 0.558 | 0.446 | -44.15(1.69) | 3.67(0.50) | 24.82(4.10) | 0.13(0.056)a |
| 08 | -20, 20 | -35.02(0.58) | -0.78(0.23) | 3.90(1.29) | -0.18(0.022) | 0.305 | 0.016 | 0.591 | 0.473 | N | |||
| 10 | 10, 10 | -39.37(0.18) | -2.04(0.27) | 2.54(0.45) | -0.75(0.078) | 2.269 | 0.027 | 0.644 | 0.515 | -44.66(0.80) | 11.87(0.69) | 27.89(1.91) | 0.40(0.080) |
| 11 | 0, 10 | -36.79(0.13) | -5.17(0.30) | 4.66(0.33) | -1.04(0.104) | 2.784 | 0.032 | 1.419 | 1.135 | -40.79(0.72) | 12.54(0.66) | 27.79(1.74) | 0.42(0.083) |
| 12 | -10, 10 | -37.32(0.42) | -0.77(0.16) | 3.73(0.73) | -0.19(0.031) | 0.514 | 0.015 | 0.514 | 0.411 | N | |||
| 13 | -20, 10 | -37.42(0.26) | -0.65(0.16) | 1.70(0.39) | -0.36(0.002) | 0.368 | 0.031 | 0.495 | 0.396 | N | |||
| 14 | -30, 10 | -41.79(0.18) | -0.43(0.18) | 1.20(3.01) | -0.34(0.001) | 0.304 | 0.031 | 0.346 | 0.277 | N | |||
| -38.25(0.20) | -0.73(0.17) | 1.50(0.68) | -0.45(0.001) | 0.304 | 0.041 | 0.576 | 0.461 | ||||||
| 16 | 10, 0 | -36.47(0.39) | -1.03(0.17) | 4.45(0.95) | -0.21(0.035) | 1.659 | 0.009 | 0.385 | 0.308 | -41.70(0.62) | 8.68(0.46) | 24.30(1.59) | 0.33(0.051) |
| 17 | 0, 0 | -36.57(0.09) | -7.26(0.38) | 3.79(0.24) | -1.80(0.075) | 5.850 | 0.031 | 1.103 | 0.882 | -41.97(0.42) | 28.59(0.95) | 26.12(1.05) | 1.03(0.121) |
| 18 | -10, 0 | -40.86(0.31) | -0.64(0.18) | 2.33(0.81) | -0.26(0.009) | 0.957 | 0.016 | 0.340 | 0.272 | -38.81(2.50) | 3.09(0.56) | 26.58(5.07) | 0.11(0.065)a |
| -37.15(0.16) | -1.08(0.16) | 1.86(0.38) | -0.54(0.009) | 0.957 | 0.033 | 0.569 | 0.455 | ||||||
| 19 | -20, 0 | -39.54(0.12) | -1.96(0.16) | 2.91(0.28) | -0.63(0.048) | 0.475 | 0.051 | 1.390 | 1.112 | N | |||
| 20 | -30, 0 | -39.78(0.20) | -1.19(0.22) | 2.24(0.54) | -0.49(0.070) | 0.375 | 0.042 | 0.889 | 0.711 | N | |||
| 22 | 10, -10 | -43.49(0.30) | -1.55(0.23) | 4.25(0.82) | -0.34(0.066) | 1.013 | 0.020 | 0.790 | 0.632 | -40.71(2.10) | 3.59(0.54) | 26.59(3.98) | 0.12(0.063)a |
| 23 | 0, -10 | N | 0.844 | -38.45(1.84) | 2.66(0.71) | 14.25(5.48) | 0.17(0.080)a | ||||||
| 24 | -10, -10 | -40.93(0.29) | -0.61(0.26) | 1.20(2.09) | -0.48(0.016) | 0.660 | 0.034 | 0.385 | 0.308 | -39.34(1.91) | 2.29(0.42) | 20.81(4.50) | 0.10(0.062)a |
| -38.89(0.49) | -1.09(0.32) | 3.15(0.82) | -0.32(0.016) | 0.660 | 0.023 | 0.670 | 0.536 | ||||||
| 25 | -20, -10 | -39.61(0.27) | -1.55(0.31) | 3.00(0.87) | -0.48(0.049) | 0.582 | 0.036 | 1.011 | 0.809 | -41.93(2.42) | 2.58(0.53) | 21.30(4.02) | 0.11(0.078)a |
| 33 | 20, -30 | -46.30(0.18) | -2.38(0.26) | 3.14(0.38) | -0.71(0.055) | 1.000 | 0.042 | 1.241 | 0.993 | -46.05(4.29) | 3.19(0.79) | 32.19(8.33) | 0.09(0.077)a |
| 34 | 10, -30 | -45.04(0.14) | -2.66(0.25) | 3.04(0.34) | -0.82(0.054) | 0.658 | 0.059 | 1.688 | 1.351 | N | |||
| 37 | 20, -40 | -45.14(0.14) | -2.43(0.20) | 3.32(0.31) | -0.68(0.061) | 0.948 | 0.041 | 1.290 | 1.032 | N | |||
| 38 | 10, -40 | -45.20(0.16) | -0.72(0.15) | 1.64(0.64) | -0.41(0.016) | 0.646 | 0.029 | 0.452 | 0.362 | N |
Notes:—— Parameters listed about simultaneously observing H2CO absorption line and H110 RRL, and each one of both. The serial number and offset are indicated in Column one and two corresponding to spectra and color map. indicates that the corresponding spectra could not be detected. These intensity data of H110 RRL is not able to achieve 3 with to line out, so we do not consider them as signal to analysis.
| DR21 | H2CO | H110 | |||||||||||
| (1) | (2) | (3) | (4) | (5) | (6) | (7) | (8) | (9) | (10) | (11) | (12) | (13) | (14) |
| ID | Offset(, ) | Velocity | Flux | Intensity | Velocity | Flux | Intensity | ||||||
| (No.) | (arcmin) | (km s-1) | (Jy km s-1) | (km s-1) | (Jy) | (K) | ( | ( | (km s-1) | (Jy km s-1) | (km s-1) | (Jy) | |
| 04 | -10, 30 | 0.74(0.31) | -0.61(0.16) | 2.10(0.66) | -0.27(0.019) | 0.680 | 0.019 | 0.372 | 0.297 | N | |||
| 05 | -20, 30 | 3.43(0.46) | -1.26(0.24) | 4.84(1.10) | -0.24(0.025) | 0.402 | 0.020 | 0.913 | 0.730 | N | |||
| 07 | 10, 20 | 13.97(0.43) | -0.69(0.19) | 2.09(0.84) | -0.31(0.052) | 0.393 | 0.026 | 0.514 | 0.411 | N | |||
| 08 | 0, 20 | -0.60(0.24) | -0.73(0.16) | 2.08(0.54) | -0.33(0.019) | 0.476 | 0.026 | 0.514 | 0.411 | 2.93(2.00) | 2.09(0.47) | 17.76(4.62) | 0.11(0.055)a |
| 11.90(0.26) | -0.63(0.18) | 2.13(0.85) | -0.28(0.019) | 0.476 | 0.022 | 0.445 | 0.356 | ||||||
| 14.86(0.15) | -0.39(0.13) | 1.20(13.1) | -0.30(0.019) | 0.476 | 0.024 | 0.269 | 0.215 | ||||||
| 17.68(0.27) | -0.34(0.11) | 1.20(5.50) | -0.26(0.019) | 0.476 | 0.021 | 0.233 | 0.186 | ||||||
| 09 | -10, 20 | 1.01(0.16) | -2.94(0.30) | 3.16(0.35) | -0.87(0.034) | 0.434 | 0.073 | 2.168 | 1.735 | N | |||
| 11 | 20, 10 | 10.82(0.33) | -0.85(0.20) | 2.65(0.63) | -0.30(0.027) | 0.406 | 0.025 | 0.624 | 0.499 | 4.70(1.79) | 1.40(0.49) | 10.35(4.29) | 0.12(0.086)a |
| 12 | 10, 10 | 11.23(0.29) | -1.11(0.21) | 3.12(0.73) | -0.33(0.017) | 0.467 | 0.026 | 0.775 | 0.620 | N | |||
| 15.16(0.68) | -0.27(0.16) | 2.06(1.19) | -0.12(0.017) | 0.467 | 0.010 | 0.185 | 0.148 | ||||||
| 13 | 0, 10 | 0.00(0.11) | -2.72(0.18) | 3.45(0.26) | -0.74(0.026) | 0.628 | 0.054 | 1.757 | 1.406 | N | |||
| 12.33(0.18) | -0.73(0.11) | 1.44(0.50) | -0.47(0.026) | 0.628 | 0.034 | 0.461 | 0.369 | ||||||
| 14 | -10, 10 | N | 0.591 | 5.49(1.64) | 2.52(0.49) | 15.19(2.89) | 0.15(0.097)a | ||||||
| 16 | 20, 0 | N | 0.931 | 6.42(3.59) | 3.07(0.79) | 26.44(10.2) | 0.10(0.070)a | ||||||
| 17 | 10, 0 | -0.24(0.24) | -1.08(0.19) | 2.86(0.63) | -0.35(0.058) | 1.136 | 0.019 | 0.516 | 0.413 | 4.73(0.96) | 4.10(0.46) | 17.85(2.46) | 0.21(0.069) |
| 6.24(0.33) | -0.49(0.18) | 2.09(1.12) | -0.22(0.058) | 1.136 | 0.012 | 0.236 | 0.189 | ||||||
| 10.93(0.35) | -0.92(0.18) | 2.91(0.64) | -0.29(0.058) | 1.136 | 0.016 | 0.434 | 0.347 | ||||||
| 21.82(0.51) | -0.62(0.19) | 3.21(1.07) | -0.18(0.058) | 1.136 | 0.010 | 0.296 | 0.237 | ||||||
| 18 | 0, 0 | 0.26(0.03) | -13.76(0.27) | 3.70(0.07) | -3.49(0.164) | 3.128 | 0.103 | 3.590 | 2.872 | 2.14(1.32) | 9.74(0.73) | 34.96(3.10) | 0.26(0.085) |
| 10.91(0.10) | -2.69(0.22) | 2.33(0.20) | -1.08(0.164) | 3.128 | 0.031 | 0.675 | 0.540 | ||||||
| 19 | -10, 0 | 1.63(0.26) | -0.88(0.16) | 2.80(0.57) | -0.29(0.011) | 0.996 | 0.017 | 0.447 | 0.358 | 8.11(1.64) | 3.20(0.53) | 17.51(3.27) | 0.17(0.069)a |
| 12.18(0.28) | -0.54(0.15) | 2.14(0.79) | -0.23(0.011) | 0.996 | 0.013 | 0.271 | 0.217 | ||||||
| 20 | -20, 0 | 1.70(0.07) | -0.77(0.12) | 1.20(2.55) | -0.60(0.000) | 0.772 | 0.040 | 0.452 | 0.362 | 9.73(2.22) | 3.54(0.61) | 25.98(5.34) | 0.12(0.054)a |
| 21 | -30, 0 | 1.77(0.34) | -0.61(0.25) | 2.43(1.56) | -0.23(0.010) | 0.724 | 0.016 | 0.356 | 0.285 | N | |||
| 8.22(0.22) | -0.81(0.17) | 1.78(0.40) | -0.43(0.010) | 0.724 | 0.029 | 0.491 | 0.393 | ||||||
| 22 | 20, -10 | -2.70(0.74) | -0.48(0.22) | 2.99(1.25) | -0.15(0.021) | 1.455 | 0.007 | 0.200 | 0.160 | 6.96(1.18) | 5.88(0.57) | 23.66(2.42) | 0.23(0.067) |
| 6.49(0.16) | -1.27(0.21) | 2.26(0.53) | -0.52(0.021) | 1.455 | 0.025 | 0.528 | 0.423 | ||||||
| 10.60(0.18) | -1.13(0.19) | 2.06(0.35) | -0.51(0.021) | 1.455 | 0.024 | 0.472 | 0.378 | ||||||
| 23 | 10, -10 | 6.44(0.10) | -1.78(0.15) | 2.17(0.17) | -0.77(0.049) | 1.455 | 0.037 | 0.756 | 0.605 | 8.86(0.71) | 7.48(0.50) | 21.37(1.62) | 0.32(0.064) |
| 11.55(0.13) | -1.18(0.18) | 1.90(0.42) | -0.58(0.049) | 1.455 | 0.028 | 0.496 | 0.397 | ||||||
| 24 | 0, -10 | 0.42(0.25) | -1.40(0.19) | 3.64(0.50) | -0.36(0.045) | 1.156 | 0.020 | 0.669 | 0.535 | 8.14(1.07) | 4.33(0.46) | 20.52(2.67) | 0.19(0.063) |
| 6.36(0.16) | -0.86(0.14) | 1.81(0.38) | -0.44(0.045) | 1.156 | 0.024 | 0.408 | 0.326 | ||||||
| 11.21(0.11) | -1.11(0.12) | 1.44(0.47) | -0.72(0.045) | 1.156 | 0.040 | 0.535 | 0.428 | ||||||
| 25 | -10, -10 | 6.04(0.09) | -1.93(0.17) | 2.06(0.19) | -0.88(0.030) | 1.148 | 0.049 | 0.943 | 0.754 | 6.04(1.20) | 3.68(0.46) | 20.14(3.06) | 0.17(0.063)a |
| 26 | -20, -10 | 6.99(0.32) | -1.00(0.22) | 2.76(0.66) | -0.34(0.053) | 0.922 | 0.021 | 0.538 | 0.430 | 4.51(2.09) | 2.80(0.57) | 19.54(3.99) | 0.13(0.072)a |
| 18.41(0.26) | -1.25(0.22) | 2.74(0.52) | -0.43(0.053) | 0.922 | 0.026 | 0.677 | 0.542 | ||||||
| 27 | -30, -10 | 7.88(0.39) | -0.56(0.22) | 1.21(25.2) | -0.43(0.040) | 0.649 | 0.031 | 0.349 | 0.279 | N | |||
| 17.17(0.22) | -2.15(0.25) | 3.69(0.47) | -0.54(0.040) | 0.649 | 0.039 | 1.343 | 1.074 | ||||||
| 28 | 20, -20 | -4.09(0.44) | -1.16(0.32) | 2.89(0.94) | -0.37(0.027) | 1.964 | 0.015 | 0.396 | 0.317 | 0.14(0.68) | 7.20(0.71) | 14.87(1.97) | 0.45(0.095) |
| 6.11(0.36) | -0.60(0.21) | 1.20(1.11) | -0.46(0.027) | 1.964 | 0.018 | 0.205 | 0.164 | ||||||
| 11.14(0.20) | -1.23(0.28) | 1.98(0.59) | -0.58(0.027) | 1.964 | 0.023 | 0.427 | 0.342 | ||||||
| 29 | 10, -20 | 5.87(0.16) | -1.28(0.21) | 1.75(0.25) | -0.68(0.013) | 1.577 | 0.031 | 0.511 | 0.409 | 3.59(1.56) | 6.41(0.90) | 23.39(4.18) | 0.25(0.080) |
| 11.18(0.14) | -2.07(0.26) | 2.31(0.36) | -0.83(0.013) | 1.577 | 0.038 | 0.827 | 0.661 | ||||||
| 30 | 0, -20 | 6.17(0.11) | -2.73(0.33) | 2.03(0.32) | -1.26(0.111) | 1.111 | 0.072 | 1.369 | 1.095 | N | |||
| 11.15(0.25) | -1.14(0.32) | 1.77(0.89) | -0.60(0.111) | 1.111 | 0.034 | 0.558 | 0.446 | ||||||
| 31 | -10, -20 | 6.45(0.04) | -3.91(0.23) | 1.47(0.42) | -2.49(0.105) | 0.682 | 0.188 | 2.603 | 2.083 | N | |||
| 32 | -20, -20 | 6.39(0.09) | -3.36(0.30) | 2.28(0.28) | -1.38(0.126) | 0.674 | 0.101 | 2.155 | 1.724 | N | |||
| 33 | -30, -20 | 5.36(0.15) | -0.44(0.16) | 1.20(3.14) | -0.34(0.051) | 0.523 | 0.026 | 0.296 | 0.237 | N | |||
| 9.57(0.30) | -0.97(0.21) | 2.58(0.59) | -0.35(0.051) | 0.523 | 0.027 | 0.655 | 0.524 | ||||||
| 16.97(0.58) | -0.78(0.23) | 3.56(0.90) | -0.20(0.051) | 0.523 | 0.015 | 0.514 | 0.411 | ||||||
| 34 | 20, -30 | -2.89(0.20) | -1.62(0.25) | 2.51(0.46) | -0.60(0.115) | 0.404 | 0.051 | 1.199 | 0.960 | -2.69(1.15) | 7.54(0.88) | 21.89(3.56) | 0.32(0.085) |
| 12.16(0.39) | -1.09(0.24) | 2.71(0.60) | -0.37(0.115) | 0.404 | 0.031 | 0.791 | 0.633 | ||||||
| 35 | 10, -30 | -2.49(0.29) | -0.62(0.15) | 2.08(0.43) | -0.28(0.010) | 1.064 | 0.016 | 0.310 | 0.248 | N | |||
| 5.64(0.24) | -0.59(0.14) | 1.73(0.55) | -0.32(0.010) | 1.064 | 0.018 | 0.295 | 0.236 | ||||||
| 12.31(0.29) | -0.24(0.12) | 1.20(0.68) | -0.19(0.010) | 1.064 | 0.011 | 0.121 | 0.097 | ||||||
| 36 | 0, -30 | 6.36(0.44) | -0.62(0.17) | 2.33(0.92) | -0.25(0.067) | 0.897 | 0.015 | 0.337 | 0.270 | N | |||
| 37 | -10, -30 | 6.08(0.23) | -0.95(0.23) | 1.71(0.46) | -0.52(0.009) | 1.507 | 0.024 | 0.391 | 0.313 | N | |||
| 38 | -20, -30 | 8.12(0.57) | -1.76(0.36) | 6.09(1.42) | -0.27(0.025) | 0.890 | 0.017 | 0.957 | 0.765 | N | |||
| 10.66(0.49) | -0.27(0.13) | 1.20(0.73) | -0.21(0.025) | 0.890 | 0.013 | 0.146 | 0.117 | ||||||
| 15.10(0.11) | -0.56(0.13) | 1.20(1.55) | -0.43(0.025) | 0.890 | 0.027 | 0.302 | 0.241 | ||||||
| 39 | -30, -30 | 8.71(0.25) | -1.44(0.28) | 2.61(0.63) | -0.51(0.037) | 0.606 | 0.038 | 0.921 | 0.737 | N | |||
| 43 | -10, -40 | 8.18(0.24) | -1.15(0.26) | 2.08(0.53) | -0.52(0.015) | 0.129 | 0.055 | 1.074 | 0.859 | N | |||
| 44 | -20, -40 | 0.11(0.24) | -0.73(0.21) | 1.68(0.61) | -0.41(0.065) | 0.000 | 0.049 | 0.769 | 0.616 | -2.61(2.80) | 3.03(0.75) | 22.15(7.36) | 0.12(0.075)a |
| 8.59(0.24) | -1.41(0.24) | 2.63(0.54) | -0.50(0.065) | 0.000 | 0.060 | 1.477 | 1.182 | ||||||
| 45 | -30, -40 | 0.18(0.48) | -0.50(0.16) | 2.80(0.74) | -0.16(0.036) | 0.094 | 0.017 | 0.450 | 0.360 | N | |||
| 8.91(0.09) | -0.57(0.12) | 1.20(5.32) | -0.45(0.036) | 0.094 | 0.049 | 0.551 | 0.441 |
Notes:—— Parameters listed about simultaneously observing H2CO absorption line and H110 RRL, and each one of both. The serial number and offset are indicated in Column one and two corresponding to spectra and color map. indicates that the corresponding spectra could not be detected. These intensity data of H110 RRL is not able to achieve 3 with to line out, so we do not consider them as signal to analysis.
| NGC2024 | H2CO | H110 | |||||||||||
| (1) | (2) | (3) | (4) | (5) | (6) | (7) | (8) | (9) | (10) | (11) | (12) | (13) | (14) |
| ID | Offset(, ) | Velocity | Flux | Intensity | Velocity | Flux | Intensity | ||||||
| (No.) | (arcmin) | (km s-1) | (Jy km s-1) | (km s-1) | (Jy) | (K) | ( | ( | (km s-1) | (Jy km s-1) | (km s-1) | (Jy) | |
| 01 | 20, 50 | 5.40(0.35) | -0.88(0.17) | 3.51(0.64) | -0.23(0.032) | 0.058 | 0.026 | 0.842 | 0.674 | N | |||
| 10.99(0.26) | -0.48(0.13) | 1.80(0.61) | -0.24(0.032) | 0.058 | 0.027 | 0.451 | 0.361 | ||||||
| 03 | 0, 50 | 7.49(0.29) | -0.19(0.07) | 1.20(1.74) | -0.14(0.001) | 0.024 | 0.016 | 0.180 | 0.144 | N | |||
| 12.27(0.21) | -0.29(0.08) | 1.39(0.42) | -0.19(0.001) | 0.024 | 0.022 | 0.284 | 0.227 | ||||||
| 05 | 20, 40 | 4.01(0.14) | -2.08(0.25) | 2.33(0.39) | -0.83(0.092) | 0.095 | 0.092 | 2.016 | 1.612 | N | |||
| 10.68(0.14) | -1.57(0.20) | 2.04(0.26) | -0.72(0.092) | 0.095 | 0.079 | 1.521 | 1.217 | ||||||
| 06 | 10, 40 | 4.13(0.19) | -0.75(0.18) | 1.91(0.72) | -0.37(0.029) | 0.060 | 0.041 | 0.742 | 0.594 | N | |||
| 10.61(0.14) | -1.46(0.18) | 2.27(0.30) | -0.60(0.029) | 0.060 | 0.068 | 1.449 | 1.159 | ||||||
| 07 | 0, 40 | 11.28(0.26) | -0.80(0.15) | 2.57(0.51) | -0.29(0.050) | 0.038 | 0.033 | 0.796 | 0.637 | N | |||
| 08 | -10, 40 | 11.43(0.08) | -1.31(0.15) | 1.82(0.36) | -0.67(0.002) | 0.034 | 0.078 | 1.337 | 1.070 | N | |||
| 10 | 20, 30 | 5.17(0.49) | -1.15(0.22) | 4.54(1.10) | -0.23(0.028) | 0.125 | 0.024 | 1.025 | 0.820 | N | |||
| 11.47(0.27) | -0.73(0.25) | 1.20(34.1) | -0.56(0.028) | 0.125 | 0.059 | 0.671 | 0.537 | ||||||
| 11 | 10, 30 | 5.28(0.52) | -0.55(0.17) | 2.66(1.18) | -0.19(0.040) | 0.125 | 0.020 | 0.495 | 0.396 | N | |||
| 11.23(0.27) | -1.11(0.18) | 3.16(0.58) | -0.33(0.040) | 0.125 | 0.035 | 1.028 | 0.823 | ||||||
| 12 | 0, 30 | 11.79(0.31) | -1.14(0.20) | 2.91(0.69) | -0.36(0.099) | 0.049 | 0.041 | 1.111 | 0.889 | N | |||
| 13 | -10, 30 | 11.46(0.08) | -0.69(0.12) | 1.20(1.29) | -0.53(0.000) | 0.092 | 0.058 | 0.654 | 0.523 | N | |||
| 16 | 10, 20 | 11.48(0.13) | -0.49(0.12) | 1.77(1.21) | -0.26(0.015) | 0.180 | 0.026 | 0.431 | 0.345 | N | |||
| 14.74(0.14) | -0.44(0.09) | 1.20(0.55) | -0.34(0.015) | 0.180 | 0.034 | 0.383 | 0.307 | ||||||
| 17 | 0, 20 | 11.79(0.16) | -1.27(0.17) | 2.27(0.34) | -0.52(0.024) | 0.201 | 0.052 | 1.100 | 0.880 | N | |||
| 18 | -10, 20 | 11.11(0.40) | -0.53(0.17) | 2.41(0.97) | -0.20(0.023) | 0.001 | 0.023 | 0.531 | 0.425 | N | |||
| 21 | 10, 10 | 7.51(0.15) | -0.78(0.12) | 1.73(0.44) | -0.42(0.005) | 0.300 | 0.038 | 0.621 | 0.497 | N | |||
| 22 | 0, 10 | 6.67(0.23) | -0.62(0.17) | 2.02(0.74) | -0.29(0.008) | 0.783 | 0.019 | 0.362 | 0.289 | 1.08(1.28) | 3.59(0.45) | 20.38(2.87) | 0.16(0.067)a |
| 11.26(0.08) | -2.02(0.14) | 2.27(0.22) | -0.83(0.008) | 0.783 | 0.056 | 1.185 | 0.948 | ||||||
| 23 | -10, 10 | 11.37(0.29) | -0.79(0.15) | 2.80(0.57) | -0.26(0.018) | 0.211 | 0.025 | 0.664 | 0.531 | N | |||
| 26 | 10, 0 | 12.19(0.66) | -0.85(0.29) | 2.72(1.66) | -0.29(0.081) | 0.485 | 0.023 | 0.586 | 0.469 | N | |||
| 27 | 0, 0 | 11.21(0.02) | -10.49(0.27) | 2.18(0.08) | -4.51(0.292) | 5.619 | 0.082 | 1.687 | 1.350 | 4.69(0.18) | 28.03(0.47) | 22.27(0.44) | 1.18(0.080) |
| 28 | -10, 0 | 12.53(0.40) | -1.11(0.19) | 4.35(0.75) | -0.24(0.044) | 0.603 | 0.018 | 0.716 | 0.573 | 5.65(1.24) | 3.69(0.39) | 22.77(2.88) | 0.15(0.049) |
| 30 | 20, -10 | 12.68(0.12) | -1.02(0.16) | 1.91(0.51) | -0.50(0.020) | 0.254 | 0.047 | 0.850 | 0.680 | N | |||
| 31 | 10, -10 | 12.82(0.17) | -1.14(0.16) | 2.42(0.41) | -0.44(0.049) | 0.305 | 0.040 | 0.908 | 0.726 | N | |||
| 32 | 0, -10 | 13.89(0.16) | -1.17(0.16) | 2.15(0.38) | -0.51(0.041) | 0.392 | 0.043 | 0.878 | 0.702 | N | |||
| 33 | -10, -10 | 13.48(0.24) | -0.71(0.15) | 1.51(0.68) | -0.44(0.004) | 0.324 | 0.039 | 0.558 | 0.446 | N | |||
| 36 | 10, -20 | 13.01(0.28) | -0.55(0.12) | 2.28(0.47) | -0.22(0.023) | 0.249 | 0.021 | 0.442 | 0.354 | N | |||
| 37 | 0, -20 | 12.66(0.10) | -1.83(0.15) | 2.26(0.24) | -0.76(0.102) | 0.307 | 0.070 | 1.483 | 1.186 | N | |||
| 38 | -10, -20 | 12.40(0.19) | -0.47(0.14) | 1.20(28.9) | -0.36(0.000) | 0.314 | 0.032 | 0.364 | 0.291 | N | |||
| 41 | 0, -30 | 12.34(0.22) | -1.56(0.23) | 2.98(0.51) | -0.49(0.071) | 0.313 | 0.044 | 1.240 | 0.992 | N | |||
| 42 | -10, -30 | 13.13(0.29) | -0.55(0.15) | 1.80(0.44) | -0.28(0.004) | 0.371 | 0.024 | 0.406 | 0.325 | N |
Notes:—— Parameters listed about simultaneously observing H2CO absorption line and H110 RRL, and each one of both. The serial number and offset are indicated in Column one and two corresponding to spectra and color map. indicates that the corresponding spectra could not be detected. These intensity data of H110 RRL is not able to achieve 3 with to line out, so we do not consider them as signal to analysis.