Identification of Bursting Water Maser Features in Orion KL
Abstract
In February 2011, a burst event of the H2O maser in Orion KL (Kleinmann-Low object) has started after 13-year silence. This is the third time to detect such phenomena in Orion KL, followed by those in 1979-1985 and 1998. We have carried out astrometric observations of the bursting H2O maser features in Orion KL with VERA (VLBI Exploration of Radio Astrometry), a Japanese VLBI network dedicated for astrometry. The total flux of the bursting feature at the LSR velocity of 7.58 km s-1 reaches 4.4104 Jy in March 2011. The intensity of the bursting feature is three orders of magnitudes larger than that of the same velocity feature in the quiescent phase in 2006. Two months later, another new feature appears at the LSR velocity of 6.95 km s-1 in May 2011, separated by 12 mas north of the 7.58 km s-1 feature. Thus, the current burst occurs at two spatially different features. The bursting masers are elongated along the northwest-southeast direction as reported in the previous burst in 1998. We determine the absolute positions of the bursting features for the first time ever with a submilli-arcsecond (mas) accuracy. Their positions are coincident with the shocked molecular gas called the Orion Compact Ridge. We tentatively detect the absolute proper motions of the bursting features toward southwest direction. It is most likely that the outflow from the radio source I or another young stellar object interacting with the Compact Ridge is a possible origin of the H2O maser burst.
1 Introduction
In the context of astronomical masers, an enormous outburst of the H2O maser at 22 GHz (=1.3 cm) in the Orion KL (Kleinmann-Low object) region is one of the most enigmatic phenomena. The first H2O maser burst in Orion KL was discovered in 1979 and the active phase continued until 1985 with several flare-up events (Matveenko et al., 1988; Garay et al., 1989). Based on the VLBI (very long baseline interferometer) observations, the bursting maser feature was revealed to have east-west elongation which was interpreted as a circumstellar disk (Matveenko et al., 1988). Followed by the active phase for about 6 years, the quiescent phase lasted from 1985 to 1997. In this phase, a jet-like maser feature with the northwest-southeast elongation was identified (Matveyenko et al., 1998). The second burst was detected at the end of 1997 and monitoring observations were carried out with single-dish radio telescopes and VLBI (Omodaka et al., 1999; Shimoikura et al., 2005). The structure in the second burst phase was consistent with that in the adjacent quiescent phase (Omodaka et al., 1999; Matveyenko et al., 2004; Shimoikura et al., 2005). The maximum flux density flared up to an order of 106 Jy in both burst phases. The line-of-sight velocity with respect to the local standard of rest (LSR) of the bursting maser was 8 km s-1 and was unchanged in both phases, suggesting a common origin.
Two different scenarios have been proposed for this outburst; one is related to the existence of a circumstellar disk (e.g. Matveenko et al., 1988; Shimoikura et al., 2005) and another is the jet/outflow driven by young stellar object (YSO) in the Orion Nebula (Garay et al., 1989; Matveyenko et al., 2004). However, no evidence of either circumstellar disk or the jet/outflow system associated with the bursting maser has been identified, and hence, the origin of this maser burst is still unclear.
The third-time burst of the H2O maser in Orion KL has started since February 2011 (Tolmachev, 2011). The LSR velocity of the bursting maser is again 7.8 km s-1. The burst appears to be possibly periodic with an interval of about 13 years (1985, 1998, and 2011), which could support the hypothesis of the common origin.
In order to explore the mechanism of this maser burst, we have started astrometric observations of the bursting H2O maser in Orion KL with VERA (VLBI Exploration of Radio Astrometry), a Japanese VLBI network developed for astrometry. Here we report the result of our absolute position measurement of the bursting maser features with a submilli-arcsecond (mas) accuracy. It allows us to measure the proper motions of the bursting features. Further detailed studies on the structure and time variation of the bursting maser features will be undertaken.
2 Observations
Observations of the H2O maser (-, 22235.080 MHz) in Orion KL were carried out on 2011 March 09, May 01, and May 17 with VERA. The weather conditions were good at all of the four stations (see Figure 1 of Petrov et al., 2007), and the typical system noise temperature was 100-200 K. The maximum baseline length was 2270 km and the uniform-weighted synthesized beam size (FWMH) was 1.7 mas0.9 mas with a position angle of 143 degrees on average. We employed the dual beam observation mode, in which Orion KL and an ICRF source J054138.0-054149 (Ma et al., 1998) were observed simultaneously. The data were recorded onto magnetic tapes at a rate of 1024 Mbps, providing a total bandwidth of 256 MHz in which one IF channel and the rest of 15 IF channels with 16 MHz bandwidth each were assigned to Orion KL and ICRF J054138.0-054149, respectively. For the H2O maser lines, a spectral resolution was set to be 15.625 kHz, corresponding to a velocity resolution of 0.21 km s-1. A bright continuum source, ICRF J053056.4+133155, was observed every 80 minutes for bandpass and delay calibration. Calibration and imaging were performed using the NRAO Astronomical Image Processing System (AIPS) software package.
In addition to the present observations, we reanalyzed the archive data of the previous monitoring observations of Orion KL (Hirota et al., 2007) conducted on 2006 July 15 in order to compare the results of the new observations. Details of the observation and data analysis are described in Hirota et al. (2007).
3 Results and Discussion
3.1 Images and spectra of the bursting maser features
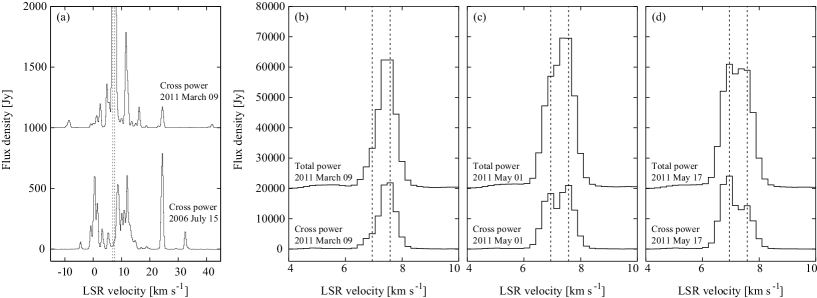
The H2O maser burst is detected at the peak LSR velocity channel of 7.58 km s-1 in the first epoch of observation on 2011 March 09, as shown in Figure 1. The total flux density is (4.40.3) Jy. The peak velocity is apparently shifted toward lower velocity channel compared with that in the previous burst event, 7.64 km s-1 (Shimoikura et al., 2005). The correlated flux, Jy, recovers 50% of the total flux density. Due to the lack of short baselines in VERA, extended emission component would be resolved out. Two months later from the first epoch, another new velocity component at 6.95 km s-1 appears in 2011 May 01 while the flux density of the 7.58 km s-1 component gradually decreases. The total flux density of the 6.95 km s-1 component becomes comparable with that of the 7.58 km s-1 component on 2011 May 17.
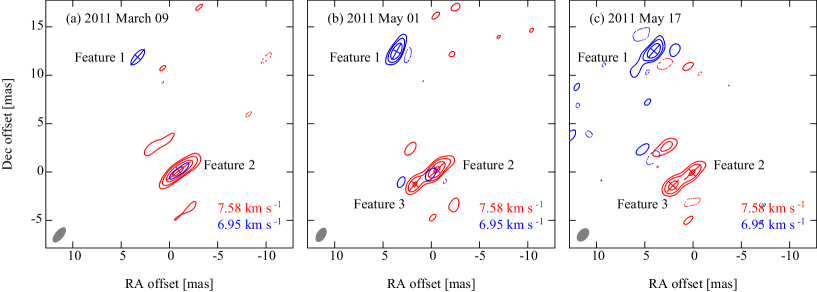
We have successfully obtained phase-referenced images of the bursting H2O maser features. The position, peak intensity, and size of each feature are listed in Table 1. Note that due to the loss of coherence caused by the atmospheric zenith delay residual (Hirota et al., 2007, and references therein) in the phase-referencing calibration, the peak flux density is degraded by a factor of 0.5-0.9 compared with the results obtained from the conventional self-calibration method (columns 6 and 7 in Table 1). Figure 2 shows the phase-referenced images of the bursting maser features at the LSR velocity channels of 6.95 km s-1 and 7.58 km s-1. In the first epoch in March 2011, the 7.58 km s-1 feature shows single-peaked structure while it splits into double peaks in May 2011. In addition, another spatially distinct feature at the LSR velocity of 6.95 km s-1 appears at 12 mas north as also seen in the spectra (Figure 1). Therefore, the current maser burst is turned out to occur at two spatially different features.
The maser features elongate along the northwest-southeast direction. Results of the two-dimensional Gaussian fitting on the phase-referenced images are also summarized in Table 1. The size of 1 mas corresponds to the linear size of 0.4 AU when adopting the distance to Orion KL to be 420 pc (Hirota et al., 2007; Kim et al., 2008). The structures of the bursting maser features are sometimes resolved along their major axes (i.e. those with the major axes of larger than 2 mas). The 7.58 km s-1 feature shows a double-peaked structure with a separation angle of 2.7 mas on 2011 May 01 and 17 as shown in Figures 2(b) and (c). The size of the maser feature is comparable to or slightly smaller than that found in the previous burst in 1998 (1.8 mas0.8 mas-5.3 mas1.5 mas; Shimoikura et al., 2005). The brightness temperature reaches 2.31013 K. The velocity width of the total power spectrum of the bursting maser is 0.760.07 km s-1 (FWHM) for the first epoch. When we fit the velocity width of each feature at different velocity and position derived from the Gaussian fitting of the self-calibrated images (Table 1), we obtain the average velocity width of 0.610.03 km s-1. These velocity widths are broader than that in the previous burst, 0.40-0.48 km s-1 (Shimoikura et al., 2005).
3.2 Astrometry of the bursting maser features
In the previous active phases, high-resolution observations were conducted with the VLA and VLBI (Matveenko et al., 1988; Garay et al., 1989; Greenhill et al., 1998; Omodaka et al., 1999; Matveyenko et al., 2004; Shimoikura et al., 2005). With the VLA, the positional accuracy was 50-100 mas even in the most extended A-configuration (e.g. Greenhill et al., 1998). Although VLBI observations achieved much higher relative position accuracy of 0.05-0.1 mas, the absolute position information was usually lost by the self-calibration analysis.
In contrast, we have carried out phase-referencing VLBI astrometry, in which one can measure the position of the target maser source with respect to the extragalactic position reference source. For instance, the accuracy of absolute position measurement with VERA is reported to be 0.36 mas and 0.74 mas in right ascension and declination directions, respectively, for the previous H2O maser observations in Orion KL (Hirota et al., 2007). The main source of the astrometric errors in the VERA observations is the variation of the structures of maser features as well as the atmospheric zenith delay residual due to the troposphere and the positional accuracy of the reference source (Ma et al., 1998).
The observed maser positions are summarized in Table 1. This is the first time ever to measure the absolute positions of the bursting maser features in Orion KL with the submilli-arcsecond accuracy. The current position of the bursting maser is shifted by +70 mas and -200 mas in right ascension and declination, respectively, with respect to that of the previous burst in 1983 (e.g. Greenhill et al., 1998), probably because of much worse astrometric accuracy of previous observations than that of our present result. On the other hand, the position of the bursting maser feature measured in 1998 (Omodaka et al., 1999) is different by 2″ in declination. This is due to the lower positional accuracy of an order of 1″ in the fringe-rate mapping method in particular for declination which is typical for the interferometric observations of target sources close to the equator such as Orion KL.
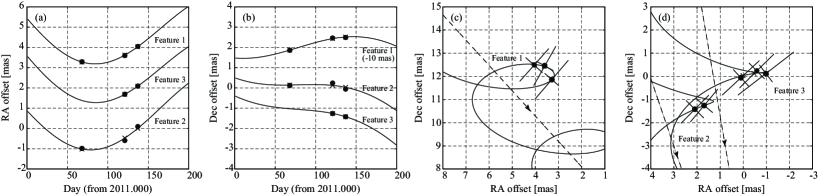
We have measured the absolute proper motions of three bursting maser features as shown in Table 2 and Figure 3. Taking into account the annual parallax of Orion KL of 2.39 mas (Kim et al., 2008), we obtain the absolute proper motions of 4-9 mas yr-1 or 8-18 km s-1 toward southwest direction. At first glance, they seem inconsistent with the apparent position movement in the phase-referenced images due to the relatively large parallax approximately toward the eastward direction. Although the present results contain large uncertainties due to the short monitoring period (3 months), the absolute proper motions could be attributed to the outflow in the Orion KL region as discussed below.
We tentatively identify the possible counterpart of the bursting maser in the quiescent phase data on 2006 July 15 at the peak LSR velocity channel of 7.37 km s-1, according to the similarity in the line-of-sight velocity, position (within 100 mas from that in March 2011) and the structure (NW-SE elongation). The position is also listed in Table 1. The peak intensity of the phase-referenced image is only 19.61.4 Jy beam-1 on 2006 July 15 (see Table 1). The peak intensity derived from the conventional self-calibrated map is 39.60.5 Jy beam-1. The intensity of the bursting feature is three orders of magnitude greater than that of this feature in the quiescent phase.
Judging from the similarities in peak LSR velocity, position, and structure among the detected features in 2011, 2006, and earlier, they could be attributed to the common origin. However, it is unlikely that the bulk of the bursting gas clump would be identical throughout every burst and quiescent phases because the time span of observations (5 yrs) is longer than the typical life time of the H2O masers in Orion KL (1 yr; see Figure 1 in Hirota et al., 2007). In fact, we can see significant time variation of velocity and spatial structure of the bursting maser features even within the present monitoring observations for only two months. If the gas clump of the bursting maser feature would be identical to that of the possible counterpart detected in 2006, one of the features should show an absolute proper motion of (+8 mas yr-1, -17 mas yr-1), which corresponds to the position movement by (+34 mas, -80 mas) in right ascension and declination, respectively, during the 5-years separation. We did not detect such a large proper motion in our astrometric data from March to May 2011.
We also find two other maser features at the same velocity range 8 km s-1 in the quiescent phase in 2006. These positions are shifted by (-1.0″,-3.1″) and (+1.7″, -5.4″) from the bursting maser features. If either of them was identical to the bursting feature, the proper motion would be unrealistically large, 1400-2400 km s-1, according to the position difference during the 5-year separation in our VERA observations. Therefore, we conclude that no maser feature detected in 2006 is identical to those in the bursting phase in 2011.
3.3 Origin of the bursting maser features
In this section, we discuss a possible powering source of the bursting maser features. One of the most plausible interpretations is related to the outflow from YSO(s) in the Orion KL region as proposed by Garay et al. (1989). It has long been established that the H2O masers in Orion KL are excited by interaction with outflow and ambient dense gas (Genzel et al., 1981). The most possible powering source is the radio source I which drives northeast-southwest low-velocity outflow (Plambeck et al., 2009). The bursting maser features are located at 8″ or 3400 AU southwest from source I, and is coincident with the interacting region between the outflow and a dense ambient gas, which is called the Orion Compact Ridge (e.g. Liu et al., 2002). Although the elongation of the bursting maser features (PA=130-150 degrees) are perpendicular to the direction to source I, the maser features could trace the shocked layer between the low-velocity outflow and the Compact Ridge. The H2O maser burst may occur at the different part of the shocked layer when the episodic or possibly 13 year-periodic outflow from source I interacts with the Compact Ridge. The magnitude of the proper motions of the bursting maser features are 16-20 km s-1 pointing toward the west to southwest direction when we subtract the absolute proper motion of source I (6.3 mas yr-1, -4.2 mas yr-1) recently reported by Goddi et al. (2011). Interestingly, they are roughly consistent with the low-velocity outflow from source I (Genzel et al., 1981) although this should be confirmed by the further VLBI monitoring observations.
Nevertheless, it is still unclear why only the 8 km s-1 features show such anomalous outburst. It should be noted that the current burst event cannot be explained by the local phenomenon around each feature with the scale of a few milliarcseconds (e.g. Matveenko et al., 1988; Shimoikura et al., 2005) because the maser burst is occurring at two distinct features separated by 12 mas and at different velocities. One of the possibilities is that powerful outflows from source I may interact with the dense core associated with a pre-existing YSO in the Compact Ridge region as suggested by Garay et al. (1989). What makes the bursting features always at about 8 km s-1 would be that it is the rest velocity of the Compact Ridge (e.g. Liu et al., 2002). The low-velocity outflow hitting at any fortuitous place in the Compact Ridge may amplify the maser emission most efficiently at the rest velocity, leading to such features. According to the SIMBAD database, there are number of closer infrared, radio and X-ray sources around the bursting maser features than source I. The nearest YSO candidate is the radio continuum source R, which is 0.5″ southwest from the bursting maser features. A millimeter and infrared counterpart, HC438, is also associated with the same source (Eisner et al., 2008). Submillimeter continuum emission peaks are detected within their beam widths (Tang et al., 2010; Zapata et al., 2011). Although the mass of the submillimeter core is estimated to be 4 M (Tang et al., 2010), the nature of this source, whether it is a self-luminous YSO or not, is still unclear. Thus, we cannot definitely identify one of these sources as a powering source of the bursting maser features only based on its proximity at this moment.
4 Summary
We have successfully measured the absolute positions of the bursting H2O maser features in Orion KL with the VLBI astrometry technique using VERA. This is the first time ever to identify the bursting maser features with better than the milli-arcsecond accuracy. The burst event is found to be occurring at two spatially different maser features. These features are located in the interacting region of the outflow from the radio source I and the Orion Compact Ridge. Although the spatial and velocity structure of the bursting masers are variable with time, the position and structure of the bursting masers are similar to those in the previous burst phases, implying a common origin. We suggest that the outflow from source I or another YSO in the Compact Ridge region could be a possible powering source of the bursting maser features.
If the current burst phase persists for one year as in the case of previous bursts, we will be able to determine the proper motions of the bursting maser features more accurately through our VLBI astrometry with VERA. They will be crucial to reveal dynamical structure of the masing region. For instance, we will provide novel information on the VLBI images and proper motions to construct three-dimensional dynamical model of the outflow. If the bursting masers are associated with a circumstellar disk, we will be able to derive the mass of the central protostar by directly measuring the rotating motion. In addition, high spatial resolution observations with ALMA and EVLA of the thermal molecular lines and continuum emissions from centimeter to submillimeter wavelengths are still indispensable to identify the powering source of the bursting maser along with the velocity structure of possible outflow from it. All of these results are essential to shed light on the emission mechanism and origin of the burst of the maser features in Orion KL, as well as the driving source(s) of complex outflows in this region.
References
- Eisner et al. (2008) Eisner, J. A., Plambeck, R. L., Carpenter, J. M., Corder, S. A., Qi, C., & Wilner, D. 2008, ApJ, 683, 304
- Garay et al. (1989) Garay, G., Moran, J. M., & Haschick, A. D. 1989, 338, 244
- Genzel et al. (1981) Genzel, R., Reid, M. J., Moran, J. M., & Downes, D. 1981, ApJ, 244, 884
- Goddi et al. (2011) Goddi, C., Humphreys, E. M. L., Greenhill, L. J., Chandler, C. J., & Matthews, L. D. 2011, ApJ, 728, 15
- Greenhill et al. (1998) Greenhill, L. J., Gwinn, C. R., Schwartz, C., Moran, J. M., & Diamond, P. J. 1998, Nature, 396, 650
- Liu et al. (2002) Liu, S. -Y., Girart, J. M., Remijan, A., & Snyder, L. E. 2002, ApJ, 576, 255
- Ma et al. (1998) Ma, C. et al. 1998, AJ, 116, 516
- Matveenko et al. (1988) Matveyenko, L. I., Graham, D. A., & Diamond, P. J. 1988, Sov. Astron. Lett., 14, 468
- Matveyenko et al. (1998) Matveyenko, L. I., Diamond, P. J., & Graham, D. A. 1998, Astron. Lett., 24, 623
- Matveyenko et al. (2004) Matveyenko, L. I., Zhakharin, K. M., Diamond, P. J., & Graham, D. A. 2004, Astron. Lett., 30, 100
- Hirota et al. (2007) Hirota, T. et al. 2007, PAJS, 59, 897
- Kim et al. (2008) Kim, M. K. et al. 2008, PASJ, 60, 991
- Omodaka et al. (1999) Omodaka, T. et al. 1999, PASJ, 51, 333
- Petrov et al. (2007) Petrov, L., Hirota, T., Honma, M., Shibata, K. M. Jike, T., Kobayashi, H. 2007, AJ, 133, 2487
- Plambeck et al. (2009) Plambeck, R. L. et al. 2009, ApJ, 704, L25
- Shimoikura et al. (2005) Shimoikura, T., Kobayashi, H., Omodaka, T., Diamond, P. J., Matveyenko, L. I., & Fujisawa, K. 2005, ApJ, 634, 459
- Tang et al. (2010) Tang, Y. W., Ho, P. T. P., Koch, P. M., & Rao, R. 2010, ApJ, 717, 1262
- Tolmachev (2011) Tolmachev, A. 2011, ATel, 3177
- Zapata et al. (2011) Zapata, L. A., Schmid-Burgk, J., & Menten, K. M. 2011, A&A, 529, A24
| Feature | bbPeak intensity derived from the phase-referencing method. | ccPeak intensity derived from the self-calibration method. | PA | ||||||
|---|---|---|---|---|---|---|---|---|---|
| Epoch | IDaaFeature IDs are shown in Figure 2. | (km s-1) | (mas) | (mas) | (Jy beam-1) | (Jy beam-1) | (mas) | (mas) | (degree) |
| July 15 2006 | 7.37 | -34.200.05 | 79.560.05 | (1.960.14)101 | (3.960.05)101 | 2.140.15 | 0.760.06 | 139.02.4 | |
| March 09 2011 | 1 | 6.95 | 3.290.02 | 11.860.02 | (0.290.01)104 | (0.3780.002)104 | 2.180.07 | 0.800.03 | 139.01.1 |
| 2 | 7.58 | -0.980.03 | 0.120.02 | (1.520.04)104 | (1.9580.002)104 | 3.030.08 | 0.900.02 | 127.50.7 | |
| May 01 2011 | 1 | 6.95 | 3.600.01 | 12.460.02 | (1.280.03)104 | (1.5670.009)104 | 1.930.04 | 0.820.02 | 150.71.0 |
| 2 | 7.58 | -0.590.02 | 0.240.02 | (1.450.04)104 | (1.6800.004)104 | 2.070.05 | 0.930.02 | 134.51.1 | |
| 3 | 7.58 | 1.690.03 | -1.260.03 | (0.680.04)104 | (0.8190.004)104 | 1.810.10 | 0.930.05 | 140.03.0 | |
| May 17 2011 | 1 | 6.95 | 4.050.02 | 12.490.02 | (1.250.04)104 | (1.8890.016)104 | 1.870.06 | 0.960.03 | 138.42.0 |
| 2 | 7.58 | 0.100.03 | -0.060.03 | (0.710.03)104 | (1.0330.004)104 | 2.180.10 | 0.960.04 | 132.91.9 | |
| 3 | 7.58 | 2.090.02 | -1.420.02 | (0.840.03)104 | (1.0980.004)104 | 1.700.06 | 1.060.04 | 135.63.2 |
Note. — Reference position is = and =′36″.475 (J2000).
| Feature | |||
|---|---|---|---|
| IDaaFeature IDs are shown in Figure 2. | (km s-1) | (mas yr-1) | (mas yr-1) |
| 1 | 6.95 | -2.60.8 | -2.80.8 |
| 2 | 7.58 | -1.20.8 | -6.80.8 |
| 3 | 7.58 | -2.83.6 | -8.33.6 |