A Multi-Epoch, Simultaneous Water and Methanol Maser Survey Toward Intermediate-Mass Young Stellar Objects
Abstract
We report a multi-epoch, simultaneous 22 GHz H2O and 44 GHz Class I CH3OH maser line survey toward 180 intermediate-mass young stellar objects, including 14 Class 0, 19 Class I objects, and 147 Herbig Ae/Be stars. We detected H2O and CH3OH maser emission toward 16 (9 %) and 10 (6 %) sources with 1 new H2O and 6 new CH3OH maser sources. The detection rates of both masers rapidly decrease as the central (proto)stars evolve, which is contrary to the trends in high-mass star-forming regions. This suggests that the excitations of the two masers are closely related to the evolutionary stage of the central (proto)stars and the circumstellar environments. H2O maser velocities deviate on average 9 km s-1 from the ambient gas velocities whereas CH3OH maser velocities match quite well with the ambient gas velocities. For both maser emissions, large velocity differences ( and ) are mostly confined to Class 0 objects. The formation and disappearance of H2O masers is frequent and their integrated intensities change by up to two orders of magnitude. In contrast, CH3OH maser lines usually show no significant change in intensity, shape, or velocity. This is consistent with the previous suggestion that H2O maser emission originates from the base of an outflow while 44 GHz Class I CH3OH maser emission arises from the interaction region of the outflow with the ambient gas. The isotropic maser luminosities are well correlated with the bolometric luminosities of the central objects. The fitted relations are and .
1 INTRODUCTION
Maser emission is an important signpost of star formation, especially at the early stages. Since the discovery of the first maser line, the OH emission at a frequency of 1665 MHz by Weaver et al. (1965), many surveys have been performed toward star-forming regions at various frequencies, e.g., 1.66540 GHz and 1.66736 GHz (OH maser lines), 6.66852 GHz (Class II CH3OH maser line), 22.23508 GHz (H2O maser line), 42.82059 GHz and 43.12208 GHz (SiO maser lines), and 44.06943 GHz (Class I CH3OH maser line).
22 GHz H2O masers are thought to be pumped by excitation of the H2O rotation states in collisions with molecules (Elitzur et al., 1989). Previous surveys of H2O masers have shown that this maser is frequently observed toward young stellar objects (YSOs) over a wide range of masses (Genzel & Downes 1977; Rodriguez et al. 1980) and exhibits a wide range of relative velocities with respect to the parental dense cores (Felli et al. 1992; Furuya et al. 2005; Breen et al. 2010; Caswell & Breen 2010). High resolution studies of the individual YSOs have revealed that H2O masers are located very close () to the central (proto)stars (Claussen et al. 1998; Martí et al. 1999; Seth et al. 2002; Furuya et al. 2005).
CH3OH masers are the most recent maser species to be intensively studied. There are numerous transitions that can be divided into two classes, I and II, according to the classification of Menten (1991). Class I CH3OH maser transitions include the , , , and lines at 36, 44, 84, and 95 GHz, while Class II CH3OH maser transitions include the , , and lines at 6.7, 12, and 157 GHz. Even though both classes are commonly observed in (high-mass) star-forming regions, their pumping mechanisms are known to be different. Using theoretical models, Cragg et al. (1992) suggested that Class I CH3OH masers result from collisional excitation, while class II CH3OH masers appear when there is a source of continuum radiation.
The CH3OH maser at 44 GHz is the most common and strongest Class I maser. Nevertheless, only sources have been detected until now (Val’tts et al., 2010). 44 GHz Class I CH3OH masers are thought to be associated mainly with high-mass star formation, yet interferometric observations found that they are usually offset by pc from other signposts of star formation, such as ultracompact HII (UCHII) regions, infrared sources, and H2O masers (Kurtz et al. 2004; Cyganowski et al. 2009). The observed 44 GHz CH3OH maser velocities are different from the ambient molecular gas velocities by 10 km s-1 (Bachiller et al. 1990; Fontani et al. 2010), which is much smaller compared to H2O maser relative velocities.
Intermediate-mass stars have masses of 210 . These lower and upper boundaries are of importance. First, pre-main sequence (PMS) stars with masses are expected to follow fully radiative tracks once the quasi-static contraction has ended (Waters & Waelkens, 1998). This implies that these stars could evolve in different ways from lower-mass stars. Second, stars more massive than spend their whole PMS stage as obscured objects (Waters & Waelkens, 1998), which means that they are not visible until they reach the main sequence. Intermediate-mass YSOs (IMYSOs) share many characteristics with their high-mass counterparts, but many of them are located far closer to the Sun and are less deeply embedded (Alonso-Albi et al., 2009). Thus, it would be helpful to study IMYSOs to understand high-mass star formation.
Despite the importance of studying IMYSOs, no systematic maser line surveys toward them have been undertaken so far. Maser observations toward IMYSOs were usually made as a part of surveys targeting low-mass YSOs (e.g., Claussen et al. 1996; Furuya et al. 2003). Otherwise, maser surveys have been limited to Herbig Ae/Be (HAeBe) stars (e.g., Palla & Prusti 1993), which are recognized as intermediate-mass PMS stars (see Thé et al. 1994 and references therein): have spectral types of A or earlier, with emission lines; lie in an obscured region; and illuminate fairly bright nebulosity in their immediate vicinity.
In this study, we present a multi-epoch, simultaneous H2O and 44 GHz Class I CH3OH maser line survey toward 180 IMYSOs in various evolutionary stages. This paper is organized as follows. The source selection and the observations are described in Section 2 and 3, respectively. We present the results with some comments on the individual sources in Section 4 and discuss the observational results in Section 5. We summarize the main results in Section 6.
2 SOURCE SELECTION
To define our sample of IMYSOs, we collected sources from published studies satisfying one of the following two criteria: (1) protostellar or PMS objects with bolometric luminosities of , which are thought to be the precursors of intermediate-mass stars; or (2) known or candidate HAeBe stars. All selected sources have declinations greater than .
We first selected objects that satisfy criterion (1): 14 Class I objects from Saraceno et al. (1996); 4 Class 0, 3 Class 0/I, 5 Class I, 1 HAeBe, and 9 unclassified sources from Furuya et al. (2003); 4 Class 0, 5 Class 0/I, 4 Class I, and 1 unclassified source from Froebrich (2005); 7 Class 0 and 2 Class I objects from Alonso-Albi et al. (2010). To clarify the evolutionary stages of the collected unclassified objects, we consulted additional classification works, which are noted in Column 5 of Table A Multi-Epoch, Simultaneous Water and Methanol Maser Survey Toward Intermediate-Mass Young Stellar Objects. Considering the overlapped sources from the references mentioned above, we produced a sample containing 14 Class 0, 19 Class I, and 2 HAeBe objects from the first criterion.
We then collected objects satisfying criterion (2). They are primarily selected from catalogs published by Thé et al. (1994) and Vieira et al. (2003). Thé et al. (1994) presented 108 Be and Ae stars, which were historically recognized as true members or potential candidates of the HAeBe stellar group, and Vieira et al. (2003) suggested 131 HAeBe stars and candidates. Of members in the two catalogs, 86 sources in Thé et al. (1994) and 76 sources in Vieira et al. (2003) are north of ∘ with 22 sources in common. Our sample also contains five other HAeBe stars: BD+24∘676, BD+41∘3731, V517 Cyg, and V1057 Cyg from Palla & Prusti (1993), and V1318 CygS from Palla et al. (1995). Thus, the complete sample satisfying the second criterion would be 145 HAeBe stars.
In summary, our sample consists of 180 IMYSOs: 14 Class 0, 19 Class I, and 147 HAeBe stars. The objects in our sample are listed in Table A Multi-Epoch, Simultaneous Water and Methanol Maser Survey Toward Intermediate-Mass Young Stellar Objects.
3 OBSERVATIONS
We carried out a multi-epoch, simultaneous survey of H2O (22.23508 GHz) and class I CH3OH (44.06943 GHz) maser lines toward 180 IMYSOs. The observations were performed using the Korean Very Long Baseline Interferometry Network (KVN) radio telescope at the Yonsei station over three different periods. The first observations were conducted toward all of the 180 IMYSO samples during 21 days from 2010 January to May. On 2010 October 20 and December 2, the second and third epochs were observed toward the 26 objects that showed maser emission in the first epoch.
The telescope is equipped with a multi-frequency receiving system, which makes it possible to observe at both frequencies simultaneously (Han et al., 2008). The 86 GHz and 129 GHz receivers will be added to the receiving system in 2011 for simultaneous observations in four different frequency bands. We used 4096 channel Digital Spectrometers, each with 32 MHz bandwidth. Table 2 presents a summary of the observations.
The pointing and focus checks were made every 2 hr using nearby known strong H2O maser sources. The pointing accuracy was maintained to better than 5′′ during the observations. The data were calibrated by the standard chopper wheel method and the line intensity was obtained on the scale. The conversion factors between and the flux density are 11.1 Jy K-1 at 22 GHz and 11.6 Jy K-1 at 44 GHz.
All the observations were made using position switching mode with total (ON+OFF) integration time of 30 minutes, which typically yields about rms noise levels for both maser transitions at velocity resolution. Since the KVN telescopes are of the shaped Cassegrain type, they have a smaller full width at half-maximum (FWHM) primary beam and much higher (14 dB) first sidelobe levels than conventional Cassegrain antennas with the same size primary reflectors (Kim et al. 2011; Lee et al. 2011, in preparation). The first sidelobes are separated by about 1.5 times the FWHM from the primary beam center. To determine whether the detected maser emission is contaminated by nearby bright maser sources, we mapped an area of 1.5 FWHM 1.5 FWHM around each source with detectable maser emission using half beam spacing. All data were reduced with the CLASS software.
4 RESULTS
4.1 Overall Results
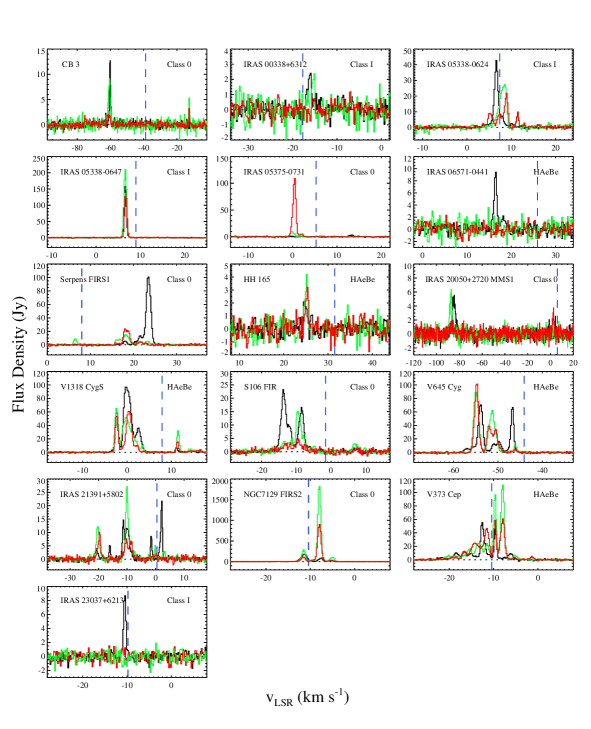
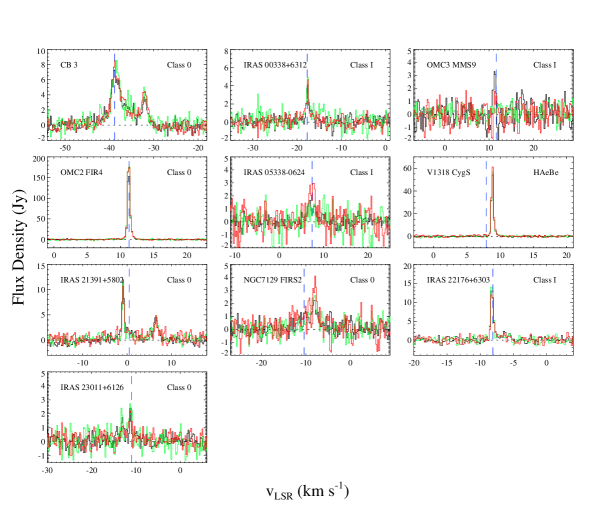
Of the 180 IMYSOs observed, we detected H2O and CH3OH maser emission toward 20 and 12 sources, respectively (Figures 1 and 2). All the detected maser lines are limited to signals stronger than the 3 rms noise level. However, several objects are located close enough to one another that they fall within a single beam or its sidelobes. Further analysis shows that four H2O and two CH3OH masers do not arise from the target IMYSOs. Those sources will be discussed in detail below. In total, 16 sources show H2O maser emission and 10 sources show CH3OH maser emission. Six objects emit both H2O and CH3OH maser emission. Consequently, the detection rates of H2O masers and CH3OH masers are (16/180) and (10/180), respectively. One intriguing source is IRAS 20050+2720 MMS1, which shows extremely blueshifted () H2O maser line emission with respect to the molecular gas. Furuya et al. (2003) suggested that this emission might be related to an extremely high-velocity CO outflow emanating from the central protostar (Bachiller et al., 1995). The observed properties of all detected H2O and CH3OH maser lines are presented in Tables 3 and 4: the source name in Column 1, the observing date in Column 2, the Gaussian-fitted line flux, peak velocity, and line width (FWHM) in Columns 3 - 5, the integrated line flux, peak intensity, and peak velocity in Columns 6 - 8, and the equivalent width (/) in Column 9.
Table 5 exhibits the detection rates of H2O and CH3OH masers for the sources in different evolutionary stages. The detection rates of both masers decrease substantially as the central (proto)stars evolve. The detection rate of H2O masers is for Class 0 objects, while the rates are and for Class I objects and HAeBe stars, respectively. This trend is also seen in the case of CH3OH masers. The detection rate of CH3OH masers toward Class 0 objects is , which is much higher than those of Class I () and HAeBe () sources.
It should be noted that the detection rates of H2O and 44 GHz CH3OH masers for HAeBe stars and candidates in our survey might be lower limits for bona fide intermediate-mass PMS stars. Although the classification criteria introduced in Section 1 were intended to identify IMYSOs, some of the HAeBe candidates in our sample may not be in the PMS phase. The classification criteria allow contamination with objects such as post-asymptotic giant branch stars and protoplanetary nebulae, which could exhibit similar observational features (Thé et al. 1994; Sartori et al. 2010; Vieira et al. 2011). For example, Sartori et al. (2010) tested the young nature of 93 HAeBe candidates selected from the sample of Vieira et al. (2003), and concluded that at least 71 (76%) sources are PMS stars but 7 sources are evolved stars. Our sample contains 22 (15%) sources with ambiguity in their classification. They are indicated with question marks in Column 4 of Table A Multi-Epoch, Simultaneous Water and Methanol Maser Survey Toward Intermediate-Mass Young Stellar Objects. None of them show H2O or CH3OH maser emission. Even after accounting for this contamination, however, the detection rates of both masers toward intermediate PMS stars would still be much lower than those of Class 0 and Class I objects.
In this survey, we report the first detection of H2O maser emission in one source (HH 165) and of 44 GHz CH3OH maser emission in six sources (CB 3, IRAS 00338+6312, OMC3 MMS9, IRAS 053380624, V1318 CygS, and IRAS 23011+6126). We focus on two HAeBe stars, HH 165 and V1318 CygS, because no HAeBe star has previously been found to show 44 GHz CH3OH maser emission and only eight HAeBe stars have been reported to show 22 GHz H2O maser emission: LkH 198, HD 250550, V373 Cep (Schwartz & Buhl, 1975), IRAS 065710441 (Han et al., 1998), V1318 CygS (Palla et al., 1995), PV Cep (Torrelles et al., 1986), V1057 Cyg (Rodriguez et al., 1987), and V645 Cyg (Lada et al., 1981). Table A Multi-Epoch, Simultaneous Water and Methanol Maser Survey Toward Intermediate-Mass Young Stellar Objects lists the eight with the detected line parameters. We observed all of them but did not detect any appreciable (1 Jy) H2O and CH3OH maser emission from four of them: LkH 198, HD 250550, PV Cep, and V1057 Cyg.
4.2 Notes on Some Individual Sources
As mentioned in the previous section, some sources are located within a single beam or first sidelobe so that it is not straightforward to interpret the observational results. In order to determine genuine maser-emitting source(s) in such cases, we observed closely located objects successively and examined the detected maser lines of the individual sources. In the process, we assumed that the main beam of the telescope is Gaussian and used the FWHMs listed in Table 2, 130′′ at 22 GHz and 65′′ at 44 GHz.
4.2.1 IRAS 053380647 and HH147 MMS
IRAS 053380647 coincides with the ridge that contains HH 12 MMS 23 while HH147 MMS ( IRAS 053390646) corresponds to a YSO, which drives the HH147 bipolar outflow (Strom et al. 1985; Eislfell et al. 1994; Chini et al. 2001). These two objects are apart from each other. Figure 3 displays the single H2O maser lines detected toward these sources over three epochs. The two maser lines have practically the same velocity and line profile in each epoch. This strongly suggests that they are not distinct maser sources but rather are a single maser. However, it should be noted that the observed peak intensity ratio of HH147 MMS to IRAS 053380647 changes considerably over the observations, 25% in 2010 May, 12% in October, and 17% in December. If the maser is variable but stays at the same position, the peak intensities of the two objects can vary but the ratio should be constant. These large intensity ratio variations can be explained only by pointing offsets even though off-center pointing is considered. It is also very unlikely that the large ratio variations were caused by movement of a single maser, because the typical proper motion of a maser observed in other star-forming regions is only (e.g., Hirota et al. 2007). Therefore, it is more plausible that the maser emission in the latter epoch was emitted from new maser source formed after the disappearance of the maser source in the former epoch. Taking the intensity ratios into account, the masers seem to be located between the two objects, much closer to IRAS 053380647. This is consistent with the result of the grid mapping presented in Figure 4, which was made in the first epoch to investigate the existence of a nearby strong maser source (see Section 3).
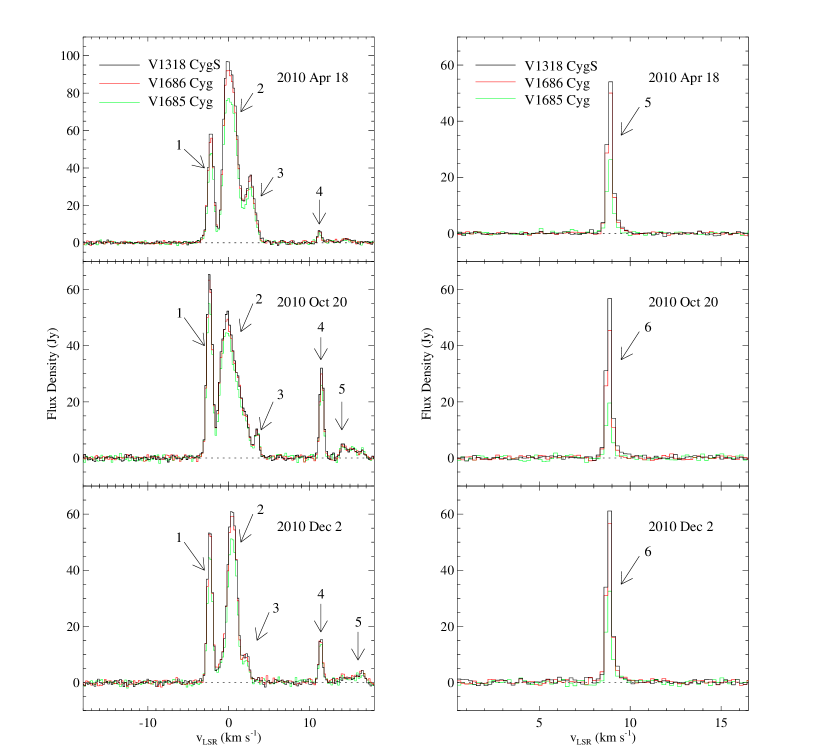
4.2.2 V1685 Cyg, V1686 Cyg, and V1318 CygS
BD+40∘ is an active star-forming region, which contains at least 33 optical and NIR sources in a field, including 3 HAeBe stars: V1685 Cyg ( BD+40∘4124), V1686 Cyg ( LkH 224), and V1318 CygS ( LkH 225S) (Hillenbrand et al., 1995). Using the Medicina 32 m telescope, Palla & Prusti (1993) first detected H2O maser emission towards BD+40∘ and claimed the maser emission stems from V1685 Cyg. However, Palla et al. (1995) observed this region in the H2O maser line at spatial resolution using the Very Large Array (VLA), and found that the maser is coincident with V1318 CygS rather than V1685 Cyg. Marvel (2005) also detected H2O maser emission toward V1318 CygS, in the range between 80 km s-1 and +20 km s-1, using the VLA and the Very Long Baseline Array.
We observed all three HAeBe stars on the same days and detected both H2O and CH3OH maser lines toward all of them (Figure 5). Assuming that the maser emission emanates from V1318 CygS, we estimated the expected line intensities at V1685 Cyg and V1686 Cyg, which are and from V1318 CygS on the sky, respectively. If the pointing accuracy is , at 22 GHz and at 44 GHz of the original signal would be detected toward V1685 Cyg. In the case of V1686 Cyg, the values are lower at 22 GHz and at 44 GHz. Table 7 displays the observed and expected intensities. The observed intensities of the individual H2O and CH3OH maser lines are in very good agreement with the expected intensities for all three observations. This strongly suggests that all the CH3OH maser lines detected toward these three HAeBe stars originate from V1318 CygS. Interferometric observations will be required to clarify this issue.
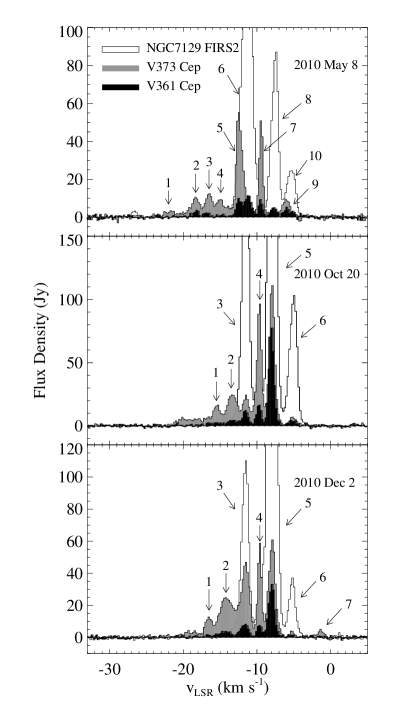
4.2.3 NGC 7129 FIRS2, V373 Cep, and V361 Cep
NGC 7129 is a reflection nebula illuminated by several stars including one Class 0 object, NGC 7129 FIRS2 (Eiora et al., 1998), and two HAeBe stars, V361 Cep and V373 Cep ( LkH 234). Cesarsky et al. (1978) detected H2O maser emission toward NGC 7129 FIRS2 and V373 Cep. However, we detected H2O maser emission toward V361 Cep as well as the other two sources. The separation angles of V361 Cep from NGC 7129 FIRS2 and V373 Cep are and , respectively. Since the KVN telescope has the first sidelobe with an attenuation of 14 dB at 1.5 times FWHM away from the main beam center, as noted earlier, of the H2O maser emission from NGC 7129 FIRS2 and of the H2O maser emission from V373 Cep would be detected toward V361 Cep. Table 8 presents both the observed maser line intensities of the three objects and the theoretically expected values. They match well with each other. Therefore, it seems that the H2O maser emission arises only from NGC 7129 FIRS2 and V373 Cep.
5 DISCUSSION
5.1 Detection Rates
As mentioned in Section 4.1, the overall detection rates of H2O and CH3OH masers in this study are and , respectively. If only Class 0 and Class I sources are included, the rates are 33 % for H2O and 27 % for CH3OH. For comparison, Wilking et al. (1994) made a multi-epoch H2O maser line survey of 42 nearby ( 450 pc) Class I sources with 120 , and detected maser emission in 36 % of them. Furuya et al. (2001) also observed H2O maser emission towards 30 Class 0 and 33 Class I objects with 100 . The detection rate was 21%. On the other hand, Sridharan et al. (2002) detected H2O masers in 42% of 84 high-mass protostellar candidates. Szymczak et al. (2005) also detected 52% in a sample of 79 Class II CH3OH maser sources at 6.7 GHz, which may trace an earlier stage of high-mass star formation than UCHII regions. Both surveys were made with the Effelsberg 100 m telescope. In the case of UCHII regions, whose ionizing stars have already reached the main sequence, the detection rate appears to be much higher. Churchwell et al. (1990) detected H2O maser emission in 67 % of 84 UCHII regions with a similar flux limit (mean rms 0.2 Jy at a velocity resolution of 0.2 km s-1) to those of Sridharan et al. (2002) and Szymczak et al. (2005), using the same telescope. This is contrary to the results of the low- and intermediate-mass regime where the detection rates rapidly decrease after the central stars reach the PMS stage. We detected H2O maser emission in only 3 % of 147 HAeBe stars (intermediate-mass PMS stars) and Furuya et al. (2001) detected none in a sample of 9 Class II sources (low-mass PMS stars).
A similar trend is seen in 44 GHz Class I CH3OH masers. Fontani et al. (2010) recently made a survey of this maser line toward 88 high-mass protostellar candidates and obtained a detection rate of 31% at a similar detection limit to this study. The sources in their sample are divided into two groups: and . The sources in the group may be at later evolutionary stages than those in the group. The group has a detection rate about three times higher than the low group: 48% versus 17%. Haschick et al. (1990) surveyed 50 star-forming regions, the vast majority of which are ultracompact and compact HII regions. They detected maser emission in 50% of them with one order of magnitude higher flux limit than this study. In the high-mass regime, therefore, the detection rate of 44 GHz Class I CH3OH maser emission also increases significantly as the central (proto)stars evolve (see Voronkov et al. 2010b for 9.9 GHz Class I CH3OH masers). This is in contrast with the HAeBe stars, for which we find a detection rate of 1 % for CH3OH masers.
Consequently, taking into account that UCHII regions are still deeply embedded in dense molecular cores, whereas low- and intermediate-mass PMS stars have already emerged as visible objects, the occurrence of both masers seems to be closely related to the circumstellar environments as well as the evolutionary stage of the central objects (see Section 4.1).
5.2 Relative velocities of masers with respect to the ambient gas
While the details are still poorly understood, both H2O and Class I CH3OH masers are thought to be collisionally pumped (Elitzur et al. 1989; Cragg et al. 1992). The presence of shocks is a necessary condition to enhance the abundances of H2O and CH3OH molecules, favoring the formation of collisionally pumped masers. One plausible mechanism for inducing interstellar shocks is jets and outflows from YSOs. In fact, H2O and Class I CH3OH masers were found to be associated with jets and/or outflows in many YSOs (Felli et al. 1992; Kurtz et al. 2004; Cyganowski et al. 2009), although class I CH3OH maser emission can be related to expanding HII regions (Voronkov et al., 2010b).
Figure 7 displays the relative velocities of both masers with respect to the natal dense molecular cores against the bolometric luminosities of the central (proto)stars, . Here the peak velocities () of Tables 3 and 4 are used. The molecular gas velocities are collected from the literature and are presented in Table A Multi-Epoch, Simultaneous Water and Methanol Maser Survey Toward Intermediate-Mass Young Stellar Objects with the references. In Figure 7(a), the velocity difference between H2O masers and the associated molecular gas has an average of 9.3 km s-1 and a median of 6.5 km s-1. While these values are much smaller than the typical shock velocity ( 100 km s-1) suggested by theoretical models (Elitzur et al., 1989), they are similar to the observed velocities of molecular outflows, which range from a few km s-1 to about 20 km s-1 (e.g., Kim & Kurtz 2006), as well as the velocity differences obtained by the previous H2O maser surveys, (Churchwell et al., 1990; Palla et al., 1991; Kurtz & Hofner, 2005; Urquhart et al., 2009). In addition, large relative velocities () are mostly confined to objects in the earliest, Class 0, evolutionary stage. This is probably because outflows are strongest during the Class 0 stage and are weakened as the central (proto)stars evolve (Bontemps et al. 1996; Arce & Sargent 2006). On the other hand, CH3OH masers usually show much smaller relative velocities than H2O masers. In Figure 7(b), their relative velocities are clustered around 0 km s-1 and do not deviate more than 10 km s-1 (see also Bachiller et al. 1990; Fontani et al. 2010). Furthermore, the sources with relative velocities are all Class 0 objects. This might also be accounted for with the strength of outflows, as for H2O masers. However, it is worth noting that there is at least one example of a Class I CH3OH maser that shows a significant velocity offset () from the associated molecular gas (Voronkov10b).
Previous high-resolution studies have shown that H2O masers are usually located closer to the central (proto)stars than Class I CH3OH masers (e.g., Kurtz et al. 2004). It is thus widely believed that H2O maser emission originates from the inner parts of outflows while Class I CH3OH maser emission comes from the interacting interface of outflows with the ambient gas. This view is supported by theoretical studies showing that H2O masers form in warm ( K), very dense () gas behind high-velocity shocks while Class I CH3OH masers can arise in much less dense () postshock gas at considerably lower ( K) temperatures (Elitzur et al. 1989; Cragg et al. 1992). Moreover, the CH3OH molecule can survive sputtering or desorption of grain mantles only at low () shock velocities (Garay et al., 2002). Our study cannot distinguish different spatial distributions of H2O and CH3OH masers owing to low angular resolution. Nevertheless, our spectroscopic results indicate that the emitting regions of the two masers are different. Our results support the previous suggestions that H2O maser emission originates from the base of an outflow whereas Class I CH3OH maser emission arises from the interaction region of the outflow with the ambient gas. Figure 7 also shows that no correlation exists between the relative velocities of either maser and the bolometric luminosities of the central objects.
5.3 Variability of masers
It is well known that the intensity and shape of H2O maser line emission can vary considerably on timescales of weeks to years (Tofani et al. 1995; Claussen et al. 1996; Furuya et al. 2003; Brand et al. 2003; Breen et al. 2010). Although our observations are confined to three epochs within a year, Figure 1 shows notable changes in H2O maser line intensity and velocity. In particular, the integrated line intensity of Serpens FIRS1 () decreased by a factor of 70 in seven months, and that of NGC 7129 FIRS2 () increased by a factor of 30 in five months. Moreover, the appearance of new maser lines (CB 3, Serpens FIRS1, IRAS 20050+2720 MMS1, and S106 FIR) and disappearance of others (IRAS 00338+6312, IRAS 053750731, IRAS 065710441, IRAS 20050+2720 MMS1, and IRAS 23037+6213) is further evidence of variability.
Despite the short lifetime of the H2O maser lines and the blending of several velocity components, we could find line-of-sight velocity drifts of H2O maser lines in half of the 16 maser-detected sources: CB 3, IRAS 00338+6312, HH 165, IRAS 20050+2720 MMS1, V1318 CygS, V645 Cyg, IRAS 21391+5802, and NGC 7129 FIRS2. The velocity gradients of these sources except one are km s-1 yr-1, which are similar to other published results, e.g., 1.5 km s-1 yr-1 (Hunter et al., 1994), 1.2 km s-1 yr-1 (Tofani et al., 1995), and 1.8 km s-1 yr-1 (Brand et al., 2003). The exception is IRAS 20050+2720 MMS1, which shows an extremely large velocity gradient of . Because of the coarse sampling and the low spatial resolution of our observations, however, we cannot exclude the possibility that the velocity variation was caused by different maser features, i.e., the disappearance of one maser feature and the appearance of another at a similar position.
On the other hand, the variability of the 44 GHz CH3OH maser has not been well established. By comparing their observational results with the published data, Kurtz et al. (2004) could not find CH3OH maser variability except for two objects in their sample. Kalenskii et al. (2010) presented observational results of three low-mass YSOs at three epochs with two-year intervals. Their spectra do not reveal any significant variability. Our results exhibit only small variation in the CH3OH maser line intensity, shape, and velocity over a one-year interval (Figure 2). The integrated intensities are changed by except for IRAS 05338-0624 and IRAS 23011+6126, which have poor signal-to-noise ratios.
Tofani et al. (1995) found from the H2O maser line observations of 22 YSOs with the VLA and Medicina 32 m radio telescopes that variability of the maser emission tends to be more pronounced for maser spots closer to the central star and for those with larger relative velocity with respect to the molecular gas. Thus, these different variability behaviors of H2O and 44 GHz CH3OH masers may also be connected with different emitting environments (see Section 5.2).
5.4 The relationship of maser luminosity with bolometric luminosity
The isotropic maser luminosity can be calculated from the observed line integral using the following equations:
| (1) | |||||
and
| (2) |
Here is the distance to the source, is the antenna efficiency at the observed frequency , and is the geometric area of the antenna aperture plane. Table A Multi-Epoch, Simultaneous Water and Methanol Maser Survey Toward Intermediate-Mass Young Stellar Objects presents the derived isotropic maser luminosities using the distances of the central objects presented in Table A Multi-Epoch, Simultaneous Water and Methanol Maser Survey Toward Intermediate-Mass Young Stellar Objects. For sources with multiple maser lines, the maser luminosity is calculated as the sum of all the individual lines.
Figure 8(a) plots against . There is a good correlation between the two. A linear least-squares fit to our observed data points results in with a correlation coefficient () of 0.72. Figure 8(b) exhibits a plot of versus . The fitted relation is with =0.71. The slope of 1.22 is steeper than that for the H2O masers. It is expected from the two relations that there may be a correlation between and . Figure 8(c) shows the relation. A linear fit to the data points yields (=0.45).
For comparison, we plot 20 H2O maser data points of low-mass () YSOs and 38 H2O and 30 CH3OH maser data points of UCHII regions together with our data in Figure 9 (Furuya et al. 2003; Kim et al. 2011, in preparation). The data of UCHII regions were obtained with the same telescope as in this survey. One can clearly see that the luminosities of both masers are well correlated with the bolometric luminosity. The fitted relations are (=0.88) and (=0.80), which are shown by the solid lines in Figures 9(a) and (b). Figure 9(c) shows versus with the fitted relation, (=0.73).
Several previous studies of H2O masers in Galactic star-forming regions have produced similar relations of with (Wouterloot & Walmsley 1986; Felli et al. 1992; Brand et al. 2003; Furuya et al. 2003). Our slope agrees well with the previous values, 0.81.0. For a given evolutionary stage, therefore, YSOs with higher bolometric luminosities are expected to have higher H2O maser luminosities. However, we are unaware of any study examining the - and - relations.
6 SUMMARY
We have carried out a multi-epoch, simultaneous 22 GHz H2O and 44 GHz Class I CH3OH maser line survey toward 180 IMYSOs. The main results are summarized as follows.
1. We detected H2O masers toward 16 objects and CH3OH masers toward 10 objects. One new H2O maser source (HH 165) and six new CH3OH maser sources (CB 3, IRAS 00338+6312, OMC3 MMS9, IRAS 053380624, V1318 CygS, and IRAS 23011+6126) were found in our survey.
2. The overall detection rates of H2O masers and CH3OH masers are and , respectively. The rates rapidly decrease as the central (proto)stars evolve. The detection rates of H2O masers are , and, for Class 0, Class I, and HAeBe objects, respectively. Those of CH3OH masers for Class 0, Class I, and HAeBe objects are , , and . In contrast, the detection rates of both masers in high-mass star-forming regions significantly increase as the central objects evolve from the protostellar to the main-sequence stage. These results indicate that the occurrence of the two masers are closely related both to the evolutionary stage of the central (proto)stars and to the circumstellar environments.
3. The relative velocities of H2O masers with respect to the ambient molecular gas are 9.3 km s-1 on average, with a median difference of 6.5 km s-1, whereas those of CH3OH masers are concentrated around 0 km s-1. No CH3OH maser velocity deviates more than 10 km s-1 from the systemic velocity. Large relative velocities are mainly shown in the Class 0 objects: and . This is consistent with previous suggestions that H2O masers originate from the inner parts of outflows while Class I CH3OH masers arise from the interacting interface of outflows with the ambient dense gas.
4. The intensities and shapes of the observed H2O maser lines were quite variable. Half of the maser-detected sources show velocity drifts. The integrated line intensities varied by up to two orders of magnitude. In contrast, the observed CH3OH lines do not reveal any significant variability in intensity, shape, or velocity. The line integrals were maintained within over the observations. These different variability behaviors of the two masers may be connected with different emitting environments.
5. The isotropic luminosities of both masers are well correlated with the bolometric luminosities of the central objects. The linear fits result in and when only IMYSO data in this survey were considered, while those yield and , after the data points of low- and high-mass regimes are added.
References
- Alonso-Albi et al. (2009) Alonso-Albi, T., Fuente, A., Bachiller, R., et al. 2009, A&A, 497, 117
- Alonso-Albi et al. (2010) Alonso-Albi, T., Fuente, A., Crimier, N., et al. 2010, A&A, 518, A52
- Arce & Sargent (2006) Arce, H. G., & Sargent, A. I. 2006, ApJ, 646, 1070
- Bachiller et al. (1995) Bachiller, R., Fuente, A., & Tafalla, M. 1995, ApJ, 445, L51
- Bachiller et al. (1990) Bachiller, R., Menten, K. M., Gómez-González, J., & Barcia, A. 1990, A&A, 240, 116
- Beltrán et al. (2001) Beltrán, M. T., Estalella, R., Anglada, G., Rodríguez, L. F., & Torrelles, J. M. 2001, AJ, 121, 1556
- Bontemps et al. (1996) Bontemps, S., André, P., Terebey, S., & Cabrit, S. 1996, A&A, 311, 858
- Brand et al. (2003) Brand, J., Cesaroni, R., Comoretto, G., et al. 2003, A&A, 407, 573
- Breen et al. (2010) Breen, S. L., Caswell, J. L., Ellingsen, S. P., & Phillips, C. J. 2010, MNRAS, 406, 1487
- Bronfman et al. (1996) Bronfman, L., Nyman, L.-A., & May, J. 1996, A&AS, 115, 81
- Caswell & Breen (2010) Caswell, J. L., & Breen, S. L. 2010, MNRAS, 407, 2599
- Cesarsky et al. (1978) Cesarsky, C. J., Cesarsky, D. A., Churchwell, E., & Lequeux, J. 1978, A&A, 68, 33
- Chen et al. (2009) Chen, X., Launhardt, R., & Henning, T. 2009, ApJ, 691, 1729
- Chini et al. (2001) Chini, R., Ward-Thompson, D., Kirk, J. M., et al. 2001, A&A, 369, 155
- Churchwell et al. (1990) Churchwell, E., Walmsley, C. M., & Cesaroni, R. 1990, A&AS, 83, 119
- Claussen et al. (1998) Claussen, M. J., Marvel, K. B., Wootten, A., & Wilking, B. A. 1998, ApJ, 507, L79
- Claussen et al. (1996) Claussen, M. J., Wilking, B. A., Benson, P. J., et al. 1996, ApJS, 106, 111
- Connelley et al. (2007) Connelley, M. S., Reipurth, B., & Tokunaga, A. T. 2007, AJ, 133, 1528
- Connelley et al. (2008) Connelley, M. S., Reipurth, B., & Tokunaga, A. T. 2008, AJ, 135, 2496
- Cragg et al. (1992) Cragg, D. M., Johns, K. P., Godfrey, P. D., & Brown, R. D. 1992, MNRAS, 259, 203
- Cyganowski et al. (2009) Cyganowski, C. J., Brogan, C. L., Hunter, T. R., & Churchwell, E. 2009, ApJ, 702, 1615
- de Gregorio-Monsalvo et al. (2006) de Gregorio-Monsalvo, I., Gómez, J. F., Suárez, O.et al. 2006, ApJ, 642, 319
- Dent & Aspin (1992) Dent, W. R. F., & Aspin, C. 1992, MNRAS, 259, 401
- Dent et al. (1998) Dent, W. R. F., Matthews, H. E., & Ward-Thompson, D. 1998, MNRAS, 301, 1049
- De Vries et al. (2002) De Vries, C. H., Narayanan, G., & Snell, R. L. 2002, ApJ, 577, 798
- Eiora et al. (1998) Eiora, C., Palacios, J., & Casali, M. M. 1998, A&A, 335, 243
- Eislfell et al. (1994) Eislfell, J., Mundt, R., & Bhm, K.-H. 1994, AJ, 108, 1042
- Elitzur et al. (1989) Elitzur, M., Hollenbach, D. J., & McKee, C. F. 1989, ApJ, 346, 983
- Felli et al. (1992) Felli, M., Palagi, F., & Tofani, G. 1992, A&A, 255, 293
- Fontani et al. (2010) Fontani, F., Cesaroni, R., & Furuya, R. S. 2010, A&A, 517, A56
- Froebrich (2005) Froebrich, D. 2005, ApJS, 156, 169
- Furuya et al. (2001) Furuya, R. S., Kitamura, Y., Wootten, H. A., Claussen, M. J., & Kawabe, R. 2001, ApJ, 559, L143
- Furuya et al. (2003) Furuya, R. S., Kitamura, Y., Wootten, H. A., Claussen, M. J., & Kawabe, R. 2003, ApJS, 144, 71
- Furuya et al. (2005) Furuya, R. S., Kitamura, Y., Wootten, H. A., Claussen, M. J., & Kawabe, R. 2005, A&A, 438, 571
- Garay et al. (2002) Garay, G., Mardones, D., Rodríguez, L. F., Caselli, P., & Bourke, T. L. 2002, ApJ, 567, 980
- Genzel & Downes (1977) Genzel, R., & Downes, D. 1977, A&AS, 30, 145
- Gregorio-Hetem et al. (1992) Gregorio-Hetem, J., Lépine, J. R. D., Quast, G. R., Torres, C. A. O., & de la Reza, R. 1992, AJ, 103, 549
- Han et al. (1998) Han, F., Mao, R. Q., Lu, J., et al. 1998, A&AS, 127, 181
- Han et al. (2008) Han, S.-T., Lee, J.-W., Kang, J., et al. 2008, Int. J. Infrared Millim. Waves, 29, 69
- Haschick et al. (1990) Haschick, A. D., Menten, K. M., & Baan, W. A. 1990, ApJ, 354, 556
- Hernández et al. (2004) Hernández, J., Calvet, N., Briceño, C., Hartmann, L., & Berlind, P. 2004, AJ, 127, 1682
- Hillenbrand et al. (1995) Hillenbrand, L. A., Meyer, M. R., Strom, S. E., & Skrutskie, M. F. 1995, AJ, 109, 280
- Hirota et al. (2007) Hirota, T., Bushimate, T., Choi, Y. K., et al. 2007, PASJ, 59, 897
- Hunter et al. (1994) Hunter, T. R., Taylor, G. B., Felli, M., & Tofani, G. 1994, A&A, 284, 215
- Kalenskii et al. (2010) Kalenskii, S. V., Johansson, L. E. B., Bergman, P., et al. 2010, MNRAS, 405, 613
- Kim et al. (2011) Kim, K.-T., Byun, D.-Y., Je, D.-H., et al. 2011, J. Korean Astron. Soc., 44, 81
- Kim & Kurtz (2006) Kim, K.-T., & Kurtz, S. E. 2006, ApJ, 643, 978
- Kurtz & Hofner (2005) Kurtz, S., & Hofner, P. 2005, AJ, 130, 711
- Kurtz et al. (2004) Kurtz, S., Hofner, P., & Álvarez, C. V. 2004, ApJS, 155, 149
- Lada et al. (1981) Lada, C. J., Blitz, L., Reid, M. J., & Moran, J. M. 1981, ApJ, 243, 769
- Malfait et al. (1998) Malfait, K., Bogaert, E., & Waelkens, C. 1998, A&A, 331, 211
- Mannings & Sargent (2000) Mannings, V., & Sargent, A. I. 2000, ApJ, 529, 391
- Manoj et al. (2006) Manoj, P., Bhatt, H. C., Maheswar, G., & Muneer, S. 2006, ApJ, 653, 657
- Martí et al. (1999) Martí, J., Rodríguez, L. F., & Torrelles, J. M. 1999, A&A, 345, L5
- Marvel (2005) Marvel, K. B. 2005, AJ, 130, 2732
- Menten (1991) Menten, K. M. 1991, in ASP Conf. Ser. 16, Atoms, Ions and Molecules: New Results in Spectral Line Astrophysics, ed. A. D. Haschick & P. T. P. Ho (San Francisco, CA: ASP), 119
- Montesinos et al. (2009) Montesinos, B., Eiroa, C., Mora, A., & Merín, B. 2009, A&A, 495, 901
- Mora et al. (2001) Mora, A., Merín, B., Solano, E., et al. 2001, A&A, 378, 116
- Palla et al. (1991) Palla, F., Brand, J., Cesaroni, R., Comoretto, G., & Felli, M. 1991, A&A, 246, 249
- Palla & Prusti (1993) Palla, F., & Prusti, T. 1993, A&A, 272, 249
- Palla et al. (1995) Palla, F., Testi, L., Hunter, T. R., et al. 1995, A&A, 293, 521
- Rodriguez et al. (1987) Rodriguez, L. F., Haschick, A. D., Torrelles, J. M., & Myers, P. C. 1987, A&A, 186, 319
- Rodriguez et al. (1980) Rodriguez, L. F., Moran, J. M., Ho, P. T. P., & Gottlieb, E. W. 1980, ApJ, 235, 845
- Sandell et al. (1999) Sandell, G., Avery, L. W., Baas, F., et al. 1999, ApJ, 519, 236
- Saraceno et al. (1996) Saraceno, P., André, P., Ceccarelli, C., Griffin, M., & Molinari, S. 1996, A&A, 309, 827
- Sartori et al. (2010) Sartori, M. J., Gregorio-Hetem, J., Rodrigues, C. V., Hetem, A. Jr., & Batalha, C. 2010, AJ, 139, 27
- Scappini & Codella (1996) Scappini, F., & Codella, C. 1996, MNRAS, 282, 587
- Schwartz & Buhl (1975) Schwartz, P. R., & Buhl, D. 1975, ApJ, 201, L27
- Seth et al. (2002) Seth, A. C., Greenhill, L. J., & Holder, B. P. 2002, ApJ, 581, 325
- Sridharan et al. (2002) Sridharan, T. K., Beuther, H., Schilke, P., Menten, K. M., & Wyrowski, F. 2002, ApJ, 566, 931
- Strom et al. (1985) Strom, S. E., Strom, K. M., Grasdalen, G. L., et al. 1985, AJ, 90, 2281
- Szymczak et al. (2005) Szymczak, M., Pillai, T., & Menten, K. M. 2005, A&A, 434, 613
- Tatematsu et al. (2008) Tatematsu, K., Kandori, R., Umemoto, T., & Sekimoto, Y. 2008, PASJ, 60, 407
- Thé et al. (1994) Thé, P. S., de Winter, D., & Pérez, M. R. 1994, A&AS, 104, 315
- Tofani et al. (1995) Tofani, G., Felli, M., Taylor, G. B., & Hunter, T. R. 1995, A&AS, 112, 299
- Torrelles et al. (1986) Torrelles, J. M., Ho, P. T. P., Moran, J. M., Rodríguez, L. F., & Cantó, J. 1986, ApJ, 307, 787
- Torres et al. (1995) Torres, C. A. O., Quast, G., de la Reza, R., Gregorio-Hetem, J., & Lépine, J. R. D. 1995, AJ, 109, 2146
- Ungerechts & Güsten (1984) Ungerechts, H., & Güsten, R. 1984, A&A, 131, 177
- Urquhart et al. (2009) Urquhart, J. S., Hoare, M. G., Lumsden, S. L., et al. 2009, A&A, 507, 795
- Val’tts et al. (2010) Val’tts, I. E., Larionov, G. M., & Bayandina, O. S. 2010, arXiv:1005.3715
- Vieira et al. (2011) Vieira, R. G., Gregorio-Hetem, J., Hetem, A. Jr., Stasińska, G., & Szczerba, R. 2011, A&A, 526, A24
- Vieira et al. (2003) Vieira, S. L. A., Corradi, W. J. B., Alencar, S. H. P., et al. 2003, AJ, 126, 2791
- Viti et al. (2006) Viti, S., Girart, J. M., & Hatchell, J. 2006, A&A, 449, 1089
- Voronkov et al. (2010a) Voronkov, M. A., Caswell, J. L., Britton, T. R., et al. 2010a, MNRAS, 408, 133
- Voronkov et al. (2010b) Voronkov, M. A., Caswell, J. L., Ellingsen, S. P., & Sobolev, A. M. 2010b, MNRAS, 405, 2471
- Waters & Waelkens (1998) Waters, L. B. F. M., & Waelkens, C. 1998, ARA&A, 36, 233
- Weaver et al. (1965) Weaver, H., Williams, D. R. W., Dieter, N. H., & Lum, W. T. 1965, Nature, 208, 29
- Wilking et al. (1994) Wilking, B. A., Claussen, M. J., Benson, P. J., et al. 1994, ApJ, 431, L119
- Williams & Myers (1999) Williams, J. P., & Myers, P. C. 1999, ApJ, 511, 208
- Wolf-Chase et al. (2003) Wolf-Chase, G., Moriarty-Schieven, G., Fich, M., & Barsony, M. 2003, MNRAS, 344, 809
- Wouterloot & Walmsley (1986) Wouterloot, J. G. A., & Walmsley, C. M. 1986, A&A, 168, 237
- Wu et al. (1996) Wu, Y., Huang, M., & He, J. 1996, A&AS, 115, 283
- Wu et al. (2004) Wu, Y., Wei, Y., Zhao, M., et al. 2004, A&A, 426, 503
- Yang et al. (2002) Yang, J., Jiang, Z., Wang, M., Ju, B., & Wang, H. 2002, ApJS, 141, 157


| R.A. | Decl. | Distance | Observing | Detection | |||||||||
|---|---|---|---|---|---|---|---|---|---|---|---|---|---|
| Source | (J2000) | (J2000) | Source TypeaaSources with a question mark were classified as HAeBe candidates initially, but later analysis suggests they are not in the HAeBe stage. | Ref. | (pc) | Ref. | () | Ref. | Date | H2O | CH3OH | (Jy) | (Jy) |
| (1) | (2) | (3) | (4) | (5) | (6) | (7) | (8) | (9) | (10) | (11) | (12) | (13) | (14) |
| MacC H12 | 00 07 02.6 | +65 38 38 | HAeBe(?) | 1, 2 | 845 | 3 | 47.1 | 3 | 2010 Feb 24 | N | N | 0.46 | 0.52 |
| HBC 324 | 00 07 30.7 | +65 39 52 | HAeBe | 1, 2 | 850 | 4 | 60 | 4 | 2010 Mar 18 | N | N | 0.36 | 0.47 |
| LkH 198 | 00 11 26.0 | +58 49 29 | HAeBe | 1, 2 | 600 | 4 | 115 | 4 | 2010 Feb 24 | N | N | 0.46 | 0.55 |
| V376 Cas | 00 11 26.1 | +58 50 04 | HAeBe(?) | 1, 2 | 630 | 5 | 437 | 5 | 2010 Feb 24 | N | N | 0.49 | 0.51 |
| CB 3 | 00 28 42.7 | +56 42 07 | Class 0 | 6 | 2500 | 6 | 1000 | 6 | 2010 May 8 | Y | YbbNewly detected objects in our survey. | 0.45 | 0.53 |
| VX Cas | 00 31 30.7 | +61 58 51 | HAeBe | 1, 2 | 619 | 7 | 31 | 7 | 2010 Feb 24 | N | N | 0.43 | 0.46 |
| IRAS 00338+6312 | 00 36 47.5 | +63 29 02 | Class I | 8 | 850 | 8 | 1100 | 8 | 2010 Jan 18 | Y | YbbNewly detected objects in our survey. | 0.32 | 0.41 |
| V594 Cas | 00 43 18.3 | +61 54 40 | HAeBe(?) | 1, 2 | 650 | 5 | 1950 | 5 | 2010 Mar 18 | N | N | 0.36 | 0.48 |
| RNO 6 | 02 16 30.1 | +55 22 57 | HAeBe | 1, 2 | 1600 | 4 | 562 | 4 | 2010 Mar 18 | N | N | 0.36 | 0.51 |
| NGC1333 IRAS2ccH2O maser emission lines toward the position of NGC1333 IRAS2 were detected, but turned out to be the side lobe effect by HH7-11C. | 03 28 56.3 | +31 14 34 | Class 0 | 8, 9 | 220 | 8 | 43 | 9 | 2010 May 8 | N | N | 0.49 | 0.51 |
| NGC1333 SVS 13A | 03 29 03.8 | +31 16 04 | Class 0 | 8, 10 | 220 | 8 | 47 | 10 | 2010 May 9 | N | N | 0.54 | 0.59 |
| IRAS 03359+2932 | 03 39 00.6 | +29 41 46 | HAeBe | 11, 12 | 2010 Feb 24 | N | N | 0.45 | 0.46 | ||||
| IP Per | 03 40 47.0 | +32 31 54 | HAeBe | 1, 2 | 350 | 5 | 14 | 5 | 2010 Feb 24 | N | N | 0.45 | 0.47 |
| XY Per e+w | 03 49 36.3 | +38 58 55 | HAeBe | 1, 2 | 347 | 7 | 86 | 7 | 2010 Mar 18 | N | N | 0.48 | 0.51 |
| V892 Tau | 04 18 40.6 | +28 19 16 | HAeBe | 1, 2 | 160 | 5 | 2239 | 5 | 2010 Mar 17 | N | N | 0.36 | 0.56 |
| IRAS 04278+2253 | 04 30 50.3 | +23 00 09 | HAeBe | 11 | 2010 Feb 24 | N | N | 0.47 | 0.47 | ||||
| BD+24∘676 | 04 40 32.6 | +24 26 31 | HAeBe | 13 | 2010 Apr 19 | N | N | 0.71 | 0.78 | ||||
| AB Aur | 04 55 45.8 | +30 33 04 | HAeBe | 1, 2, 11 | 144 | 5 | 69 | 5 | 2010 Mar 19 | N | N | 0.38 | 0.40 |
| MWC 480 | 04 58 46.3 | +29 50 37 | HAeBe | 1, 11, 12 | 146 | 7 | 22 | 7 | 2010 Feb 24 | N | N | 0.45 | 0.47 |
| UX Ori | 05 04 30.0 | 03 47 14 | HAeBe | 1, 2 | 517 | 7 | 37 | 7 | 2010 Mar 18 | N | N | 0.43 | 0.63 |
| IRAS 050440325 | 05 06 55.5 | 03 21 13 | HAeBe(?) | 11, 12, 14 | 670 | 15 | 2010 Mar 18 | N | N | 0.39 | 0.59 | ||
| V1012 Ori | 05 11 36.5 | 02 22 48 | HAeBe | 1 | 2010 Mar 18 | N | N | 0.34 | 0.51 | ||||
| V1366 Ori | 05 16 00.5 | 09 48 35 | HAeBe | 1, 11, 12 | 164 | 5 | 5 | 5 | 2010 Mar 21 | N | N | 0.42 | 0.56 |
| IRAS 05209+2454 | 05 24 01.2 | +24 57 38 | HAeBe | 11 | 150 | 5 | 23 | 5 | 2010 Feb 24 | N | N | 0.49 | 0.51 |
| IRAS 05215+0225 | 05 24 08.0 | +02 27 47 | HAeBe | 11, 12 | 2010 Mar 17 | N | N | 0.48 | 0.56 | ||||
| V346 Ori | 05 24 42.8 | +01 43 48 | HAeBe | 1, 11, 12 | 586 | 7 | 61 | 7 | 2010 Mar 21 | N | N | 0.39 | 0.53 |
| IRAS 05245+0022 | 05 27 05.5 | +00 25 08 | HAeBe | 11, 12 | 2010 Mar 17 | N | N | 0.47 | 0.58 | ||||
| HD 35929 | 05 27 42.8 | 08 19 38 | HAeBe | 1, 16 | 345 | 5 | 79 | 5 | 2010 Mar 18 | N | N | 0.37 | 0.55 |
| IRAS F052720025 | 05 29 48.0 | 00 23 43 | HAeBe | 11 | 2010 Mar 18 | N | N | 0.36 | 0.52 | ||||
| IRAS 05275+1118 | 05 30 19.0 | +11 20 20 | HAeBe | 11, 12 | 2010 Mar 18 | N | N | 0.34 | 0.51 | ||||
| MWC 758 | 05 30 27.5 | +25 19 57 | HAeBe | 1, 11, 12 | 205 | 5 | 28 | 5 | 2010 Feb 24 | N | N | 0.64 | 0.56 |
| HK Ori | 05 31 28.1 | +12 09 10 | HAeBe(?) | 1, 2 | 460 | 5 | 78 | 5 | 2010 Mar 17 | N | N | 0.39 | 0.61 |
| V1410 Ori | 05 31 57.2 | +11 17 41 | HAeBe | 1, 16 | 336 | 5 | 98 | 5 | 2010 Mar 19 | N | N | 0.37 | 0.56 |
| IRAS 052950458 | 05 32 00.3 | 04 55 54 | HAeBe | 11 | 2010 Mar 24 | N | N | 0.32 | 0.35 | ||||
| IRAS 05293+1701 | 05 32 14.1 | +17 03 29 | HAeBe(?) | 11, 12 | 2010 Feb 24 | N | N | 0.64 | 0.59 | ||||
| IRAS 053020537 | 05 32 41.7 | 05 35 48 | Class I | 8 | 450 | 8 | 40 | 8 | 2010 Jan 14 | N | N | 0.72 | 0.56 |
| HD 245185 | 05 35 09.6 | +10 01 52 | HAeBe | 1, 2 | 400 | 5 | 22 | 5 | 2010 Mar 19 | N | N | 0.67 | 0.71 |
| OMC3 MMS6ddH2O maser emission lines toward the position of OMC3 MMS6, OMC3 MMS9, OMC3 MMS7, OMC2 FIR4, and T Ori were detected, but turned out to be the side lobe effect by Orion KL. | 05 35 23.5 | 05 01 32 | Class 0 | 8, 11 | 450 | 8 | 9 | 2010 May 8 | N | N | 0.62 | 0.46 | |
| OMC3 MMS9ddH2O maser emission lines toward the position of OMC3 MMS6, OMC3 MMS9, OMC3 MMS7, OMC2 FIR4, and T Ori were detected, but turned out to be the side lobe effect by Orion KL. | 05 35 26.0 | 05 05 42 | Class I | 8, 11 | 450 | 8 | 130 | 9 | 2010 May 8 | N | YbbNewly detected objects in our survey. | 0.66 | 0.69 |
| OMC3 MMS7ddH2O maser emission lines toward the position of OMC3 MMS6, OMC3 MMS9, OMC3 MMS7, OMC2 FIR4, and T Ori were detected, but turned out to be the side lobe effect by Orion KL. | 05 35 26.6 | 05 03 56 | Class I | 9 | 450 | 8 | 53 | 9 | 2010 May 8 | N | N | 0.72 | 0.63 |
| OMC2 FIR4ddH2O maser emission lines toward the position of OMC3 MMS6, OMC3 MMS9, OMC3 MMS7, OMC2 FIR4, and T Ori were detected, but turned out to be the side lobe effect by Orion KL. | 05 35 27.0 | 05 10 06 | Class 0 | 6 | 450 | 8 | 1000 | 6 | 2010 May 6 | N | Y | 0.66 | 0.69 |
| T OriddH2O maser emission lines toward the position of OMC3 MMS6, OMC3 MMS9, OMC3 MMS7, OMC2 FIR4, and T Ori were detected, but turned out to be the side lobe effect by Orion KL. | 05 35 50.4 | 05 28 35 | HAeBe | 1, 2 | 472 | 7 | 50 | 7 | 2010 Mar 17 | N | N | 0.49 | 0.59 |
| IRAS 053350645 | 05 35 57.0 | 06 43 41 | Class I | 17 | 480 | 15 | 52 | 17 | 2010 May 7 | N | N | 0.55 | 0.63 |
| CQ Tau | 05 35 58.5 | +24 44 54 | HAeBe | 1, 2 | 100 | 5 | 3.5 | 5 | 2010 Mar 17 | N | N | 0.42 | 0.68 |
| IRAS 053380624 | 05 36 17.6 | 06 22 10 | Class I | 8, 18 | 480 | 8 | 144 | 8 | 2010 Jan 13 | Y | YbbNewly detected objects in our survey. | 0.36 | 0.51 |
| IRAS 053380647 | 05 36 18.2 | 06 45 47 | Class I | 8, 19 | 440 | 8 | 70 | 8 | 2010 May 8 | Y | N | 0.67 | 0.67 |
| HH147 MMS | 05 36 25.1 | 06 44 42 | Class I | 9, 17 | 460 | 20 | 45 | 17 | 2010 May 8 | N | N | 0.58 | 0.61 |
| V380 Ori | 05 36 25.4 | 06 42 58 | HAeBe(?) | 1, 2 | 510 | 5 | 933 | 5 | 2010 Mar 21 | N | N | 0.36 | 0.45 |
| IRAS 053390626 | 05 36 25.5 | 06 25 02 | Class I | 17 | 500 | 21 | 59 | 17 | 2010 May 8 | N | N | 0.56 | 0.62 |
| IRAS 053420639 | 05 36 40.6 | 06 38 03 | Class I | 17 | 48 | 17 | 2010 May 8 | N | N | 0.56 | 0.59 | ||
| V586 Ori | 05 36 59.3 | 06 09 16 | HAeBe | 1, 16 | 510 | 5 | 87 | 5 | 2010 Mar 24 | N | N | 0.48 | 0.53 |
| IRAS 053450139 | 05 37 02.4 | 01 37 21 | HAeBe | 11 | 2010 Mar 23 | N | N | 0.44 | 0.59 | ||||
| BF Ori | 05 37 13.3 | 06 35 01 | HAeBe(?) | 1, 2 | 603 | 7 | 62 | 7 | 2010 Mar 24 | N | N | 0.54 | 0.61 |
| KMS 27 | 05 37 47.1 | +06 42 30 | HAeBe | 1, 11, 12 | 2010 Mar 24 | N | N | 0.54 | 0.63 | ||||
| IRAS 053550117 | 05 38 05.2 | 01 15 22 | HAeBe | 11, 12 | 2010 Mar 24 | N | N | 0.62 | 0.68 | ||||
| V1787 Ori | 05 38 09.2 | 06 49 16 | HAeBe | 1, 11 | 2010 Mar 24 | N | N | 0.43 | 0.59 | ||||
| V1788 Ori | 05 38 14.5 | 05 25 13 | HAeBe | 1, 11, 12 | 2010 Mar 23 | N | N | 0.44 | 0.56 | ||||
| Haro 13a | 05 38 18.2 | 07 02 26 | HAeBe | 1 | 2010 Mar 24 | N | N | 0.48 | 0.52 | ||||
| V599 Ori | 05 38 58.6 | 07 16 46 | HAeBe | 1, 11 | 360 | 15 | 2010 Mar 16 | N | N | 0.38 | 0.58 | ||
| Ori | 05 39 11.1 | +04 07 17 | HAeBe | 1 | 2010 Mar 16 | N | N | 0.37 | 0.58 | ||||
| RR Tau | 05 39 30.5 | +26 22 27 | HAeBe | 1, 2 | 2103 | 7 | 781 | 7 | 2010 Mar 16 | N | N | 0.34 | 0.53 |
| IRAS 053750731 | 05 39 56.1 | 07 30 26 | Class 0 | 6 | 500 | 6 | 67 | 6 | 2010 Jan 18 | Y | N | 0.39 | 0.53 |
| V350 Ori | 05 40 11.8 | 09 42 11 | HAeBe | 1, 2 | 735 | 7 | 29 | 7 | 2010 Mar 16 | N | N | 0.39 | 0.58 |
| Reipurth50 NIRS1 | 05 40 27.7 | 07 27 28 | Class I | 17 | 212 | 17 | 2010 May 9 | N | N | 0.59 | 0.58 | ||
| MWC 120 | 05 41 02.3 | 02 43 01 | HAeBe | 1, 16 | 470 | 5 | 138 | 5 | 2010 Mar 24 | N | N | 0.48 | 0.53 |
| NGC 2023 MM 1 | 05 41 24.9 | 02 18 09 | Class 0 | 22 | 730 | 15 | 200 | 17 | 2010 May 9 | N | N | 0.64 | 0.61 |
| IRAS 054070501 | 05 43 11.9 | 04 59 50 | HAeBe | 11, 12 | 460 | 5 | 123 | 5 | 2010 Mar 21 | N | N | 0.39 | 0.56 |
| IRAS 05417+0007 | 05 44 18.8 | +00 08 40 | HAeBe | 11, 12 | 2010 Mar 23 | N | N | 0.47 | 0.62 | ||||
| IRAS 05451+0037 | 05 47 42.3 | +00 38 40 | Class I | 8 | 450 | 8 | 40 | 8 | 2010 Jan 18 | N | N | 0.42 | 0.58 |
| IRAS 05471+2351 | 05 50 13.5 | +23 52 17 | HAeBe(?) | 11, 12, 14 | 2010 Mar 19 | N | N | 0.52 | 0.47 | ||||
| IRAS 055131024 | 05 53 42.6 | 10 24 01 | HAeBe | 11, 11 | 470 | 23 | 5.1 | 23 | 2010 Mar 16 | N | N | 0.38 | 0.59 |
| IRAS 055551405 | 05 57 49.5 | +14 05 34 | HAeBe | 11 | 470 | 23 | 4.8 | 23 | 2010 Mar 21 | N | N | 0.44 | 0.56 |
| IRAS 05560+1639 | 05 58 55.6 | +16 39 58 | HAeBe | 11, 12 | 2010 Mar 21 | N | N | 0.44 | 0.55 | ||||
| HD 250550 | 06 02 00.0 | +16 30 57 | HAeBe | 1, 2 | 700 | 5 | 275 | 5 | 2010 Mar 16 | N | N | 0.37 | 0.49 |
| IRAS 055981000 | 06 02 14.9 | 10 01 00 | HAeBe | 11, 12 | 2010 Mar 18 | N | N | 0.37 | 0.56 | ||||
| IRAS 060131452 | 06 03 37.1 | 14 53 03 | HAeBe | 11, 12 | 2010 Mar 16 | N | N | 0.43 | 0.56 | ||||
| IRAS 060450554 | 06 06 58.5 | 05 55 08 | HAeBe | 11, 12 | 2010 Mar 24 | N | N | 0.54 | 0.58 | ||||
| IRAS 06040+2958 | 06 07 16.1 | +29 58 01 | HAeBe | 11 | 2010 Mar 19 | N | N | 0.54 | 0.49 | ||||
| LkH 208 | 06 07 49.5 | +18 38 26 | HAeBe | 1, 2 | 1000 | 5 | 85 | 5 | 2010 Mar 19 | N | N | 0.54 | 0.51 |
| IRAS 06071+2925 | 06 10 17.5 | +29 25 16 | HAeBe | 11 | 2010 Mar 19 | N | N | 0.54 | 0.46 | ||||
| LkH 339 | 06 10 57.8 | 06 14 37 | HAeBe | 1, 2 | 830 | 5 | 105 | 5 | 2010 Mar 23 | N | N | 0.43 | 0.61 |
| IRAS 061110624 | 06 13 36.2 | 06 25 02 | HAeBe | 11, 12 | 2010 Mar 24 | N | N | 0.58 | 0.61 | ||||
| MWC 137 | 06 18 45.5 | +15 16 52 | HAeBe(?) | 1, 2 | 2010 Mar 19 | N | N | 0.54 | 0.51 | ||||
| IRAS 06210+1432 | 06 23 56.2 | +14 30 28 | HAeBe(?) | 11, 12, 14 | 2010 Mar 19 | N | N | 0.56 | 0.53 | ||||
| IRAS 062451013 | 06 26 53.8 | 10 15 34 | HAeBe | 11, 24 | 2010 Mar 23 | N | N | 0.44 | 0.58 | ||||
| Mon OB1 IRAS12 S1 | 06 30 49.0 | +12 57 54 | Class 0 | 9, 25 | 800 | 25 | 76 | 9 | 2010 May 9 | N | N | 0.65 | 0.63 |
| VY Mon | 06 31 06.9 | +10 26 05 | HAeBe(?) | 1, 2 | 800 | 5 | 15849 | 5 | 2010 Mar 23 | N | N | 0.42 | 0.58 |
| LkH 215 | 06 32 41.8 | +10 09 34 | HAeBe | 1, 2 | 800 | 5 | 2951 | 5 | 2010 Mar 21 | N | N | 0.51 | 0.63 |
| MWC 147 | 06 33 05.2 | +10 29 20 | HAeBe | 1, 2 | 800 | 2 | 10715 | 5 | 2010 Mar 23 | N | N | 0.44 | 0.62 |
| R Mon | 06 39 09.9 | +08 44 11 | HAeBe(?) | 1, 2 | 800 | 5 | 2692 | 5 | 2010 Mar 24 | N | N | 0.38 | 0.46 |
| V590 Mon | 06 40 44.6 | +09 48 02 | HAeBe | 1, 2 | 800 | 2 | 33 | 2 | 2010 Mar 23 | N | N | 0.42 | 0.59 |
| IRAS 06382+1017 | 06 41 03.3 | +10 15 01 | Class I | 17 | 580 | 15 | 110 | 17 | 2010 May 8 | N | N | 0.51 | 0.59 |
| IRAS 064641644 | 06 48 41.8 | 16 48 06 | HAeBe | 11 | 2010 May 16 | N | N | 0.42 | 0.61 | ||||
| IRAS 064750735 | 06 49 58.8 | 07 38 52 | HAeBe | 11, 26 | 2010 May 24 | N | N | 0.64 | 0.69 | ||||
| IRAS 06491+0508 | 06 51 45.8 | +05 05 04 | HAeBe(?) | 11, 12 | 2010 Mar 21 | N | N | 0.38 | 0.46 | ||||
| IRAS 065232458 | 06 54 26.8 | 25 02 12 | HAeBe | 11, 12 | 2010 Mar 16 | N | N | 0.44 | 0.69 | ||||
| IRAS 065310305 | 06 55 39.3 | 03 09 45 | HAeBe | 11 | 2010 Mar 24 | N | N | 0.66 | 0.69 | ||||
| IRAS 065620337 | 06 58 44.2 | 03 41 09 | HAeBe | 11 | 2010 Mar 23 | N | N | 0.42 | 0.59 | ||||
| IRAS 065710441 | 06 59 34.8 | +10 15 01 | HAeBe | 9, 27 | 1400 | 9 | 440 | 9 | 2010 May 8 | Y | N | 0.64 | 0.58 |
| GU CMa | 07 01 49.5 | 11 18 03 | HAeBe | 1, 11 | 2010 Mar 21 | N | N | 0.42 | 0.55 | ||||
| LkH 218 | 07 02 42.5 | 11 26 12 | HAeBe | 1, 2, 11 | 1050 | 5 | 110 | 5 | 2010 Mar 24 | N | N | 0.58 | 0.63 |
| Z CMa | 07 03 43.2 | 11 33 06 | HAeBe | 1 | 1050 | 5 | 427000 | 5 | 2010 Mar 21 | N | N | 0.45 | 0.56 |
| LkH 220 | 07 04 06.7 | 11 26 09 | HAeBe | 1, 2, 11 | 1150 | 2 | 257 | 2 | 2010 Mar 18 | N | N | 0.38 | 0.56 |
| MWC 166 | 07 04 25.5 | 10 27 16 | HAeBe | 1, 11 | 2010 Mar 18 | N | N | 0.38 | 0.58 | ||||
| IRAS 070610414 | 07 08 38.8 | 04 19 08 | HAeBe | 11 | 7950 | 15 | 2010 Mar 16 | N | N | 0.39 | 0.58 | ||
| IRAS 071731733 | 07 19 35.9 | 17 39 18 | HAeBe(?) | 11, 12, 14 | 2010 Mar 21 | N | N | 0.44 | 0.62 | ||||
| IRAS 072222610 | 07 24 16.9 | 26 16 01 | HAeBe | 11 | 2010 Mar 23 | N | N | 0.47 | 0.69 | ||||
| IRAS 072252428 | 07 24 37.0 | 24 34 48 | HAeBe | 11 | 2010 Mar 24 | N | N | 0.61 | 0.68 | ||||
| IRAS 072302539 | 07 25 04.9 | 25 45 48 | HAeBe | 11, 26 | 2010 Mar 23 | N | N | 0.48 | 0.69 | ||||
| IRAS 072961921 | 07 31 48.9 | 19 27 33 | HAeBe | 11 | 2010 Mar 23 | N | N | 0.45 | 0.64 | ||||
| IRAS 073032148 | 07 32 27.2 | 21 55 27 | HAeBe | 11, 12 | 2010 Mar 21 | N | N | 0.48 | 0.64 | ||||
| IRAS 073941953 | 07 41 41.2 | 20 00 14 | HAeBe | 11 | 2010 Mar 16 | N | N | 0.43 | 0.62 | ||||
| IRAS 154622551 | 15 49 15.3 | 26 00 55 | HAeBe | 11, 26 | 2010 Mar 17 | N | N | 0.49 | 0.70 | ||||
| IRAS 154730346 | 15 49 57.7 | 03 55 16 | HAeBe | 1, 11, 28 | 99 | 5 | 23 | 5 | 2010 Feb 22 | N | N | 0.65 | 1.02 |
| IRAS 155372153 | 15 56 40.0 | 22 01 40 | HAeBe | 1, 11, 12 | 145 | 5 | 17 | 5 | 2010 Mar 17 | N | N | 0.47 | 0.64 |
| IRSA 160382735 | 16 06 58.0 | 27 43 10 | HAeBe | 1, 11, 12 | 145 | 5 | 15 | 5 | 2010 Mar 17 | N | N | 0.51 | 0.76 |
| IRAS 161022221 | 16 13 11.6 | 22 29 07 | HAeBe | 11, 12 | 2010 Mar 19 | N | N | 0.44 | 0.59 | ||||
| IRAS 161562358 | 16 18 37.2 | 24 05 18 | HAeBe | 11 | 2010 Mar 19 | N | N | 0.45 | 0.61 | ||||
| Elias 29 | 16 27 09.4 | 24 37 19 | Class I | 8 | 160 | 8 | 41 | 8 | 2010 Jan 12 | N | N | 0.42 | 0.63 |
| IRAS 163722347 | 16 40 17.9 | 23 53 45 | HAeBe | 1, 11, 28 | 203 | 7 | 36 | 7 | 2010 Mar 19 | N | N | 0.47 | 0.62 |
| KK Oph | 17 10 08.1 | 27 15 18 | HAeBe(?) | 1, 2 | 160 | 5 | 26 | 5 | 2010 Mar 17 | N | N | 0.39 | 0.64 |
| IRAS 171782600 | 17 20 56.1 | 26 03 31 | HAeBe | 11, 12 | 2010 Mar 17 | N | N | 0.39 | 0.61 | ||||
| IRAS 174231755 | 17 45 14.2 | 17 56 47 | HAeBe(?) | 11, 12, 14 | 2010 Mar 17 | N | N | 0.43 | 0.64 | ||||
| IRAS 174811415 | 17 50 57.8 | 14 16 11 | HAeBe | 11, 12 | 2010 Feb 22 | N | N | 0.42 | 0.59 | ||||
| MWC 275 | 17 56 21.3 | 21 57 22 | HAeBe | 1, 11, 12 | 130 | 7 | 35 | 7 | 2010 Mar 18 | N | N | 0.36 | 0.53 |
| IRAS 175751647 | 18 00 29.3 | 16 47 23 | HAeBe | 11 | 2010 Mar 19 | N | N | 0.54 | 0.61 | ||||
| IRAS 182132948 | 18 24 29.8 | 29 46 49 | HAeBe | 11, 12 | 145 | 5 | 18 | 5 | 2010 Mar 18 | N | N | 0.32 | 0.53 |
| MWC 297 | 18 27 39.5 | 03 49 52 | HAeBe | 1, 11, 28 | 280 | 23 | 220 | 23 | 2010 Feb 22 | N | N | 0.51 | 0.63 |
| VV Ser | 18 28 47.9 | +00 08 40 | HAeBe | 1, 2, 11 | 614 | 7 | 336 | 7 | 2010 Feb 22 | N | N | 0.45 | 0.58 |
| MWC 300 | 18 29 25.7 | 06 04 37 | HAeBe | 1 | 2010 Mar 18 | N | N | 0.33 | 0.45 | ||||
| Serpens FIRS1 | 18 29 49.6 | +01 15 22 | Class 0 | 8 | 310 | 8 | 46 | 8 | 2010 May 8 | Y | N | 0.64 | 0.47 |
| IRAS 18275+0040 | 18 30 06.2 | +00 42 34 | HAeBe | 11 | 700 | 23 | 3.4 | 23 | 2010 Mar 18 | N | N | 0.32 | 0.44 |
| AS 310 | 18 33 21.2 | 04 58 02 | HAeBe | 1, 2 | 2500 | 5 | 162000 | 5 | 2010 Mar 17 | N | N | 0.43 | 0.55 |
| IRAS 18391+0805 | 18 41 34.8 | +08 08 22 | HAeBe | 11 | 2010 Mar 19 | N | N | 0.49 | 0.51 | ||||
| IRAS 18454+0250 | 18 48 00.4 | +02 54 13 | HAeBe | 11 | 2010 Mar 19 | N | N | 0.53 | 0.51 | ||||
| IRAS 18483+0838 | 18 50 47.2 | +08 42 10 | HAeBe | 11 | 2010 Mar 19 | N | N | 0.51 | 0.52 | ||||
| IRAS 18528+0400 | 18 55 23.0 | +04 04 34 | HAeBe | 11 | 2010 Mar 17 | N | N | 0.39 | 0.53 | ||||
| MWC 614 | 19 11 11.3 | +15 47 16 | HAeBe | 1, 11, 12 | 201 | 7 | 63 | 7 | 2010 Feb 24 | N | N | 0.43 | 0.55 |
| WW Vul | 19 25 58.8 | +21 12 31 | HAeBe | 1, 2 | 696 | 7 | 50 | 7 | 2010 Feb 24 | N | N | 0.44 | 0.52 |
| Par 21 | 19 29 00.7 | +09 38 39 | HAeBe | 1 | 2010 Mar 19 | N | N | 0.33 | 0.41 | ||||
| IRAS 19343+2926 | 19 36 18.9 | +29 32 50 | HAeBe(?) | 11, 12, 14 | 2010 Mar 18 | N | N | 0.31 | 0.40 | ||||
| HH 165 | 19 42 55.7 | +23 24 20 | HAeBe | 8, 29 | 900 | 8 | 52 | 8 | 2010 May 7 | YbbNewly detected objects in our survey. | N | 0.38 | 0.41 |
| V1295 Aql | 20 03 02.5 | +05 44 17 | HAeBe | 1, 11, 28 | 767 | 7 | 471 | 7 | 2010 Mar 17 | N | N | 0.38 | 0.49 |
| IRAS 20050+2720 MMS1 | 20 07 06.7 | +27 28 53 | Class 0 | 8, 9, 30 | 700 | 8 | 305 | 8 | 2010 May 8 | Y | N | 0.58 | 0.52 |
| V1685 Cyg | 20 20 28.2 | +41 21 52 | HAeBe | 1, 2 | 980 | 5 | 60300 | 2010 Apr 18 | N | N | 0.34 | 0.40 | |
| V1686 Cyg | 20 20 29.3 | +41 21 29 | HAeBe | 1, 28 | 980 | 5 | 257 | 5 | 2010 Apr 18 | N | N | 0.38 | 0.38 |
| V1318 CygS | 20 20 30.5 | +41 21 27 | HAeBe | 31 | 1000 | 31 | 1600 | 31 | 2010 Apr 18 | Y | YbbNewly detected objects in our survey. | 0.59 | 0.56 |
| BD+41∘3731 | 20 24 15.7 | +42 18 01 | HAeBe | 13 | 2010 Apr 17 | N | N | 0.53 | 0.52 | ||||
| Par 22 | 20 24 29.5 | +42 14 02 | HAeBe | 1 | 2010 Mar 19 | N | N | 0.51 | 0.49 | ||||
| S106 FIR | 20 27 25.4 | +37 22 48 | Class 0 | 8 | 600 | 8 | 8 | 2010 Jan 13 | Y | N | 0.38 | 0.47 | |
| PV Cep | 20 45 54.0 | +67 57 39 | HAeBe(?) | 1, 2 | 500 | 32 | 80 | 32 | 2010 Feb 22 | N | N | 0.43 | 0.52 |
| V517 Cyg | 20 47 23.3 | +43 44 40 | HAeBe | 13 | 2010 Apr 17 | N | N | 0.51 | 0.53 | ||||
| AS 442 | 20 47 37.5 | +43 47 25 | HAeBe | 1, 28 | 826 | 7 | 207 | 7 | 2010 Feb 24 | N | N | 0.44 | 0.51 |
| LkH 134 | 20 48 04.8 | +43 47 26 | HAeBe | 1 | 700 | 5 | 5248 | 5 | 2010 Mar 19 | N | N | 0.38 | 0.44 |
| LkH 147 | 20 51 02.7 | +43 49 32 | HAeBe | 1, 2 | 800 | 2 | 17378 | 2 | 2010 Mar 19 | N | N | 0.47 | 0.46 |
| V1493 Cyg | 20 52 04.6 | +44 37 31 | HAeBe(?) | 1, 2 | 2010 Mar 19 | N | N | 0.58 | 0.56 | ||||
| V1057 Cyg | 20 58 53.7 | +44 15 29 | HAeBe | 13 | 700 | 32 | 540 | 32 | 2010 Apr 9 | N | N | 0.56 | 0.62 |
| MWC 361 | 21 01 36.9 | +68 09 48 | HAeBe | 1, 2 | 419 | 5 | 13804 | 5 | 2010 Mar 17 | N | N | 0.43 | 0.52 |
| LkH 324 | 21 03 54.2 | +50 15 10 | HAeBe | 1, 2 | 780 | 5 | 912 | 5 | 2010 Feb 22 | N | N | 0.39 | 0.53 |
| HD 203024 | 21 16 03.0 | +68 54 52 | HAeBe(?) | 1, 28 | 2010 Mar 17 | N | N | 0.38 | 0.47 | ||||
| V645 Cyg | 21 39 58.2 | +50 14 21 | HAeBe | 1 | 3500 | 5 | 11749 | 5 | 2010 Feb 22 | Y | N | 0.45 | 0.53 |
| IRAS 21391+5802 | 21 40 42.4 | +58 16 10 | Class 0 | 6, 8, 17 | 750 | 6 | 150 | 6 | 2010 May 7 | Y | Y | 0.47 | 0.53 |
| V361 Cep | 21 42 50.2 | +66 06 35 | HAeBe | 1, 2 | 1250 | 5 | 9120 | 5 | 2010 May 8 | N | N | 0.72 | 0.70 |
| NGC 7129 FIRS2 | 21 43 01.6 | +66 03 26 | Class 0 | 6, 8, 9 | 1250 | 6 | 500 | 6 | 2010 May 8 | Y | Y | 0.39 | 0.41 |
| V373 Cep | 21 43 06.7 | +66 06 55 | HAeBe | 1, 2 | 1250 | 5 | 4677 | 5 | 2010 May 8 | Y | N | 0.77 | 0.81 |
| AS 477 | 21 52 34.1 | +47 13 44 | HAeBe | 1, 2 | 1200 | 5 | 1072 | 5 | 2010 Mar 19 | N | N | 0.61 | 0.55 |
| LkH 257 | 21 54 18.8 | +47 12 10 | HAeBe | 1 | 2010 Mar 19 | N | N | 0.59 | 0.59 | ||||
| BH Cep | 22 01 42.9 | +69 44 37 | HAeBe | 1, 2 | 450 | 5 | 9 | 5 | 2010 Mar 17 | N | N | 0.27 | 0.34 |
| IRAS 22176+6303 | 22 19 18.1 | +63 18 49 | Class I | 8 | 910 | 8 | 337 | 8 | 2010 May 8 | N | Y | 0.59 | 0.61 |
| SV Cep | 22 21 33.2 | +73 40 27 | HAeBe | 1, 2 | 596 | 7 | 38 | 7 | 2010 Mar 21 | N | N | 0.36 | 0.52 |
| IRAS 22267+6244 | 22 28 29.3 | +62 59 44 | Class I | 8, 33 | 900 | 33 | 310 | 33 | 2010 May 8 | N | N | 0.55 | 0.55 |
| IRAS 22272+6358 | 22 28 52.2 | +64 13 43 | Class I | 8, 33 | 950 | 33 | 815 | 33 | 2010 May 8 | N | N | 0.48 | 0.52 |
| LkH 233 | 22 34 41.0 | +40 40 05 | HAeBe | 1, 2 | 880 | 5 | 93 | 5 | 2010 Mar 19 | N | N | 0.58 | 0.55 |
| IRAS 22451+6154 | 22 47 02.1 | +62 10 11 | Class I | 9, 17 | 1290 | 23 | 823 | 23 | 2010 May 8 | N | N | 0.49 | 0.51 |
| IL Cep | 22 53 15.6 | +62 08 45 | HAeBe | 1 | 2010 Mar 17 | N | N | 0.43 | 0.52 | ||||
| IRAS 23011+6126 | 23 03 13.9 | +61 42 21 | Class 0 | 6, 8, 9 | 730 | 6 | 100 | 6 | 2010 Jan 14 | N | YbbNewly detected objects in our survey. | 0.26 | 0.33 |
| BHJ 71 | 23 05 07.5 | +62 15 37 | HAeBe | 1 | 2010 Mar 18 | N | N | 0.36 | 0.49 | ||||
| IRAS 23037+6213 | 23 05 50.3 | +62 30 12 | Class I | 8, 33 | 750 | 8 | 129 | 8 | 2010 May 8 | Y | N | 0.49 | 0.49 |
| MWC 1080 | 23 17 25.6 | +60 50 44 | HAeBe(?) | 1, 2 | 2200 | 5 | 3388441 | 5 | 2010 Mar 18 | N | N | 0.36 | 0.51 |
| LkH 259 | 23 58 41.6 | +66 26 13 | HAeBe | 1 | 2010 Mar 17 | N | N | 0.43 | 0.51 | ||||
References. — (1) Thé et al. 1994; (2) Hernández et al. 2004; (3) Mannings & Sargent 2000; (4) Hernández et al. 2004; (5) Manoj et al. 2006; (6) Alonso-Albi et al. 2010; (7) Montesinos et al. 2009; (8) Furuya et al. 2003; (9) Froebrich 2005; (10) Chen et al. 2009; (11) Vieira et al. 2003; (12) Sartori et al. 2010; (13) Palla & Prusti 1993; (14) Vieira et al. 2011; (15) Yang et al. 2002; (16) Malfait et al. 1998; (17) Saraceno et al. 1996; (18) Beltrán et al. 2001; (19) Dent et al. 1998; (20) Chini et al. 2001; (21) Wu et al. 1996; (22) Sandell et al. 1999; (23) Connelley et al. 2008; (24) Gregorio-Hetem et al. 1992; (25) Wolf-Chase et al. 2003; (26) Torres et al. 1995; (27) Han et al. 1998; (28) Mora et al. 2001; (29) Dent & Aspin 1992; (30) Furuya et al. 2005; (31) Palla et al. 1995; (32) Wu et al. 2004; (33) Connelley et al. 2007.
| Frequency | FWHM | Velocity Resolution | Velocity Coverage | System Temperature | ||
|---|---|---|---|---|---|---|
| Maser | (GHz) | (′′) | (km s-1) | (km s-1) | (K) | |
| H2O | 22.23508 | 130 | 0.72 | 0.105 | 432 | 60 - 150 |
| CH3OH | 44.06943 | 65 | 0.69 | 0.053 | 218 | 120 - 210 |
| Gaussian Fits | Integrated Lines | |||||||||
|---|---|---|---|---|---|---|---|---|---|---|
| Observing | Equivalent Width | |||||||||
| Source | Date | (Jy km s-1) | (km s-1) | (km s-1) | (Jy km s-1) | (Jy) | (km s-1) | (km s-1) | ||
| (1) | (2) | (3) | (4) | (5) | (6) | (7) | (8) | (9) | ||
| CB 3 | 2010 May 7 | 10.540.33 | 0.76 0.03 | 11.21 | 12.65 | 60.15 | 0.88 | |||
| 2010 Oct 20 | 13.200.55 | 1.43 0.09 | 12.09 | 9.10 | 60.57 | 1.32 | ||||
| 4.100.44 | 0.66 0.08 | 4.21 | 5.32 | 12.53 | 0.78 | |||||
| 2010 Dec 2 | 1.880.33 | 1.17 0.23 | 1.77 | 1.77 | 75.31 | 0.99 | ||||
| 4.550.44 | 2.12 0.20 | 4.21 | 2.10 | 60.99 | 2.04 | |||||
| 1.770.11 | 0.43 0.05 | 1.88 | 3.33 | 12.53 | 0.58 | |||||
| IRAS 00338+6312 | 2010 May 7 | 2.770.33 | 1.16 0.17 | 2.99 | 2.44 | 15.91 | 1.23 | |||
| 2010 Oct 20 | 1.550.33 | 0.60 0.21 | 1.66 | 2.44 | 15.07 | 0.68 | ||||
| 2010 Dec 2 | ||||||||||
| IRAS 053380624 | 2010 Jan 13 | 45.730.44 | 1.09 0.01 | 54.05 | 42.62 | 6.64 | 1.26 | |||
| 2010 Oct 20 | 48.501.33 | 1.69 0.05 | 52.72 | 27.30 | 8.53 | 1.93 | ||||
| 4.100.77 | 0.54 0.09 | 4.88 | 7.32 | 11.48 | 0.68 | |||||
| 2010 Dec 2 | 11.760.55 | 1.22 0.08 | 12.09 | 8.99 | 5.16 | 1.35 | ||||
| 10.760.88 | 1.24 0.12 | 8.54 | 8.54 | 7.48 | 1.00 | |||||
| 19.090.66 | 0.86 0.04 | 21.09 | 21.86 | 8.95 | 0.97 | |||||
| 5.320.44 | 0.53 0.05 | 5.32 | 9.87 | 11.48 | 0.55 | |||||
| IRAS 053380647 | 2010 May 8 | 104.340.44 | 0.64 0.01 | 111.00 | 158.28 | 6.64 | 0.70 | |||
| 2010 Oct 20 | 155.840.44 | 0.69 0.01 | 155.51 | 209.45 | 6.64 | 0.74 | ||||
| 2010 Dec 2 | 86.240.33 | 0.60 0.01 | 87.24 | 126.98 | 6.64 | 0.69 | ||||
| IRAS 053750731 | 2010 Jan 18 | 4.550.33 | 1.12 0.10 | 4.55 | 3.44 | 13.38 | 1.32 | |||
| 2010 Oct 20 | 10.760.44 | 1.08 0.06 | 11.32 | 9.87 | 0.32 | 1.15 | ||||
| 2010 Dec 2 | 89.350.44 | 0.78 0.01 | 92.01 | 109.22 | 0.53 | 0.84 | ||||
| 4.320.44 | 0.75 0.07 | 4.88 | 5.32 | 2.21 | 0.92 | |||||
| IRAS 065710441 | 2010 May 7 | 7.770.44 | 0.75 0.05 | 7.65 | 9.43 | 16.53 | 0.80 | |||
| 2010 Oct 20 | ||||||||||
| 2010 Dec 2 | ||||||||||
| Serpens FIRS1 | 2010 May 8 | 5.660.44 | 0.96 0.08 | 5.99 | 5.32 | 18.01 | 1.11 | |||
| 26.411.77 | 2.10 0.16 | 16.98 | 13.65 | 21.59 | 1.25 | |||||
| 132.860.44 | 1.22 0.01 | 133.53 | 100.78 | 23.49 | 1.33 | |||||
| 2010 Oct 20 | 7.770.55 | 0.83 0.06 | 7.88 | 8.43 | 6.43 | 0.90 | ||||
| 11.320.88 | 1.32 0.11 | 12.43 | 8.32 | 16.96 | 1.48 | |||||
| 23.750.99 | 1.50 0.07 | 22.53 | 15.42 | 18.22 | 1.47 | |||||
| 4.770.77 | 1.05 0.17 | 5.10 | 4.77 | 21.38 | 1.05 | |||||
| 6.320.77 | 1.18 0.16 | 5.99 | 5.10 | 23.49 | 1.18 | |||||
| 2010 Dec 2 | 2.100.55 | 0.64 0.24 | 2.88 | 2.88 | 15.69 | 1.01 | ||||
| 38.620.77 | 1.51 0.03 | 36.96 | 23.86 | 18.01 | 1.56 | |||||
| 6.320.77 | 1.27 0.18 | 5.66 | 4.77 | 21.59 | 1.18 | |||||
| 1.660.44 | 0.59 0.15 | 1.88 | 2.99 | 22.86 | 0.66 | |||||
| HH 165 | 2010 May 8 | 1.880.33 | 0.80 0.11 | 1.66 | 2.10 | 24.54 | 0.82 | |||
| 2010 Oct 20 | 3.330.44 | 0.83 0.11 | 3.10 | 4.21 | 25.18 | 0.76 | ||||
| 2010 Dec 2 | 2.550.44 | 0.80 0.14 | 2.55 | 3.33 | 25.39 | 0.79 | ||||
| IRAS 20050+2720 MMS1 | 2010 May 8 | 19.090.77 | 3.59 0.18 | 17.31 | 5.43 | 84.37 | 3.13 | |||
| 2010 Oct 20 | 15.540.77 | 2.56 0.15 | 14.98 | 6.43 | 87.11 | 2.37 | ||||
| 2010 Dec 2 | 4.770.55 | 1.57 0.21 | 4.32 | 3.77 | 2.63 | 1.17 | ||||
| V1318 CygS | 2010 Apr 18 | 54.610.44 | 0.85 0.01 | 56.16 | 57.38 | 2.21 | 0.97 | |||
| 200.350.77 | 1.87 0.01 | 191.47 | 96.23 | 0.32 | 1.98 | |||||
| 61.930.88 | 1.70 0.03 | 48.50 | 35.74 | 2.63 | 1.34 | |||||
| 4.210.44 | 0.58 0.06 | 3.88 | 5.99 | 11.06 | 0.65 | |||||
| 2010 Oct 20 | 47.280.55 | 0.71 0.01 | 58.49 | 65.26 | 2.42 | 0.89 | ||||
| 137.970.99 | 2.75 0.03 | 130.75 | 52.39 | 0.11 | 2.50 | |||||
| 6.320.44 | 0.63 0.05 | 7.77 | 10.21 | 3.48 | 0.75 | |||||
| 20.530.44 | 0.60 0.01 | 21.53 | 32.07 | 11.48 | 0.67 | |||||
| 7.650.77 | 2.30 0.25 | 9.54 | 4.88 | 14.01 | 1.92 | |||||
| 2010 Dec 2 | 43.730.44 | 0.73 0.01 | 44.06 | 53.28 | 2.42 | 0.83 | ||||
| 92.680.77 | 1.41 0.01 | 97.79 | 60.82 | 0.32 | 1.60 | |||||
| 7.540.44 | 0.74 0.05 | 6.66 | 10.21 | 2.21 | 0.66 | |||||
| 8.990.44 | 0.51 0.03 | 9.54 | 15.42 | 11.48 | 0.62 | |||||
| 3.550.77 | 1.13 0.28 | 4.10 | 4.32 | 16.54 | 0.93 | |||||
| S106 FIR | 2010 Jan 13 | 41.620.44 | 1.78 0.03 | 39.84 | 23.31 | 13.80 | 1.71 | |||
| 22.750.99 | 2.05 0.11 | 12.43 | 10.10 | 12.32 | 1.22 | |||||
| 30.300.44 | 1.85 0.03 | 29.85 | 16.53 | 8.53 | 1.80 | |||||
| 2010 Oct 20 | 7.771.22 | 2.08 0.40 | 5.10 | 3.88 | 13.38 | 1.30 | ||||
| 3.330.99 | 0.98 0.21 | 6.54 | 4.88 | 11.27 | 1.34 | |||||
| 33.411.44 | 2.40 0.16 | 25.41 | 15.20 | 9.59 | 1.67 | |||||
| 10.873.10 | 1.90 0.56 | 6.43 | 6.43 | 7.90 | 1.01 | |||||
| 4.210.55 | 1.43 0.22 | 4.10 | 2.99 | 6.85 | 1.34 | |||||
| 2010 Dec 2 | 4.770.99 | 2.00 0.54 | 4.10 | 3.10 | 12.75 | 1.24 | ||||
| 0.880.33 | 0.27 0.10 | 2.22 | 3.33 | 11.69 | 0.69 | |||||
| 8.880.88 | 2.71 0.38 | 7.65 | 4.77 | 9.37 | 1.58 | |||||
| V645 Cyg | 2010 Feb 22 | 11.210.77 | 1.70 0.13 | 7.54 | 5.99 | 56.99 | 1.24 | |||
| 90.680.55 | 1.20 0.01 | 97.79 | 70.48 | 53.83 | 1.39 | |||||
| 18.640.77 | 1.32 0.06 | 12.65 | 12.65 | 50.88 | 1.00 | |||||
| 24.190.55 | 1.38 0.05 | 19.42 | 16.42 | 49.82 | 1.18 | |||||
| 56.160.33 | 0.78 0.01 | 58.60 | 66.60 | 46.66 | 0.88 | |||||
| 2010 Oct 20 | 120.990.77 | 1.23 0.01 | 122.76 | 89.02 | 54.88 | 1.38 | ||||
| 103.230.88 | 1.65 0.02 | 104.34 | 62.04 | 51.30 | 1.68 | |||||
| 6.660.55 | 0.65 0.07 | 7.54 | 9.43 | 46.24 | 0.80 | |||||
| 2010 Dec 2 | 115.660.55 | 1.09 0.01 | 117.66 | 101.12 | 54.67 | 1.16 | ||||
| 44.510.99 | 1.07 0.03 | 51.72 | 39.18 | 51.93 | 1.32 | |||||
| 44.621.22 | 1.32 0.05 | 38.07 | 33.85 | 50.46 | 1.12 | |||||
| 4.320.55 | 0.93 0.19 | 4.32 | 4.77 | 46.03 | 0.91 | |||||
| IRAS 21391+5802 | 2010 May 7 | 5.100.44 | 1.37 0.13 | 4.77 | 4.10 | 20.96 | 1.17 | |||
| 3.330.33 | 0.54 0.05 | 3.44 | 5.21 | 15.91 | 0.66 | |||||
| 13.870.44 | 0.96 0.03 | 10.87 | 14.65 | 11.27 | 0.74 | |||||
| 23.190.77 | 1.88 0.07 | 20.42 | 11.43 | 10.22 | 1.77 | |||||
| 5.660.33 | 0.61 0.04 | 5.88 | 8.43 | 1.58 | 0.68 | |||||
| 15.650.33 | 0.71 0.02 | 17.31 | 21.86 | 2.21 | 0.80 | |||||
| 2010 Oct 20 | 15.980.55 | 1.25 0.06 | 16.76 | 12.09 | 20.12 | 1.38 | ||||
| 33.850.55 | 1.32 0.04 | 41.07 | 27.08 | 10.01 | 1.51 | |||||
| 2.660.44 | 0.57 0.14 | 3.33 | 5.21 | 0.11 | 0.63 | |||||
| 2.550.44 | 0.87 0.16 | 2.66 | 2.88 | 3.27 | 0.91 | |||||
| 2010 Dec 2 | 9.100.55 | 0.99 0.09 | 11.98 | 10.10 | 19.70 | 1.17 | ||||
| 8.320.88 | 1.25 0.17 | 10.54 | 7.65 | 10.22 | 1.36 | |||||
| 7.540.88 | 1.19 0.16 | 8.32 | 6.54 | 8.74 | 1.28 | |||||
| NGC7129 FIRS2 | 2010 May 8 | 295.260.88 | 1.54 0.01 | 310.35 | 188.47 | 11.27 | 1.65 | |||
| 101.120.55 | 1.13 0.01 | 55.94 | 87.13 | 7.48 | 0.64 | |||||
| 37.850.77 | 1.41 0.03 | 37.74 | 24.42 | 5.37 | 1.54 | |||||
| 2010 Oct 20 | 286.712.22 | 0.97 0.01 | 297.25 | 288.93 | 11.48 | 1.03 | ||||
| 1618.491.99 | 0.81 0.01 | 1632.03 | 1814.96 | 7.90 | 0.90 | |||||
| 130.642.55 | 1.22 0.03 | 132.09 | 103.11 | 4.95 | 1.28 | |||||
| 2010 Dec 2 | 126.312.77 | 1.12 0.03 | 134.19 | 110.00 | 11.48 | 1.22 | ||||
| 908.092.55 | 0.95 0.01 | 955.26 | 900.98 | 7.90 | 1.06 | |||||
| 34.632.77 | 0.96 0.10 | 40.73 | 37.07 | 5.16 | 1.10 | |||||
| V373 Cep | 2010 May 8 | 5.991.22 | 1.80 0.52 | 4.66 | 3.44 | 21.80 | 1.33 | |||
| 18.311.44 | 1.82 0.18 | 14.43 | 10.65 | 18.43 | 1.37 | |||||
| 18.421.22 | 1.44 0.12 | 14.98 | 12.54 | 16.54 | 1.20 | |||||
| 25.753.33 | 2.98 0.49 | 12.54 | 9.32 | 15.06 | 1.34 | |||||
| 59.940.88 | 1.07 0.02 | 66.04 | 55.27 | 12.53 | 1.20 | |||||
| 33.410.44 | 0.61 0.01 | 34.52 | 50.83 | 9.59 | 0.68 | |||||
| 13.870.88 | 1.52 0.13 | 14.87 | 9.43 | 6.21 | 1.56 | |||||
| 2010 Oct 20 | 22.420.99 | 1.42 0.08 | 22.08 | 16.42 | 15.27 | 1.34 | ||||
| 40.951.44 | 1.54 0.07 | 39.96 | 24.42 | 13.38 | 1.63 | |||||
| 28.521.11 | 1.26 0.06 | 27.97 | 24.30 | 11.48 | 1.15 | |||||
| 78.140.11 | 0.78 0.01 | 79.80 | 96.34 | 9.59 | 0.83 | |||||
| 104.670.77 | 0.88 0.01 | 109.00 | 118.21 | 7.90 | 0.92 | |||||
| 7.540.88 | 1.12 0.17 | 8.99 | 6.99 | 5.16 | 1.27 | |||||
| 2010 Dec 2 | 11.100.99 | 0.99 0.09 | 14.20 | 14.31 | 16.54 | 0.99 | ||||
| 66.602.10 | 2.62 0.11 | 54.05 | 24.75 | 14.22 | 2.18 | |||||
| 57.271.55 | 1.24 0.03 | 69.15 | 46.95 | 11.48 | 1.48 | |||||
| 38.730.55 | 0.64 0.01 | 41.18 | 58.60 | 9.59 | 0.70 | |||||
| 67.480.88 | 1.07 0.02 | 68.04 | 60.82 | 7.90 | 1.13 | |||||
| 2.100.55 | 0.55 0.22 | 3.33 | 4.10 | 5.37 | 0.80 | |||||
| 3.440.77 | 0.81 0.19 | 4.88 | 5.21 | 1.37 | 0.97 | |||||
| IRAS 23037+6213 | 2010 May 8 | 6.100.33 | 0.63 0.04 | 6.43 | 8.65 | 10.43 | 0.73 | |||
| 2010 Oct 20 | ||||||||||
| 2010 Dec 2 | ||||||||||
| Gaussian Fits | Integrated Lines | |||||||||
|---|---|---|---|---|---|---|---|---|---|---|
| Observing | Equivalent Width | |||||||||
| Source | Date | (Jy km s-1) | (km s-1) | (km s-1) | (Jy km s-1) | (Jy) | (km s-1) | (km s-1) | ||
| (1) | (2) | (3) | (4) | (5) | (6) | (7) | (8) | (9) | ||
| CB 3 | 2010 May 7 | 23.20 0.92 | 3.82 0.20 | 20.64 | 7.19 | 38.96 | 2.87 | |||
| 4.87 0.46 | 1.28 0.17 | 6.14 | 3.71 | 32.15 | 1.62 | |||||
| 2010 Oct 20 | 18.09 1.04 | 2.17 0.15 | 18.21 | 8.58 | 38.32 | 2.12 | ||||
| 6.61 1.27 | 2.52 0.72 | 4.06 | 4.75 | 35.77 | 0.88 | |||||
| 6.26 0.92 | 1.48 0.31 | 5.56 | 4.98 | 32.15 | 1.11 | |||||
| 2010 Dec 2 | 22.04 0.81 | 3.27 0.16 | 20.41 | 8.58 | 38.74 | 2.39 | ||||
| 8.46 0.81 | 2.05 0.26 | 7.65 | 4.52 | 31.94 | 1.72 | |||||
| IRAS 00338+6312 | 2010 May 7 | 3.48 0.34 | 0.78 0.10 | 3.24 | 4.06 | 17.54 | 0.81 | |||
| 2010 Oct 20 | 3.82 0.58 | 0.88 0.20 | 3.71 | 4.98 | 17.54 | 0.77 | ||||
| 2010 Dec 2 | 4.06 0.58 | 1.40 0.33 | 4.29 | 4.75 | 17.54 | 0.92 | ||||
| OMC3 MMS9 | 2010 May 6 | 2.32 0.34 | 0.64 0.10 | 2.32 | 3.24 | 11.21 | 0.70 | |||
| 2010 Oct 20 | ||||||||||
| 2010 Dec 2 | ||||||||||
| OMC2 FIR4 | 2010 May 6 | 81.78 0.58 | 0.45 0.01 | 86.18 | 153.35 | 11.33 | 0.56 | |||
| 2010 Oct 20 | 93.38 0.58 | 0.44 0.01 | 97.78 | 176.32 | 11.33 | 0.55 | ||||
| 2010 Dec 2 | 92.80 0.58 | 0.44 0.01 | 99.18 | 174.34 | 11.33 | 0.57 | ||||
| IRAS 053380624 | 2010 Jan 13 | 1.97 0.34 | 1.34 0.34 | 1.74 | 1.74 | 6.96 | 1.07 | |||
| 1.16 0.34 | 0.86 0.30 | 1.04 | 1.27 | 8.03 | 0.82 | |||||
| 2010 Oct 20 | ||||||||||
| 2010 Dec 2 | 1.85 1.04 | 0.71 0.42 | 2.20 | 2.90 | 6.96 | 0.75 | ||||
| 2.55 1.04 | 0.79 0.42 | 2.32 | 3.01 | 7.81 | 0.77 | |||||
| V1318 CygS | 2010 Apr 18 | 22.27 0.11 | 0.37 0.01 | 25.05 | 54.17 | 8.88 | 0.46 | |||
| 2010 Oct 20 | 22.50 0.34 | 0.36 0.01 | 24.70 | 56.72 | 8.88 | 0.43 | ||||
| 2010 Dec 2 | 24.47 0.34 | 0.37 0.01 | 27.95 | 61.13 | 8.88 | 0.46 | ||||
| IRAS 21391+5802 | 2010 May 7 | 7.19 0.46 | 0.56 0.04 | 7.65 | 11.94 | 0.90 | 0.64 | |||
| 6.84 0.58 | 1.56 0.16 | 6.61 | 4.52 | 6.54 | 1.44 | |||||
| 2010 Oct 20 | 5.56 0.34 | 0.47 0.03 | 5.68 | 11.36 | 0.90 | 0.51 | ||||
| 6.38 0.58 | 1.63 0.18 | 6.72 | 4.52 | 6.75 | 1.44 | |||||
| 2010 Dec 2 | 6.96 0.34 | 0.67 0.04 | 7.54 | 10.55 | 0.90 | 0.70 | ||||
| 2.66 0.58 | 0.56 0.17 | 3.24 | 4.87 | 6.54 | 0.68 | |||||
| NGC7129 FIRS2 | 2010 May 8 | 3.24 0.46 | 1.52 0.26 | 3.01 | 2.20 | 8.13 | 1.36 | |||
| 2010 Oct 20 | 4.87 0.58 | 2.09 0.35 | 4.52 | 2.66 | 7.92 | 1.75 | ||||
| 2010 Dec 2 | 3.59 0.58 | 0.96 0.15 | 3.48 | 4.06 | 7.92 | 0.84 | ||||
| IRAS 22176+6303 | 2010 May 8 | 7.30 0.34 | 0.50 0.03 | 7.65 | 12.99 | 8.34 | 0.59 | |||
| 2010 Oct 20 | 8.00 0.34 | 0.48 0.02 | 8.00 | 14.15 | 8.34 | 0.57 | ||||
| 2010 Dec 2 | 6.72 0.46 | 0.49 0.04 | 7.19 | 11.83 | 8.34 | 0.61 | ||||
| IRAS 23011+6126 | 2010 Jan 14 | 1.27 0.34 | 0.76 0.27 | 1.16 | 1.74 | 13.05 | 0.67 | |||
| 1.16 0.11 | 0.41 0.09 | 1.16 | 2.32 | 11.35 | 0.49 | |||||
| 2010 Oct 20 | 1.16 0.23 | 0.37 0.15 | 1.50 | 2.32 | 13.27 | 0.56 | ||||
| 3.13 0.46 | 1.20 0.25 | 2.90 | 2.66 | 11.35 | 1.10 | |||||
| 2010 Dec 2 | 1.97 0.46 | 0.84 0.25 | 1.85 | 2.20 | 11.35 | 0.88 | ||||
| Source | Number | H2O | CH3OH |
|---|---|---|---|
| Type | of Sources | (%) | (%) |
| Class 0 | 14 | 50 (7/14) | 36 (5/14) |
| Class I | 19 | 21 (4/19) | 21 (4/19) |
| HAeBe | 147 | 3 (5/147) | 1 (1/147) |
| Total | 180 | 9 (16/180) | 6 (10/180) |
| R.A. | Decl. | Observing | ||||
|---|---|---|---|---|---|---|
| Source | (J2000) | (J2000) | Date | (km s-1) | (Jy) | Ref. |
| LkH 198 | 00 06 06aaCoordinates are based on the B1900 equatorial system. | +58 17 00aaCoordinates are based on the B1900 equatorial system. | 1974 Sep 6 | 3 | 1 | |
| HD 250550 | 05 56 12aaCoordinates are based on the B1900 equatorial system. | +16 31 00aaCoordinates are based on the B1900 equatorial system. | 1975 Apr 20 | 1.5 | 1 | |
| IRAS 065710441 | 06 57 06.4 | 04 41 48 | 1993 Nov 23 | 47.9 | 2 | |
| V1318 CygS | 20 20 30.5 | +41 21 27 | 1992 Nov 24 | 13 | 3 | |
| 20 20 30.6 | +41 21 26 | 2002 Sep 9 | bbWe only provide the strongest component. See Marvel (2005) for the full list of maser components. | 46.7bbWe only provide the strongest component. See Marvel (2005) for the full list of maser components. | 4 | |
| PV Cep | 20 45 21.5 | +67 46 41 | 1984 Jun 26 | 5 | ||
| 5 | ||||||
| V1057 Cyg | 20 57 06.2 | +44 03 46 | 1984 Jan | ccRodriguez et al. (1987) provided an H2O maser position, but no maser line parameters. | ccRodriguez et al. (1987) provided an H2O maser position, but no maser line parameters. | 6 |
| V645 Cyg | 21 38 10.6 | +50 00 43 | 1979 Jan | 50.2 | 42 | 7 |
| 3 | 7 | |||||
| 13 | 7 | |||||
| V373 Cep | 21 40 48aaCoordinates are based on the B1900 equatorial system. | +65 39 00aaCoordinates are based on the B1900 equatorial system. | 1975 Jun 8 | 5 | 1 |
| V1318 CygS | V1685 Cyg | V1686 Cyg | |||||||||
|---|---|---|---|---|---|---|---|---|---|---|---|
| Observing | Line | Frequency | Theoretical Estimation | Theoretical Estimation | |||||||
| Date | NumberaaNumbers of each line are displayed in Figure 5. | (GHz) | (km s-1) | (Jy) | (Jy) | (Jy) | (Jy) | (Jy) | |||
| 2010 Apr 18 | 1 | 22.23508 | 57.38 | 47.28 | 55.38 | ||||||
| 2 | 22.23508 | 96.23 | 75.70 | 91.35 | |||||||
| 3 | 22.23508 | 35.74 | 29.19 | 35.18 | |||||||
| 4 | 22.23508 | 5.99 | 4.77 | 5.32 | |||||||
| 5 | 44.06943 | 54.17 | 26.21 | 49.99 | |||||||
| 2010 Oct 20 | 1 | 22.23508 | 65.26 | 55.05 | 63.38 | ||||||
| 2 | 22.23508 | 52.39 | 44.62 | 49.50 | |||||||
| 3 | 22.23508 | 10.21 | 8.54 | 9.99 | |||||||
| 4 | 22.23508 | 32.07 | 25.75 | 29.97 | |||||||
| 5 | 22.23508 | 4.88 | 4.21 | 4.66 | |||||||
| 6 | 44.06943 | 56.72 | 19.72 | 45.47 | |||||||
| 2010 Dec 2 | 1 | 22.23508 | 53.28 | 44.51 | 52.61 | ||||||
| 2 | 22.23508 | 60.82 | 51.17 | 59.16 | |||||||
| 3 | 22.23508 | 10.21 | 7.88 | 9.99 | |||||||
| 4 | 22.23508 | 15.42 | 13.65 | 14.76 | |||||||
| 5 | 22.23508 | 4.32 | 3.44 | 4.32 | |||||||
| 6 | 44.06943 | 61.13 | 32.59 | 56.72 | |||||||
| NGC 7129 FIRS2 | V373 Cep | V361 Cep | |||||||
|---|---|---|---|---|---|---|---|---|---|
| Observing | Line | Theoretical Estimation | |||||||
| Date | NumberaaNumbers of each line are displayed in Figure 6. | (km s-1) | (Jy) | (Jy) | (Jy) | (Jy) | |||
| 2010 May 8 | 1 | 1.33 | 3.44 | 2.33 | |||||
| 2 | 1.33 | 10.66 | 4.55 | ||||||
| 3 | 1.33 | 12.54 | 2.44 | ||||||
| 4 | 1.33 | 9.32 | 2.33 | ||||||
| 5 | 1.33 | 55.28 | 9.99 | ||||||
| 6 | 188.48 | 2.55 | 11.43 | ||||||
| 7 | 1.33 | 50.84 | 9.43 | ||||||
| 8 | 87.13 | 2.55 | 5.11 | ||||||
| 9 | 1.33 | 9.43 | 5.33 | ||||||
| 10 | 24.42 | 2.55 | 3.33 | ||||||
| 2010 Oct 20 | 1 | 1.78 | 16.43 | 2.44 | |||||
| 2 | 1.78 | 24.42 | 2.44 | ||||||
| 3 | 288.93 | 24.31 | 12.21 | ||||||
| 4 | 1.78 | 96.35 | 16.54 | ||||||
| 5 | 1814.96 | 118.22 | 77.59 | ||||||
| 6 | 103.12 | 6.99 | 4.66 | ||||||
| 2010 Dec 2 | 1 | 2.22 | 14.32 | 2.11 | |||||
| 2 | 2.22 | 24.75 | 3.88 | ||||||
| 3 | 110.00 | 46.95 | 8.32 | ||||||
| 4 | 2.22 | 58.61 | 7.66 | ||||||
| 5 | 900.99 | 60.83 | 33.30 | ||||||
| 6 | 37.07 | 4.11 | 2.11 | ||||||
| 7 | 2.22 | 5.22 | 2.11 | ||||||
| aaNumbers in the parentheses represent the maser luminosities in each observation epoch. | aaNumbers in the parentheses represent the maser luminosities in each observation epoch. | |||||
|---|---|---|---|---|---|---|
| Source | (km s-1) | Transition | Ref. | () | () | |
| CB 3 | 38.8 | 1 | ||||
| IRAS 00338+6312 | 17.7 | 2 | ||||
| OMC3 MMS9 | +11.6 | 3 | ||||
| OMC2 FIR4 | +11.3 | 3 | ||||
| IRAS 053380624 | +7.1 | 4 | ||||
| IRAS 053380647 | +9.1 | 5 | ||||
| IRAS 053750731 | +5.3 | 4 | ||||
| IRAS 065710441 | +25.9 | 2 | ||||
| Serpens FIRS1 | +8.3 | 6 | ||||
| HH 165 | +31.5 | 7 | ||||
| IRAS 20050+2720 MMS1 | +5.9 | 4 | ||||
| V1318 CygS | +7.9 | 8 | ||||
| S106 FIR | 1.6 | 4 | ||||
| V645 Cyg | 44.1 | 9 | ||||
| IRAS 21391+5802 | +0.5 | 4 | ||||
| NGC 7129 FIRS2 | 10.4 | 9 | ||||
| V373 Cep | 10.4 | 9 | ||||
| IRAS 22176+6303 | 8.1 | 10 | ||||
| IRAS 23011+6126 | 11.0 | 4 | ||||
| IRAS 23037+6213 | 9.8 | 11 |
References. — (1) De Vries et al. 2002; (2) Bronfman et al. 1996; (3) Tatematsu et al. 2008; (4) de Gregorio-Monsalvo et al. 2006; (5) Viti et al. 2006; (6)Ungerechts & Güsten 1984; (7) Dent & Aspin 1992; (8) Palla et al. 1995; (9) Scappini & Codella 1996; (10) Yang et al. 2002; (11)Williams & Myers 1999.