Dielectric properties and lattice dynamics of -PbO2-type TiO2: The role of soft phonon modes in pressure-induced phase transition to baddeleyite-type TiO2
Abstract
Dielectric tensor and lattice dynamics of -PbO2-type TiO2 have been investigated using the density functional perturbation theory, with a focus on responses of the vibrational frequencies to pressure. The calculated Raman spectra under different pressures are in good agreement with available experimental results and the symmetry assignments of the Raman peaks of -PbO2-type TiO2 are given for the first time. In addition, we identified two anomalously IR-active soft phonon modes, and , respectively, around 200 cm-1 which have not been observed in high pressure experiments. Comparison of the phonon dispersions at 0 and 10 GPa reveals that softening of phonon modes also occurs for the zone-boundary modes. The and modes play an important role in transformation from the -PbO2-type phase to baddeleyite phase. The significant relaxations of the oxygen atoms from the Ti4 plane in the Ti2O2Ti2 complex of the baddeleyite phase are directly correlated to the oxygen displacements along the directions given by the eigenvectors of the soft and modes in the -PbO2-type phase.
I INTRODUCTION
Titanium dioxide (TiO2) has attracted much interest for a long time due to its potential applications in photocatalysis. Besides the three well studied ambient phases (rutile, anatase, and brookite),Amorphization_PRB1 ; Amorphization_PRB2 ; Exp_Cal_Anatase interest in TiO2 has also extended to high pressure phases to fully explore its novel structural and electronic properties.B0 ; Khatatbeh ; Anatase_Size2 For instance, application of high pressure on TiO2 at room temperature induces a series of high-pressure phases with hardness approaching that of diamond.Ultrastiff The cotunnite-type TiO2 synthesized at pressure () above 60 GPa and temperature above 1000 K is believed to be the hardest oxide yet discovered.cotunnite In addition, density functional theory calculation predicted that the high-pressure modification of TiO2 could lead to a polymorph which responds to visible light,Visible extending the photocatalyst property of TiO2 from ultraviolet to visible light.
The high pressure induced structural transition of TiO2 generally follows these sequences: rutile or anatase -PbO2-type (space group: ) baddeleyite type (space group: ) orthorhombic structure (OI, space group: ) cotunnite type (OII, space group: ).OI ; Anatase_70 Critical pressures of transitions between two successive phases are found to be strongly dependent on the size of the sample and the experimental temperature.Amorphization_unusual ; Anatase_Size1 Generally, at room temperature, the critical pressure of the transition from rutile (anatase) to -PbO2-type phase is located in the region between 2.6 and 10 GPa (2.5 and 7 GPa).Boundary ; alpha_PbO2_TS1 ; Anatase_Size2 ; Anatase_TS ; Anatase_Size1 Interestingly, it was found that all the high pressure phases recover to the -PbO2-type phase rather than the initial rutile or anatase phase upon decompression to ambient conditions.TiO2_23
Since the -PbO2-type phase plays a bridging role in connecting the ambient TiO2 phase and the higher pressure phases, a number of studies have been carried out on phase transformations involving the -PbO2-type phase, such as rutile(anatase) -PbO2Boundary ; Anatase_Shock and -PbO2 baddeleyite.TiO2_23 ; alpha_PbO2_TS2 ; baddeleyite_laser Among these, the mechanism for transition from the rutile phase to the -PbO2-type phase has been well understood, and it can be described by the 1/2[01] shear of every other hexagonal close-packed (hcp) plane (011) of the rutile phase.alpha_PbO2_TS1 A soft phonon mode () with a negative pressure derivative was found in the vibrational frequenciesStrained_rutile which is crucial to drive the initial structure to a CaCl2-type intermediate structure during this transition.Pathways ; Rutile_Cacl2 A similar mechanism was proposed by Sekiya for the anatase to -PbO2 phase transition.Anatase_TS In this case, a soft mode() observed around 200 cm-1 in the Raman spectra was suggested to be closely related to the phase transition. However, for the subsequent -PbO2 baddeleyite phase transition, the understanding of which should form the basis of investigating the transitions of TiO2 to the higher pressure phases (OI and OII), no phonon softening was observed, and the mechanism of this displacive phase transition has not been reported.
In this study, we carry out density functional perturbation theory (DFPT) calculations to investigate the dielectric property and Born effective charge tensor of -PbO2-type TiO2. In addition, we study its lattice dynamical properties and their variations with pressure to identify soft phonon modes associated with pressure induced structural instability. The Raman intensity is calculated and presented for pressure from 0 to 10 GPa and compared with the experimental spectrum. The symmetry assignments of the Raman peaks for -PbO2-type TiO2 are given for the first time. In contrast to the Raman active soft modes of rutile and anatase phases, two IR active soft phonon modes ( and ) with frequencies around 200 cm-1 are identified for the -PbO2-type phase. Based on the analysis of the two soft modes, we conclude that the Ti3O triangular complex and the Ti2O2Ti2 complex are the relevant structural units for understanding the phase transformation of -PbO2-type TiO2 baddeleyite TiO2.
II METHODS
All calculations were carried out using the CASTEP code CASTEP_1 ; CASTEP_2 with the Ceperley-Alder local density functional approximation.CA_LDA Brillouin zone integration was performed using the Monkhorst-Pack k-point samplingMK with and grids for -PbO2-type and baddeleyite phases, respectively. Norm-conserving pseudopotentialsNorm-conserving were generated by the Opium packageOPIUM and employed throughout the study. For Ti atom, the pseudopotential was constructed to include the and orbitals as semi-core states. The core radii for the pseudo wavefunctions were tuned to be 1.35 (), 1.35 (), 1.45 (), and 1.35 () a.u. to ensure a good transferability of the potentials. For O atom, the values are 1.4 a.u. for all the , and valence states. The structures were relaxed until the forces exerted on the atoms are less than 0.01 eV/Å, and the stress exerted on the cell is less than 0.02 GPa.
The vibrational frequencies at the point, the transverse-optical/longitudinal-optical (TO/LO) splitting of the zone center optical modes, Raman spectra, and dielectric properties were calculated using the density functional perturbation theory.DFPT Before calculations were carried out for the -PbO2 and baddeleyite phases, phonon spectrum of rutile TiO2 was calculated and compared with available resultsStrained_rutile . It was found that for the chosen pseudopotentials, a plane-wave cutoff of 980 eV was sufficient to obtain reliable frequencies of the modes and this cutoff was used in subsequent calculations.
To obtain the phonon dispersion curves of -PbO2-type TiO2, we first calculated the dynamical matrix based on a grid of points, with a (1/4,1/4,1/4) shift to include the point, using the density functional perturbation theory. The Fourier interpolation scheme was used to generate the dynamic matrix at an arbitrary point based on the aperiodic force constant matrix in real space produced by the cumulant sum method.Cumulant_sum The long-range dipole-dipole interaction was also taken into account by using the calculated anisotropic Born effective charge tensor and dielectric tensor.
III RESULTS
III.1 Structure of -PbO2-type TiO2
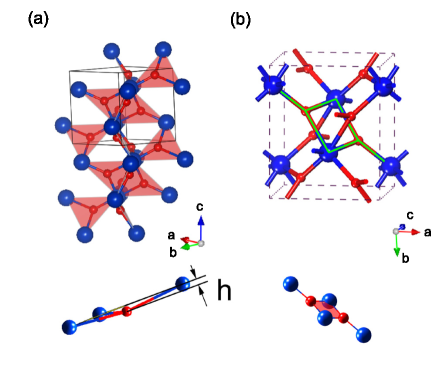
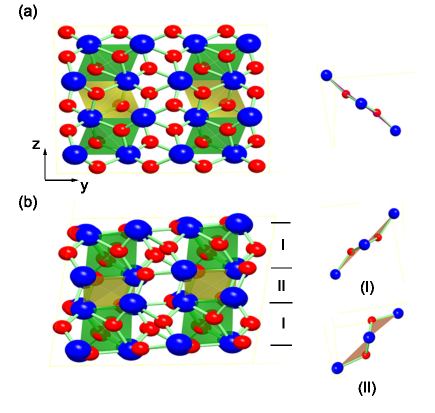
Since both the vibrational properties and phase transition of a compound are closely related to its atomic structure, we present first calculated structural information of the -PbO2-type phase. The relaxed lattice parameters and atomic positions at zero pressure are given in Table I and are compared with available experimental values. The unit cell of -PbO2-type TiO2 contains four formula units with four equivalent Ti atoms and eight equivalent O atoms. As shown in Fig. 1, each Ti atom is surrounded by 6 adjacent oxygen atoms with a coordination number (CN) of 6. The O atom is bonded with three Ti atoms forming an approximately “Y”-shaped Ti3O triangular complex, and two Ti3O complexes further form a Ti2O2Ti2 complex (Fig. 1b) through sharing a Ti2 edge, similar to the case of rutile TiO2. There are four Ti2O2Ti2 complexes in each unit cell. The centers of the four Ti2O2Ti2 complexes are located at a corner (0,0,0), the center (1/2,1/2,1/2), an edge (0,0,1/2), and a face center (1/2,1/2,0) of the cubic unit cell, respectively, which are the four inversion centers of the unit cell. In contrast to rutile phase where Ti and O atoms forming the Ti2O2Ti2 complex are all in the same plane, the Ti3O and Ti2O2Ti2 complexes in the -PbO2 phase adopt a nonplanar structure. The two O atoms in the Ti2O2Ti2 complex appear on opposite sides of the plane defined by the four Ti atoms (Ti4 plane). The formation of these nonplaner Ti3O complexes can be understood from the atomic relaxation driven by the soft phonon mode in the rutile phase under pressure. Pathways ; Rutile_Cacl2 These Ti3O and Ti2O2Ti2 complexes in the -PbO2 phase play important roles in the analysis of Born effective charges and the description of -PbO2 baddeleyite structural transformation which will be discussed in the following sections.
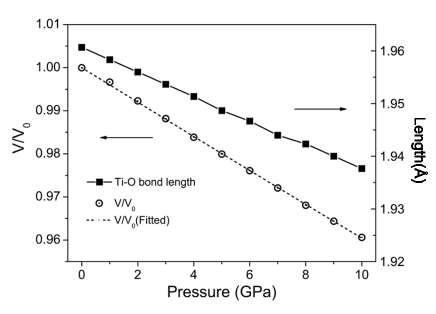
The pressure induced structural modifications, including lattice parameters and atomic positions are calculated and results for GPa are presented in Table I. The distance() of O atom from the Ti3 plane increases from 0.170 Å at 0 GPa to 0.195 Å at 10 GPa. The variations of , where is the volume at a given pressure and is the volume at GPa, and the average Ti-O bond length with pressure are shown in Fig. 2. A linear decrease are seen for both quantities. The bulk modulus () and its pressure derivative are determined through fitting of to the Birch-Murnaghan equation:Birch-Murnaghan
The fitted values of and are 248.6 GPa and 7.9, respectively. The bulk modulus obtained here is in good agreement with the experimental value of GPa.Laseralpha_PbO2
| 0 GPa | 10 GPa | |
|---|---|---|
| [a,b,c] | [4.531, 5.465, 4.870] | [4.487, 5.374, 4.804] |
| [4.531, 5.501, 4.906]Grey | ||
| [4.61, 5.43, 4.87]Laseralpha_PbO2 | ||
| Ti | (0, 0.176, 0.25) | (0, 0.179, 0.25) |
| (0, 0.170, 0.25)Grey | ||
| O | (0.272, 0.384, 0.419) | (0.270, 0.389, 0.422) |
| (0.272, 0.381, 0.414)Grey | ||
| Density | 4.401 | 4.581 |
| 4.336Simons |
III.2 Born effective charges and dielectric tensors of -PbO2-type TiO2
Born effective charge (BEC) tensor quantifies macroscopic electric response of a crystal to the internal displacements of its atoms.Cai The calculated Born effective charges of the -PbO2-type TiO2 are given in Table II. It is known that BEC can be strongly influenced by the local environment of each atom, and the form and the number of independent elements in the BEC tensors are determined by the local atomic symmetry. Since -PbO2-type possesses lower symmetry compared to rutile and anatase phases, the number of independent components in BEC tensors of Ti and O atoms in -PbO2-type TiO2 is much larger than those of rutile and anatase phases.BEC ; anatase_phonon In addition, in -PbO2-type phase, since the Ti atoms occupy positions of higher local symmetry () than O atoms (), the number of independent elements in the BEC tensor for Ti atom is smaller than that of O atom.
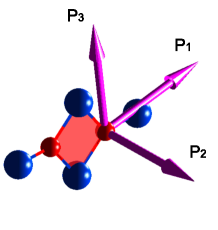
The principal directions of the Born effective charge tensor of the O atom are shown in Fig. 3, and the three principal values are . The component in direction is much smaller than the nominal ionic charge of the O ion . The Born effective charge tensor of the O atom is strongly anisotropic with the absolute values of and much larger than that of . This behavior arises from the bonding structure of O atom in the Ti3O complex. Each O atom in the Ti3O complex is bonded to three adjacent Ti atoms by forming -like bonds. Therefore, the polarizations along the and directions are more sensitive to the displacement of O in the Ti3 plane, compared to that in the normal direction (). Since the Ti3O complex in the -PbO2 phase has a similar structure as the Ti3O unit in the rutile case, the principal values of Born effective charge tensor for the O atom are comparable to the values of the O atom in rutile phase.BEC
| Born effective charge tensors | Dielectric tensors | ||
|---|---|---|---|
| Ti: | |||
| O: | |||
The calculated electronic () and static () dielectric tensors are also given in Table II. The dielectric tensors are usually overestimated in local density approximation (LDA) calculations due to the underestimation of the band gap. However, application of the scissors correction has previously been found to improve the agreement with experimental data for both rutile and anatase cases.anatase_phonon In this study, however, the dielectric tensors are calculated without the scissors correction. Compared with the previous predictionsanatase_phonon ; rutile_dielectric without scissor correction for rutile and anatase phase, we find that the electronic dielectric constant in the -PbO2 phase is slightly smaller than those of rutile but larger than the values of the anatase phase, which may be attributed to a more similar structure between -PbO2 phase and rutile phase as shown in the Ti2O2Ti2 unit in both phases.
III.3 Phonons of -PbO2-type TiO2
Since the primitive cell of -PbO2-type TiO2 contains 12 atoms, there are a total of 36 modes of vibration. The factor group analysis shows that the long wavelength optic phonon modes at the point can be decomposed as
All the phonon modes are non-degenerate. The , , modes are IR active, whereas the , , and modes are Raman active and the modes are silent. The Raman and IR modes are mutually exclusive due to the presence of inversion symmetry in the crystal.
| IR/Silent | (TO/LO) | Raman | |||
|---|---|---|---|---|---|
| B3g | 154.8 | 0.67 | |||
| IR | Ag | 164.3 | 0.13 | ||
| 197.4/229.9 | -2.61 | B1g | 180.1 | 1.71 | |
| 205.9/267.3 | -0.53 | B3g | 215.3 | 0.07 | |
| 253.9/360.1 | 3.62 | B1g | 286.5 | -0.20 | |
| 280.5/286.3 | -0.06 | Ag | 295.5 | -0.42 | |
| 301.7/368.0 | 0.54 | B1g | 309.4 | 1.18 | |
| 371.3/477.1 | 5.97 | B2g | 344.6 | 1.00 | |
| 421.3/653.4 | 2.74 | B3g | 388.1 | 2.67 | |
| 427.2/527.8 | 3.14 | B2g | 404.6 | 1.75 | |
| 483.1/838.7 | 4.43 | Ag | 431.9 | 2.60 | |
| 556.5/809.7 | 3.78 | B1g | 445.0 | 4.53 | |
| 701.0/788.5 | 3.54 | B3g | 457.5 | 2.60 | |
| B3g | 154.8 | 0.67 | |||
| Silent | Ag | 548.4 | 5.06 | ||
| 303.3 | -0.16 | B1g | 576.3 | 5.35 | |
| 527.2 | 5.00 | B3g | 624.7 | 4.69 | |
| 630.6 | 4.00 | B2g | 813.0 | 3.83 |
The calculated vibrational frequencies of the Raman modes, IR TO/LO modes and the silent modes, as well as their pressure dependence () are summarized in Table III. Here is obtained through a linear fitting of data between 0 and 10 GPa, which can be further used to generate the Grüneisen parameter for each mode. An average value of 2.29 cm-1GPa-1 is obtained for of the Raman modes.
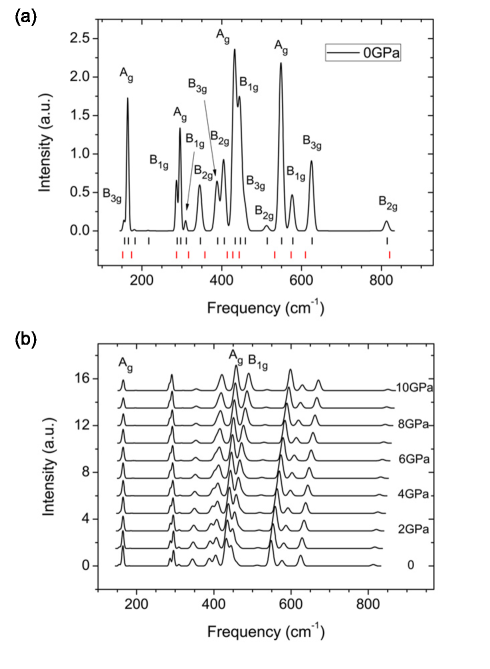
To enable a comparison with the experimental results, we calculated Raman spectrum of -PbO2-type TiO2. The spectrum at 0 GPa is shown in Fig. 4a. The calculated frequencies of Raman active modes in this work and the experimental values by Mammone et al.TiO2_23 are indicated by the black and red lines at the bottom of the figure, respectively. By comparing the calculated and the experimental Raman spectra, we conclude that the frequencies at 150 and 172 cm-1 observed experimentallyTiO2_23 can be assigned to the (154.8 cm-1) and (164.3 cm-1) modes, respectively. These assignments are further supported by the calculated high pressure Raman spectra shown in Fig. 4b. The gradual overlap of the positions and the decrease in the intensities of the two peaks at high pressures are consistent with the trends observed in the experiment. Particularly, the disappearance of the peak (172 cm-1) observed in the experimental Raman spectra was used as an indicator of the occurrence of the phase transition from the -PbO2-type TiO2 to baddeleyite phase. In addition, the splitting of the two peaks around 450 cm-1 ( and ) and the significantly stiffening of three peaks above 500 cm-1 at high pressures were also clearly recorded in the experiments.TiO2_23 ; Phase_Coexistence It should be noted that, both the calculated and experimental Raman spectra show no soft modes with significant negative derivatives of pressure, as the () mode in high pressure Raman spectrum of deformed rutile (anatase) phase. Strained_rutile ; Anatase_TS
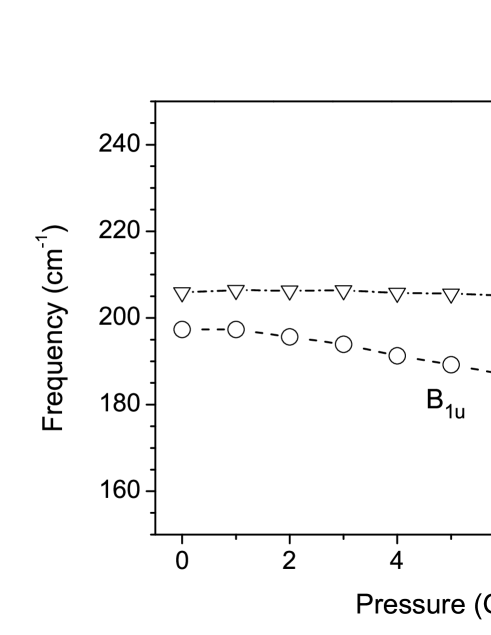
However, the two lowest IR active modes, at 197.4 cm-1 and at 205.9 cm-1, respectively, show large negative pressure derivatives as seen in Table III. Although several Raman and silent modes show similar negative-pressure derivatives, those of the two IR modes are much more stronger. These anomalously negative-pressure derivatives suggest a strong softening mechanism which can be correlated to atomic displacements in the structure under pressure and lattice instability. The frequencies of the two IR-active soft TO modes are shown in Fig. 5 as functions of pressure. A nonlinear dependence of the frequencies on pressure is clearly seen.
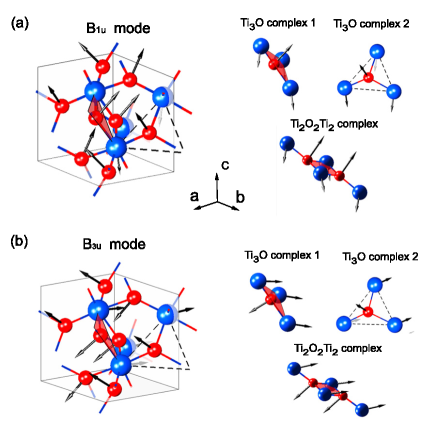
The eigenvectors of the two soft modes and are shown in Fig. 6. The vibration patterns can be analyzed based on the Ti2O2Ti2 complex consisting of two Ti3O complexes through sharing a Ti2 edge as shown in the Fig. 1. The atomic vibrating patterns of the Ti3O(Ti3O-I and Ti3O-II) and Ti2O2Ti2 complexes are shown in the left part of the figure. The vertical movement of the oxygen atom out of the plane formed by the titanium atoms can be clearly observed. On the other hand, the oddness character(denoted by “” subscript) of and under inversion requires that those atoms connecting with each other through the inversion symmetry operation have the same vibration components. Thus the two edge Ti atoms, connected with inversion operation, vibrate in phase but slightly deviate with the vibrating direction of the two end Ti atoms in the Ti2O2Ti2 unit. Similarly, the two oxygen atoms locating on the two sides of the Ti4 plane also have the same vibrating component and they vibrate vertically to the Ti3 plane.
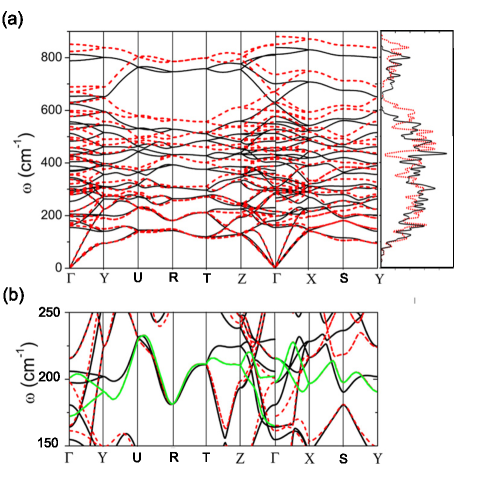
To find out whether there exists any other soft phonon modes, we calculated the phonon dispersion curves and the vibration density of states (DOS) of the -PbO2-type phase at 0 GPa and 10 GPa, respectively. As shown in Fig. 7a, a significant shift of the spectrum towards the high frequency side is seen at frequencies above 300 cm-1 which is consistent with the larger pressure dependence of the high frequency phonon modes given in Table III. Fig. 7b shows details in the region between 150 and 250 cm-1. These branches are related to the soft and modes. It is clear that in addition to the point, frequencies of the modes along the -,-,- and parts of -, -, -, - also decrease at high pressure.
III.4 Structure and Phonons of baddeleyite TiO2
The atomic structure of the baddeleyite TiO2 (monoclinic) is illustrated in Fig. 8. The CN of Ti atom in this structure is 7, compared to 6 in -PbO2-type TiO2. All Ti atoms are equivalent and occupy the Wyckoff sites, but the 8 oxygen atoms can be divided into two inequivalent groups, OI and OII, which occupy two sets of Wyckoff sites respectively. A structure similar to the Ti2O2Ti2 complex in -PbO2 phase also exists in baddeleyite TiO2, as shown in Fig. 8. However, in baddeleyite TiO2, there are two types of Ti2O2Ti2 complexes, termed as Ti2O2Ti2-I and Ti2O2Ti2-II, respectively, depending on the type of oxygen (OI or OII) involved. The distances from the oxygen atoms to the Ti4 plane in the two types of Ti2O2Ti2 complexes are different. Using the experimental lattice parameters of Å, Å, and Å,baddeleyite_structure the OI and OII atoms in the relaxed structures are 0.358 Å and 0.940 Å from the Ti4 plane, both being much larger than the corresponding value of 0.12 Å in the -PbO2-type TiO2 at zero pressure.
Finally, the calculated phonon frequencies at the point of baddeleyite TiO2 are listed in Table IV. Fifteen IR active (8+7) and eighteen Raman active (9+9) modes are expected for baddeleyite phase from the factor group analysis.
| IR/Raman | Frequency(cm-1) |
|---|---|
| (TO/LO) | 227.9/242.8, 246.1/256.7, 331.9/332.4, |
| 384.1/404.5, 439.7/540.5, 451.6/452.3, | |
| 582.9/860.7, 733.3/736.3 | |
| (TO/LO) | 110.5/196.3, 295.8/341.1, 359.2/457.9, |
| 495.7/520.0, 529.9/560.8, 561.5/702.5, | |
| 784.7/960.0 | |
| 136.8, 217.0, 249.7, 348.7, 399.4, 427.0, | |
| 511.7, 647.3, 678.5 | |
| 189.1, 296.6, 352.8, 423.2, 430.4, 493.5, | |
| 621.7, 707.0, 814.9 |
IV DISCUSSION
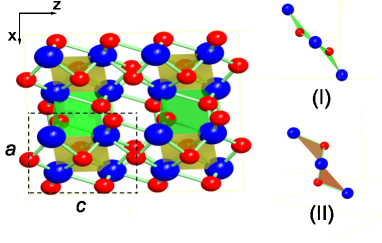
The transition from the -PbO2-type phase to the baddeleyite phase mediated through the soft phonon modes can be derived directly from the comparison of the related softening modes and the structural features of baddeleyite phase. The significant deviation of the oxygen atoms from the Ti4 plane in the Ti2O2Ti2 complex of the baddeleyite phase arises from relaxation of oxygen atoms along the directions described by the eigenvectors of the and soft modes in -PbO2 TiO2. This soft phonon mode based mechanism was further confirmed by results of our molecular dynamics (MD) simulation of the -PbO2-type TiO2 which was carried out at experimental conditions of 300 K and 37 GPa.TiO2_23 The MD simulation was implemented by the “General Utility Lattice Program”(GULP) packageGULP with a NPT ensemble using Dreiding empirical force potentialDreiding which has previously been adopted in simulations of molecular adsorption on TiO2 surface,MD_TiO2 zeolite confined Ti(OH)4 nanoparticlesZeolite and other surfactant interactions at mineral surfaces.mineral_1 The Nosé-Hoover thermostat was applied to control the temperature. It should be noted that the initial velocities, which were produced randomly with probabilities based on Gaussian distribution, are not related to the mode direction of and soft modes. The initial structure and the snapshot of a representative intermediate structure of -PbO2-type TiO2 are shown in Fig. 9.note Strong distortions in the lattice and out-of-plane displacement of the oxygen atoms can be observed. The single type of Ti2O2Ti2 complex in the -PbO2 phase evolves into two types (I and II) which are similar to those in the baddeleyite structure given in Fig. 8. The relaxation of the Ti2O2Ti2 complex which shows characteristic features of the or soft phonon induces significant shear deformation in the - plane. It should be pointed out that a complete structural transformation from the -PbO2 phase to the baddeleyite phase was not observed in this simulation. This is due to constraints of the supercell () and possible high potential barrier along the pathway. Nevertheless, result of the molecular dynamics simulation does indicate that the local atomic displacements are closely related to the and soft modes at the point.
In this study, the structural difference between the -PbO2-type and the baddeleyite phases is analyzed based on the basic building units Ti3O and Ti2O2Ti2 complexes, in contrast to the commonly used TiO6 octahedra.Octahedra_1 ; Octahedra_2 One clear advantage of using Ti3O and Ti2O2Ti2 as the basic units is in the description of the and soft modes of the -PbO2-type phase, and the correlation between the phase transition and the out-of-plane displacements of the oxygen atoms in these soft modes. As a matter of fact, such soft modes not only dictate phase transition initiated from the -PbO2-type phase, similar features have also been observed in the high pressure phase transitions originating from rutile and anatase phases of TiO2. The soft mode in rutile phase and the soft mode in anatase phase can be described similarly in terms of Ti3O and Ti2O2Ti2 complexes, where out-of-plane displacements of the oxygen atoms relative to the Ti3 plane are observed.Rutile_Cacl2 ; Raman_Anatase For instance, in the case of rutile to -PbO2 phase transition, the displacements of the O atoms associated with the mode lead to the CaCl2 structure with corrugated Ti2O2Ti2 unit chains along the [110] direction, and the final -PbO2-type structure can be achieved by a subsequently shearing in the (011) plane of the CaCl2-type structure.Rutile_Cacl2 ; Pathways ; alpha_PbO2_TS1 ; alpha_PbO2_TS2 In the anatase case, the high pressure transition to the -PbO2 phase has also been found to be closely related to the soft mode, and the gliding of anionic layers results in the transformation.Anatase_TS Thus, the instability of the Ti3O units may be regarded as a common feature of high pressure transformations of TiO2.
V CONCLUSIONS
Softening of phonon modes, which is usually an important indicator of structural instability during displacive phase transition, has previously been found in both rutile and anatase TiO2 under high pressure. However, for phase transitions originating from the -PbO2-type TiO2, no soft modes have yet been reported during high pressure transition. Using the state-of-art DFPT calculations, we show that there exist two IR-active soft phonon modes ( and ) around 200 cm-1 which are absent in the high pressure Raman spectrum. These two modes play an important role in understanding the atomic displacements in -PbO2-type TiO2 and transformation to baddeleyite polymorph. In addition to zone-center frequencies, the changes in phonon dispersions with pressure indicate that significant softening also occurs in the zone-boundary modes, which suggests that gliding of layers in -PbO2-type TiO2 is likely to occur during the -PbO2-type TiO2 phase transition. Furthermore, the symmetry assignments of the Raman peaks for -PbO2-type TiO2 are given for the first time. Since there is usually a coexistence of different phases during the process of high pressure phase transitions, the calculated Raman spectrum and its change with pressure are valuable for experimentalist to identify the onset of phase transition related to the -PbO2-type phase.
Acknowledgement: Computations were performed at the Centre for Computational Science and Engineering(CCSE) and High Performance Computing Centre at NUS.
References
- (1) A.-M. Flank, P. Lagarde, J.-P. Itié, A. Polian, and G. R. Hearne, Phys. Rev. B 77, 224112 (2008).
- (2) D. Machon, M. Daniel, V. Pischedda, S. Daniele, P. Bouvier, and S. LeFloch, Phys. Rev. B 82, 140102(R) (2010).
- (3) M. Giarola, A. Sanson, F. Monti, G. Mariotto, M. Bettinelli, A. Speghini, and G. Salviulo, Phys. Rev. B 81, 174305 (2010).
- (4) T. Arlt, M. Bermejo, M. A. Blanco, L. Gerward, J. Z. Jiang, J. S. Olsen, and J. M. Recio, Phys. Rev. B 61, 14414 (2000).
- (5) Y. Al-Khatatbeh, K. K. M. Lee, and B. Kiefer, Phys. Rev. B 79, 134114 (2009).
- (6) V. Swamy, A. Kuznetsov, L. S. Dubrovinsky, R. A. Caruso, D. G. Shchukin, and B. C. Muddle, Phys. Rev. B 71, 184302 (2005).
- (7) V. Swamy and B. C. Muddle, Phys. Rev. Lett. 98, 035502 (2007).
- (8) R. Ahuja, and L. S. Dubrovinsky, J. Phys. Condens. Matter 14, 10995 (2002).
- (9) M.-Y. Kuo, C.-L. Chen, C.-Y. Hua, H.-C. Yang, and P. Shen, J. Phys. Chem. B 109, 8693 (2005).
- (10) N. A. Dubrovinskaia, L. S. Dubrovinsky, R. Ahuja, V. B. Prokopenko, V. Dmitriev, H.-P. Weber, J. M. Osorio-Guillen, and B. Johansson, Phys. Rev. Lett. 87, 275501 (2001).
- (11) K. Lagarec and S. Desgreniers, Solid State Commun. 94, 519 (1995).
- (12) V. Swamy, A. Y. Kuznetsov, L. S. Dubrovinsky, A. Kurnosov, and V. B. Prakapenka, Phys. Rev. Lett. 103, 075505 (2009).
- (13) G. R. Hearne, J. Zhao, A. M. Dawe, V. Pischedda, M. Maaza, M. K. Nieuwoudt, P. Kibasomba, O. Nemraoui, J. D. Comins, and M. J. Witcomb, Phys. Rev. B 70, 134102 (2004).
- (14) J. S. Olsen, L. Gerward, J. Z. Jiang, J. Phys. Chem. Solids 60, 229 (1999).
- (15) S.-L. Hwang, P. Shen, H.-T. Chu, T.-F. Yui, Science 288, 321 (2000).
- (16) T. Sekiya, S. Ohta, S. Kamei, M. Hanakawa, and S. Kurita, J. Phys. Chem. Solids 62, 717 (2001).
- (17) J. F. Mammone, M. Nicol, and S. K. Sharma, J. Phys. Chem. Solids 42, 379 (1981).
- (18) Y. M. Shul’ga, D. V. Matyushenko, A. A. Golyshev, D. V. Shakhrai, A. M. Molodets, E. N. Kabachkov, E. N. Kurkin, and I. A. Domashnev, Tech. Phys. Lett. 36, 841 (2010).
- (19) D. W. Meng, X. L. Wu, F. Sun, L. W. Huang, F. Liu, Y. J. Han, J. P. Zheng, X. Meng, and R. Mason, Micron 39, 280 (2008).
- (20) S.-Y. Chen, and P. Shen, Jpn. J. Appl. Phys. 43, 1519 (2004).
- (21) P. D. Mitev, K. Hermansson, B. Montanari, and K. Refson, Phys. Rev. B 81, 134303 (2010).
- (22) A. G. Christy, Acta Cryst. B 49, 987 (1993).
- (23) L. Nagel and M. O’Keeffe, Mat. Res. Bull. Vol. 6, 1317 (1971).
- (24) M. D. Segall, P. J. D. Lindan, M. J. Probert, C. J. Pickard, P. J. Hasnip, S. J. Clark, and M. C. Payne, J. Phys.: Condens. Matter 14, 2717 (2002).
- (25) G. J. Ackland, M. C. Warren, and S. J. Clark, J. Phys.: Condens.Matter 9, 7861 (1997).
- (26) D. M. Ceperley and B. J. Alder, Phys. Rev. Lett. 45, 566 (1980).
- (27) H. J. Monkhorst and J. D. Pack, Phys. Rev. B 13, 5188 (1976).
- (28) D. R. Hamann, M. Schlüter, and C. Chiang, Phys. Rev. Lett. 43, 1494 (1979).
- (29) Opium pseudopotential package http://opium.sourceforge.net.
- (30) S. Baroni, S. de Gironcoli, A. Dal Corso, and P. Giannozzi, Rev. Mod. Phys. 73, 515 (2001).
- (31) K. Parlinski, Z-. Q. Li, and Y. Kawazoe, Phys. Rev. Lett. 78, 4063 (1997).
- (32) F. J. Birch, Appl. Phys. 9, 279 (1938); Phys. Rev. 71, 809 (1947).
- (33) S.-Y. Chen and P. Shen, Phys. Rev. Lett. 89, 096106 (2002).
- (34) I. E. Grey, C. Li, I. C. Madsen, and G. Braunshausen, Mater. Res. Bull. 23, 743 (1988).
- (35) P. Y. Simons, F. Dachille, Acta Crystallogr. 23, 334 (1967).
- (36) Y. Cai, L. Zhang, Q. Zeng, L. Cheng, and Y. Xu, Phys. Rev. B 74, 174301 (2006).
- (37) G. Cangiani, A. Baldereschi, M. Posternak, and H. Krakauer, Phys. Rev. B 69, 121101(R) (2004).
- (38) M. Mikami, S. Nakamura, O. Kitao and H. Arakawa, Phys. Rev. B 66, 155213 (2002).
- (39) C. Lee, P. Ghosez, and X. Gonze, Phys. Rev. B 50, 13379 (1994).
- (40) H. Arashi, J. Phys. Chem. Solids 53, 355 (1992).
- (41) H. Sato, S. Endo, M. Sugiyama, T.Kikegawa , O. Shimomura, and K. Kusaba, Science 251, 786 (1991).
- (42) J. Gale, J. Chem. Soc., Faraday Trans. 93, 629 (1997).
- (43) S. L. Mayo, B. D. Olafson, W. A. Goddard III, J. Phys. Chem. 94, 8897 (1990).
- (44) S.Hamad, J. R. S. Valencia, A. Barranco, J. A. Mejias, A. R. González-Elipe, Mol. Simul. 35, 1140 (2009).
- (45) I. Halasz, J-. J. Liang, G. Fitzgerald, Catal Lett. 141, 948 (2011).
- (46) H. Du, and J. D. Miller, Langmuir 23, 11587 (2007).
- (47) Supplementary imformation for animation of this molecular dynamics simulation is provided.
- (48) A. F. Wells, Structural Inorganic Chemistry (Clarendon Press, Oxford, 1975), p. 200.
- (49) L. Pauling, The Nature of the Chemical Bond (Cornell University Press, Ithaca, 1980), p. 559.
- (50) T. Ohsaka, F. Izumi, and Y. Fujiki, J. Raman Spectrosc. 7, 321 (1978).