The Extreme Overabundance of Molybdenum in Two Metal-Poor Stars
Abstract
We report determinations of the molybdenum abundances in five mildly to extremely metal-poor turnoff stars using five Mo II lines near 2000 Å. In two of the stars, the abundance of molybdenum is found to be extremely enhanced, as high or higher than the neighboring even- elements ruthenium and zirconium. Of the several nucleosynthesis scenarios envisioned for the production of nuclei in this mass range in the oldest stars, a high-entropy wind acting in a core-collapse supernova seems uniquely capable of the twin aspects of a high molybdenum overproduction confined to a narrow mass range. Whatever the details of the nucleosynthesis mechanism, however, this unusual excess suggests that very few individual nucleosynthesis events were responsible for the synthesis of the light trans-Fe heavy elements in these cases, an unexpected result given that both are only moderately metal-poor.
1. Introduction
The relative abundances of elements heavier than iron in low-mass stars of low iron abundance bear silent witness to the exploding massive stars in which their metal content was created. Because old massive stars have long since evolved, their solar-mass counterparts are the only surviving stellar relics in which these events have been recorded. Their heavy-element abundance distributions, reviewed by Sneden et al. (2008), can yield critical diagnostics of the objects and environments that formed the material, and the sequences of events that resulted in the buildup of the halo and disk of our Galaxy.
In single stars of metallicity below one-thirtieth solar, [Fe/H] 1.5, the heavy elements from barium ( = 56) onward owe their existence to the r-process (rapid neutron capture on seed iron nuclei). Their proportions with respect to one another are the same in all metal-poor stars, despite the wide range of two orders of magnitude observed in their overall abundance with respect to iron. The most probable r-process site is Type II supernovae, whose progenitors are short-lived massive stars. In more metal-rich single stars, [Fe/H] 1.5, elements begin to appear that are created by the s-process (slow neutron capture), in pulsations in intermediate-mass asymptotic giant branch (AGB) stars. The AGB evolutionary time of a few 100 Myr suggests a time delay of this order in star formation at and above this metallicity.
More complex is the origin of the lightest trans-Fe elements gallium through cadmium ( = 31 to 48). These elements have been attributed in varying degrees to the p-process (proton capture; Burbidge et al., 1957; Arnould, 1976; Woosley & Howard, 1978), a “weak” s-process (Clayton, 1968; Kappeler et al., 1989), a “weak” r-process (Seeger et al., 1965; Cowan et al., 1991), a specific “LEPP” (light element primary process; Travaglio et al., 2004) such as the p process of Fröhlich et al. (2006), and/or the low-entropy domain of a neutrino wind above the neutron star formed in a Type II supernova (e.g. Freiburghaus et al., 1999).
In this paper, we establish and discuss the abundances of the two light trans-Fe elements molybdenum and ruthenium (Mo, Ru; = 42, 44) in five metal-poor stars whose enhancements of heavy r-process elements are mild. In two of the five stars, HD 94028 and HD 160617, the molybdenum abundance is extremely elevated, with important ramifications for the synthesis process and the number of synthesis events contributing to the light trans-Fe elemental abundances.
2. Current Observational Constraints on Light Trans-Fe Elements
As reviewed by Lodders (2010), stringent constraints of nucleosynthesis models are derived from isotopic abundances of meteorites (e.g. Pellin et al., 2006). These reflect the integral of the products of all processes incorporated into the pre-solar nebula – a single detailed example in space and time.
Isotopes of the light trans-Fe elements have proven to be among the most difficult to reproduce. Molybdenum is especially problematical; its solar-system p-process isotopic fraction of 25% is larger than that of any other trans-Fe element (Lodders, 2010). This is a stumbling block for models invoking the s-process in low-mass AGB stars (e.g. Lugaro et al., 2003). Such a scenario is unlikely to apply in any case to the low-metallicity stars of the halo, as it relies on the pre-existence of AGB stars of solar metallicity and also of quite low mass, 1.5 M☉, with accordingly long main-sequence lifetimes. In contrast, Hoffman et al. (1996) succeeded in directly producing light p-process nuclei with specific choices of entropy and electron fraction in a neutrino-driven wind. They noted that this is a primary process, one in which “the r-process and some light p-process nuclei may be coproduced.”
Recently, Farouqi et al. (2009) reproduced all seven of the solar isotopes of molybdenum by selecting models from a parameterized grid of calculations based on a high-entropy wind (HEW) operating in Type II supernovae. They find it “can co-produce the light p-, s-, and r-process isotopes between Zn ( = 30) and Ru ( = 44) at electron abundances in the range 0.450 0.498 and low entropies of 100 – 150. Under these conditions, the light trans-Fe elements are produced in a charged-particle (-) process, including all p-nuclei up to 96,98Ru. In our model, no initial SS [solar system], s- or r-process seed composition is invoked; hence, this nucleosynthesis component is primary.” In part because “the overall yields of the light trans-Fe elements decrease with increasing ”, they conclude that “more quantitative answers to questions concerning the astrophysical site of the compositions of the LEPP elements between Sr ( = 38) and Cd ( = 48), as well as all of the n-capture elements, will require more and higher quality observational data and also more realistic values of entropy superpositions derived from hydrodynamical models.”
Abundances of lighter and heavier elements in metal-poor stars are already providing further constraints. Roederer et al. (2010a) derived abundances for zinc, yttrium, lanthanum, europium, and lead (Zn, Y, La, Eu, and Pb; = 30, 39, 57, 63, and 82) in 161 metal-poor stars with [Fe/H] 1.4. Based on models of the s-process in AGB stars, they used [Pb/Fe] to identify stars with no discernible s-process contribution, and concluded that s-process elements were largely absent from progenitor material at these low metallicities. Because a scatter remained in [La/Fe] in those stars with relatively low r-process content, they confirmed the result emphasized earlier by Honda et al. (2007), that the ratio of light r-process to heavy r-process elements varies widely among metal-poor stars. Roederer et al. (2010a) also confirmed an anti-correlation between Y/Eu and Eu/Fe (François et al., 2007), and showed that Y production was decoupled from both Zn and Fe. They were able to reproduce the range of Y/Eu ratios with simulations of HEW models that explore the effects of a range of entropies (Farouqi et al., 2010).
For molybdenum itself, previous abundance determinations in metal-poor stars are restricted to giants and subgiants, in which near-UV and optical Mo I lines are detectable. Except for giants with extreme r-process enhancements (e.g. Sneden et al., 2003), published [Mo/Fe] values are all near solar. Table 1 summarizes values for [Mo/Fe], and other light trans-Fe elements where available, for eight field halo stars with [Fe/H] 1.4 and [Eu/Fe] 0.9, as an indicator of mild r-process enhancement. Of the 16 globular-cluster studies listed in Table 1 of Roederer (2011), only one presents results for Mo. In that study, for eight giants in the globular cluster M5, Lai et al. (2011) find [Fe/H] = 1.43, [Eu/Fe] = +0.49, [Zr/Fe] = +0.34, and [Mo/Fe] = 0.10, with no significant star-to-star variation. The referee adds that Yong et al. (2008) have derived [Mo/Fe] for 11 stars in M4 and two in M5, none of which has [Mo/Fe] +0.4. Since M4 has a subgroup of stars with significant s-process contribution (Fig. 1, panel 4 of Roederer, 2011), its non-s-process [Mo/Fe] upper bound may even be lower. Among the two dozen normal field and cluster giants in which molybdenum has been studied to date, then, none has [Mo/Fe] +0.4.
| Star | log g | [Fe/H] | [Eu/Fe] | [Zr/Fe] | [Nb/Fe] | [Mo/Fe] | [Ru/Fe] | [Rh/Fe] | [Pd/Fe] | [Ag/Fe] | [Cd/Fe] | ||
|---|---|---|---|---|---|---|---|---|---|---|---|---|---|
| HD 88609 | 4550 | 1.10 | 2.40 | 3.07 | 0.33 | +0.24 | 0.07 | +0.15 | +0.32 | +0.70 | +0.03 | +0.10 | … |
| HD 122563 | 4570 | 1.10 | 2.20 | 2.77 | 0.52 | 0.10 | 0.13 | 0.02 | +0.07 | +0.45 | 0.28 | 0.05 | 0.5 |
| HD 221170 | 4510 | 1.00 | 1.80 | 2.18 | +0.80 | +0.25 | +0.39 | +0.29 | +0.56 | +0.71 | +0.46 | +0.44 | … |
| BD+10 2495 | 4710 | 1.30 | 1.55 | 2.45 | +0.13 | +0.00 | +1.46 | +0.02 | … | … | … | … | … |
| BD+29 2356 | 4760 | 1.60 | 1.45 | 1.55 | +0.41 | +0.34 | +1.78 | +0.19 | … | … | … | … | … |
| BD+30 2611 | 4330 | 0.60 | 1.85 | 1.45 | +0.65 | +0.01 | … | +0.02 | … | … | … | … | … |
| HD 128279 | 5050 | 2.35 | 1.50 | 2.45 | 0.25 | 0.20 | +1.24 | +0.20 | … | … | … | … | … |
| HD 175305 | 4770 | 1.80 | 1.25 | 1.60 | +0.35 | +0.23 | +1.32 | +0.06 | … | … | … | … | … |
Note. — Units: , ; , km s-1. Atomic numbers: Eu, 63; Zr, 40; Nb, 41; Mo, 42; Ru, 44; Rh, 45; Pd, 46; Ag, 47; Cd, 48. References: HD 88609, Honda et al. (2007); HD 122563, Honda et al. (2006), except Cd, Roederer et al. (2010b); HD 221770, Ivans et al. (2006); remaining stars, Roederer et al. (2010c).
3. Stellar Spectra
In this work we provide additional support and constraints for HEW production of light trans-Fe elements, by determining the abundances of Mo and Ru in metal-poor turnoff stars from Mo II and Ru II lines near 2000Å in high-resolution spectra taken with the Space Telescope Imaging Spectrograph (STIS). Five such spectra were found in the MAST archive, the Multimission Archive at the Space Telescope Science Institute (STScI). To constrain the molybdenum abundance scale and to derive abundances for other elements, archival near-UV and optical echelle spectra were analyzed for the same stars.
Table 2 lists for each spectral region the spectra employed for each star. Reductions by others were adopted from StarCat (Ayres, 2010), the UVES pipeline111http://www.eso.org/sci/software/pipelines/, Keck HIRES archival extractions, and the UVES ground-based spectral programs of the Next Generation Spectral Library (Gregg et al., 2004). Our own reductions used the IRAF222IRAF is distributed by the National Optical Astronomy Observatories, which are operated by the Association of Universities for Research in Astronomy, Inc., under cooperative agreement with the National Science Foundation. environment. We performed bias and dark removal, coadded multiple spectral images of the same object with cosmic-ray removal, extracted orders with removal of sky and local interorder background, corrected the dispersion using Th-Ar exposures, and rectified the continuum and spliced together adjacent orders.
| Star | Wavelength(Å) | Instrument | Program | Date (UT) | Time (ks) | Reduction |
|---|---|---|---|---|---|---|
| HD 140283 | 1950 – 2300 | STIS E230H | GO 7348 | 1999-04-09 | 18.32 | StarCat uvsum2126 |
| 2378 – 2891 | STIS E230H | GO 9455 | 2002-08-22 | 5.28 | IRAF | |
| 2885 – 3147 | STIS E230H | GO 9491 | 2003-07-11,12,13,16,17,22,23,24 | 62.57 | StarCat 52831-52844 | |
| 3080 – 5953 | HIRES | U35H | 2005-03-17 | 0.60 | HiRedux | |
| HD 160617 | 1880 – 2150 | STIS 230H | GO 8197 | 1999-10-29,30; 2000-03-15,16;08-31 | 39.39 | StarCat 51480-51787 |
| 3057 – 3873 | UVES | 65.L-0507(A) | 2000-04-09 | 3.00 | Pipeline | |
| 4400 – 6780 | HIRES | H6aH | 2000-05-28 | 0.42 | Extracted | |
| HD 94028 | 1880 – 2150 | STIS 230H | GO 8197 | 2000-05-16,21,26 | 33.05 | IRAF |
| 2278 – 3120 | STIS 230M | GO 7402 | 1998-12-18 | 0.60 | IRAF | |
| 3050 – 4989 | UVES | 072.B-0585(A) | 2004-03-10 | 0.75 | NGSL | |
| HD 76932 | 1880 – 2150 | STIS 230H | GO 9804 | 2004-02-19,21 | 23.86 | StarCat 53054-53056 |
| 3022 – 4975 | UVES | 266.D-5655(A) | 2001-03-14 | 0.34 | Pipeline | |
| HD 211998 | 1880 – 2150 | STIS 230H | GO 9804 | 2004-08-26,27 | 29.40 | IRAF |
| 3040 – 10400 | UVES | 266.D-5655(A) | 2002-02-09 | 0.60 | Pipeline |
4. Synthetic Spectral Analysis
We have derived stellar parameters and abundances by matching each stellar spectral observation to theoretical spectra calculated for each star using an updated version of the SYNTHE program of Kurucz (1993b). We input a list of molecular and atomic line transitions with wavelengths, energy levels, and gf-values, and a model atmosphere characterized by effective temperature , surface gravity log g, microturbulent velocity , and logarithmic iron-to-hydrogen ratio [Fe/H] with respect to that of the Sun. Our models are interpolated in the grid of Castelli & Kurucz (2003).
The line lists are based on the Kurucz gfhy333http://kurucz.harvard.edu/LINELISTS/GFHYPER100/ atomic lines with known energy levels (“laboratory” lines), along with Kurucz diatomic molecular line lists444http://kurucz.harvard.edu/LINELISTS/LINESMOL/ and TiO lines555http://kurucz.harvard.edu/molecules/TiO/ (Schwenke, 1998). We have modified these extensively in the near-UV and optical, 2200Å – 9000Å, by matching calculations to echelle spectra of standard stars. Starting with weak-lined stars, we calculated each spectrum, adjusted gf-values singly for atomic lines and as a function of band and energy for molecular lines, and guessed identifications of “missing” lines, those present in the spectra but not in the laboratory line list, which become an extreme problem in the UV. Peterson et al. (2001) detail the procedure, and that work and Peterson (2008) show that our calculations agree well with observed optical and mid-UV spectra of nearby mildly metal-poor stars.
| Star | log g | [Fe/H] | [Eu/Fe] | [Y/Fe] | [Zr/Fe] | [Mo/Fe] | [Ru/Fe] | [La/Fe] | ||
|---|---|---|---|---|---|---|---|---|---|---|
| HD 140283 | 5700 | 3.6 | 2.6 | 1.3 | 0.9 | 0.4 | 0.1 | +0.2 | +1.0 | … |
| HD 160617 | 6000 | 3.8 | 1.8 | 1.2 | +0.6 | +0.0 | +0.4 | +0.8 | +0.6 | +0.24 |
| HD 94028 | 6050 | 4.3 | 1.4 | 1.2 | +0.3 | +0.2 | +0.5 | +1.0 | +0.7 | +0.30 |
| HD 76932 | 5900 | 4.1 | 0.9 | 1.2 | +0.4 | +0.0 | +0.2 | +0.6 | +0.4 | +0.14 |
| HD 211998 | 5300 | 3.1 | 1.5 | 1.5 | +0.2 | +0.2 | +0.5 | +0.5 | +0.5 | 0.06 |
Note. — Units: , ; , km s-1
Following these procedures, we continued the line modifications into the 2000Å region. This better defines the local continuum, especially in the two stronger-lined stars HD 76932 and HD 211998. All missing lines were simply assumed to be lines with lower excitation potential below 1 eV, as these are extremely common among the identified lines. We added these at wavelengths where the spectra of HD 76932 and HD 211998 showed absorption at the same wavelength that was not matched by any laboratory line in the Kurucz atomic line lists, even when its gf value is increased by as much as 2.5 dex.
We find stellar parameters strictly from the spectra, and not from colors. Effective temperature comes from demanding that the same abundance emerge from low- and high-excitation lines of same species (usually ). Gravity log g comes from the wings of other strong lines. Demanding no trend in abundance with line strength sets microturbulent velocity . Iron abundance [Fe/H] follows by matching relatively unblended weak lines, as do the abundances of other elements. The resulting uncertainties are typically 0.1 – 0.2 dex in [X/Fe] for element X, if represented by at least three lines whose blending, if any, is reliably modeled, and whose gf-values are well-determined. Comparing and abundances confirms or refines gravity, and the wings of the Balmer lines confirm . These agree with other diagnostics only when convective overshoot is turned off, as is true of the Castelli & Kurucz (2003) models but not those of Kurucz (1993a). Table 3 lists the resulting stellar model parameters and abundances.
Figures 1 and 2 compare the calculations based on these parameters to the observations around selected Mo and Ru lines. Figure 1 extends the region surrounding each line, to indicate the overall goodness of fit and the choice of continuum placement. Figure 2 expands the scale in the vicinity of each line, to portray the effect of a 0.3 change in abundance of the element in question.
5. Molybdenum and Ruthenium Abundances
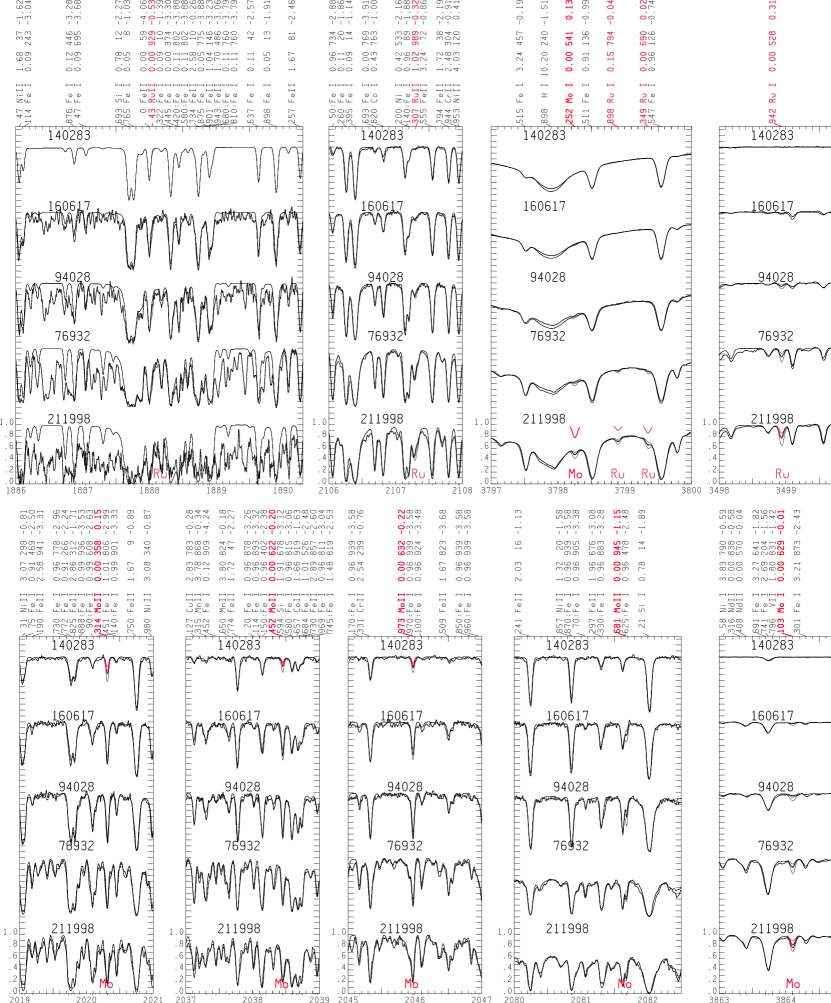
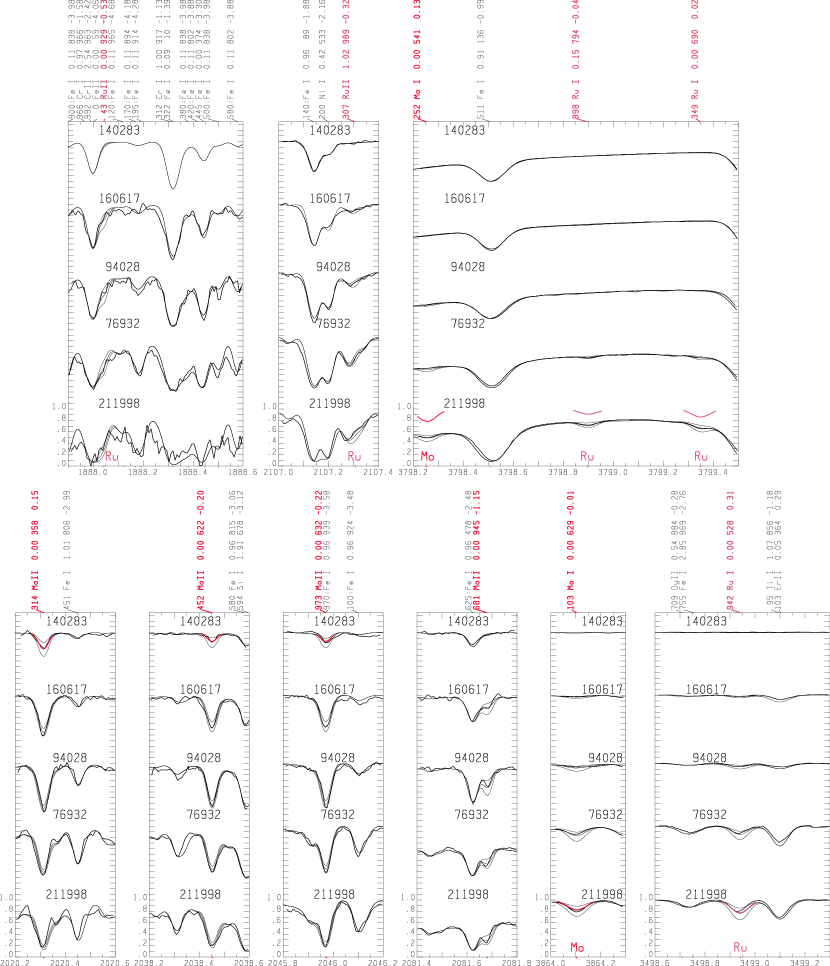
As seen in these figures, the calculated spectra match the fitted spectra quite well. However, the abundance determinations are affected by systematic errors, due to the uncertainties in continuum placement and in gf-values. These are difficult to judge.
Continuum placement is affected by line absorption, whose modeling depends on gf-value adjustment and on correct assignment of the wavelength, species, and lower excitation potential of missing lines. The number of missing lines grows dramatically toward the UV, and consequently the continuum becomes less well defined below 2000Å, even for the weak-lined star HD 160617. This is illustrated in the top left panel in Fig. 1. Line-strength adjustment was attempted only over 1887.6Å – 1889.0Å, as spectral data are currently lacking for the weakest-lined star HD 140283, and many significant lines are missing. The latter shortcoming is likely to be alleviated by revising the input line list to include recent recalculations by Kurucz (2011), posted on the Kurucz web site in April 2011, which include ten times as many lines of Mg, Si, Ca, and the iron-peak elements.
Their inclusion might change the Ru abundances of HD 160617 and HD 94028 by up to 0.3 dex. While the blending of the Ru II line itself can be modeled primarily with identified lines, if missing lines are also present but currently unrecognized, the currently inferred ruthenium abundance may be overestimated. However, if there are more missing lines in the adjacent regions used to set the continuum, its level is underestimated, and the inferred ruthenium abundance may be underestimated.
Scale errors can occur in both laboratory and theoretical gf-values. We examined these wherever possible. To calculate the UV Mo II lines, we increased by 0.133 dex the Mo II log gf values of Sikström et al. (2001) for the five Mo II transitions that originate from the ground state. This is the difference between their value and the recent result of Lundberg et al. (2010) for the 2082Å Mo II line, the only ground-state Mo II line in common between the two studies. We followed Ivans et al. (2006) in adopting the Mo I gf-values of Whaling & Brault (1988) and the Ru I results of Wickliffe et al. (1994). For Ru II, Johansson et al. (1994) provide 18 experimental gf-values, and Palmeri et al. (2009) give theoretical values. Both wavelengths and gf-values proved unreliable for ruthenium lines with data solely from other sources.
For HD 76932 and HD 211998, the molybdenum abundances were determined from the optical Mo I line at 3864Å. For HD 94028, we adopted the molybdenum abundance which was just consistent with the non-detection of the Mo I 3797Å line. For HD 160617 and HD 140283, the molybdenum abundances were determined by matching Mo II line strengths, as these lines are rather weak, and Mo I is not detected. The Mo I and Mo II gf-value scales thus appear to be on a consistent scale. This is encouraging, as the Mo I gf-values have yielded a solar molybdenum abundance (Biemont et al., 1983) within 10% of the meteoritic value (Lodders, 2010).
For ruthenium, we sought the strongest Ru I lines in the optical and Ru II lines in the UV. It is again encouraging that Ru I and Ru II lines give consistent results for HD 76932 and HD 211998. For the other stars, however, the ruthenium lines with gf-values from these two sources that lie within the wavelength ranges observed at high resolution are weak and blended. In HD 160617 and HD 94028, our Ru values are based on these plots of the two Ru II lines and the Ru I line at 3499.942Å. For HD 140283, the limit is set by calculations not shown, adopting [Ru/Fe] = +1.0 for the Ru II 2102.307Å line.
6. Cadmium
Cadmium ( = 48) is currently constrained in only two stars. In HD 94028, [Cd/Fe] 0.0 is found from lower-resolution E230M spectra of the Cd I 2288.018Å line, adopting log gf = +0.15 dex (Roederer et al., 2010b). The HD 140283 E230H spectra show artifacts in this region; data are lacking entirely for other stars. In HD 140283, [Cd/Fe] 0.0 is inferred from the Cd II 2144.393Å line, even with log gf = 0.11 (Andersen & Soerensen, 1973), which is lower than more recent gf-values for this line (0.04 – +0.12: Xu et al., 2004; Mayo et al., 2005). In the other stars, this line is possibly blended. Obtaining E230H data for the Cd I line at 2288.018Å for these stars should pinpoint cadmium abundances, by resolving its own potential blends, determining [Cd/Fe] in HD 140283 and so fixing the Cd II 2144.393Å gf-value, and then using Cd I and Cd II together to set [Cd/Fe]. This would more strongly constrain the extent of light trans-Fe elemental overabundances in atomic number , and so the models of their production.
7. The s-process Contribution to Stellar Heavy-Element Abundances
The s-process may contribute to the Ru, and Mo, abundances, especially for the more metal-rich stars. To check this we have included [La/Fe] abundances from the 3995.75Å and 4086.71Å La II lines, with gf-values from Lawler et al. (2001) and hyperfine splitting structure from Ivans et al. (2006). We compare our Table 3 values with the trend of [La/Fe] vs. [Eu/Fe] for r-only field halo stars in the fourth panel of Fig. 1 of Roederer (2011). HD 76932 and HD 211998 lie within 0.05 dex of the mean relation. HD 160617 and HD 94028 fall 0.3 dex above the line, marginally beyond the extent of the r-only field stars in that figure. We conclude that any excess s-process contribution is small in these four stars.
For HD 140283, none of these La II lines were detected, but at [Fe/H] = 2.6 an s-process contribution is unlikely (Roederer et al., 2010a). Gallagher et al. (2010) find ambiguous results for its s-process content from fitting the 4554Å and 4934Å Ba II line profiles. That work and ours agree that [Eu/Fe] 0.9 in this star. Its abundance pattern strongly resembles that of HD 88609 and HD 122563 in showing larger deficiencies of heavy than light trans-Fe elements, with low relative abundances overall (Honda et al., 2007).
8. Results and Implications for Nucleosynthesis
Thus we conclude that in HD 94028, molybdenum is extremely enhanced, more so than ruthenium. Mo is also highly enhanced in HD 160617. Both these stars, indeed four of the five metal-poor turnoff stars studied here, have higher [Mo/Fe] values than any of the eight metal-poor giants with mild (if any) r-process enhancements listed in Table 1. Yet none has [La/Fe] enhancements more than 0.3 dex higher than expected from its [Eu/Fe] value, based on Fig. 1 of Roederer (2011). The total range in [Mo/Fe] among these five stars is 0.8 dex, while the total range in [La/Fe] is 0.4 dex. Among these stars with modest or no r-process enhancements, no correlation is seen between [Eu/Fe] and [Mo/Fe]. The extreme enhancements are rather narrowly confined to Mo, diminishing towards Zr and Y and towards Ru and beyond.
Since both s- and r-process nucleosynthesis tend to produce similar enhancements over a range of non-magic neighboring even- elements, the production of molybdenum and ruthenium in HD 94028 most probably involves another process. As noted above, a HEW is capable of overproducing light trans-Fe elements if the wind parameters are right. Farouqi et al. (2010) express this in terms of : = 0.498 yields Sr, Y, Zr, and Nb ( = 38–41); = 0.496, Mo and Ru; = 0.490, Rh, Pd, and Ag (Z = 45–47); and = 0.482, Cd and beyond (Z 48). Clearly, a HEW with a limited parameter range seems able to reproduce the strong excess of molybdenum with less strong excesses at zirconium and beyond ruthenium.
These unique factors also suggest that very few individual nucleosynthesis events were incorporated into the stars with extreme molybdenum abundances. This is especially remarkable for HD 94028, given its rather high metallicity, [Fe/H] = 1.4. From Table 7 of Farouqi et al. (2010), the yield from an individual HEW event with = 0.496 is M☉; this is more than adequate. However, the narrow entropy range means that multiple HEW events with a range of parameters must be avoided during the buildup of the iron abundance.
The referee has pointed to another example, from Aoki et al. (2007). They find that the star COS 82 in the dwarf galaxy Ursa Minor, with [Fe/H] = 1.5, has a very high heavy element enhancement with an r-process signature. They note that such high r-process enhancements are found in Galactic stars only below [Fe/H] = 2.5, and suggest that “the neutron-capture elements of COS 82 might be provided by a single event.”
Such a scenario has recently become theoretically more feasible. Bland-Hawthorn, Sutherland, & Karlsson (ApJ, in preparation) have found that a dark matter halo of about with about in gas, a lower-mass system than previously thought, can still form stars from retained products released by an exploding supernova. The lower mass results from the reduced sweeping of products when clumpiness of the medium and off-center supernovae explosions are included.
However, as discussed above, we know of no prior evidence for single-supernova production of any group of trans-Fe elements in moderately metal-poor Galactic halo stars. More Mo abundances in halo stars with [Fe/H] 1.4 are needed, to verify rarity and define the frequency of occurrence of high [Mo/Fe] values as a function of metallicity. A survey that includes stars with well-established kinematics might reveal if high-Mo stars might have been formed in captured/dissipated dwarf galaxies. For stronger-lined turnoff stars like HD 76932 and HD 211998, either cool or of moderate metallicity, Mo and Ru can be determined from archival ground-based spectra, as shown in Figure 1. For the most metal-poor r-normal stars, however, the UV lines are required.
Determination of the abundances of more light trans-Fe elements in HD 94028 and HD 160617 seem critical as well, to provide stronger HEW support and constraints for parameterized modeling. The steeper the falloff of abundance enhancements from Mo to Ru and beyond, the more narrow the entropy range implied in HEW synthesis. Obtaining high-resolution spectra redward of 2200Å for these stars might reveal Nb and Pd abundances, as well as pin down Ru and Cd.
Both these efforts are vital in revealing whether the very high molybdenum enhancements reported here are unique. This in turn would help establish to what extent they truly are the result of very few events in some stars, even at quite high metallicity.
References
- Andersen & Soerensen (1973) Andersen, T., & Soerensen, G. 1973, J. Quant. Spec. Radiat. Transf., 13, 369
- Aoki et al. (2007) Aoki, W., Honda, S., Sadakane, K., & Arimoto, N. 2007, PASJ, 59, L15
- Arnould (1976) Arnould, M. 1976, A&A, 46, 117
- Ayres (2010) Ayres, T. R. 2010, ApJS, 187, 149
- Biemont et al. (1983) Biemont, E., Grevesse, N., Hannaford, P., Lowe, R. M., & Whaling, W. 1983, ApJ, 275, 889
- Burbidge et al. (1957) Burbidge, E. M., Burbidge, G. R., Fowler, W. A., & Hoyle, F. 1957, Rev. Mod. Phys., 29, 547
- Castelli & Kurucz (2003) Castelli, F., & Kurucz, R. L. 2003, in IAU Symposium, Vol. 210, Modelling of Stellar Atmospheres, ed. N. Piskunov, W. W. Weiss, & D. F. Gray, 20P–+
- Clayton (1968) Clayton, D. D. 1968, Principles of stellar evolution and nucleosynthesis (New York: McGraw-Hill)
- Cowan et al. (1991) Cowan, J. J., Thielemann, F., & Truran, J. W. 1991, Phys. Rep., 208, 267
- Farouqi et al. (2009) Farouqi, K., Kratz, K., & Pfeiffer, B. 2009, PASA, 26, 194
- Farouqi et al. (2010) Farouqi, K., Kratz, K., Pfeiffer, B., Rauscher, T., Thielemann, F., & Truran, J. W. 2010, ApJ, 712, 1359
- François et al. (2007) François, P., et al. 2007, A&A, 476, 935
- Freiburghaus et al. (1999) Freiburghaus, C., Rembges, J.-F., Rauscher, T., Kolbe, E., Thielemann, F.-K., Kratz, K.-L., Pfeiffer, B., & Cowan, J. J. 1999, ApJ, 516, 381
- Fröhlich et al. (2006) Fröhlich, C., Martínez-Pinedo, G., Liebendörfer, M., Thielemann, F.-K., Bravo, E., Hix, W. R., Langanke, K., & Zinner, N. T. 2006, Physical Review Letters, 96, 142502
- Gallagher et al. (2010) Gallagher, A. J., Ryan, S. G., García Pérez, A. E., & Aoki, W. 2010, A&A, 523, A24+
- Gregg et al. (2004) Gregg, M. D., et al. 2004, in Bulletin of the American Astronomical Society, Vol. 36, American Astronomical Society Meeting Abstracts, 1496–+
- Hoffman et al. (1996) Hoffman, R. D., Woosley, S. E., Fuller, G. M., & Meyer, B. S. 1996, ApJ, 460, 478
- Honda et al. (2007) Honda, S., Aoki, W., Ishimaru, Y., & Wanajo, S. 2007, ApJ, 666, 1189
- Honda et al. (2006) Honda, S., Aoki, W., Ishimaru, Y., Wanajo, S., & Ryan, S. G. 2006, ApJ, 643, 1180
- Ivans et al. (2006) Ivans, I. I., Simmerer, J., Sneden, C., Lawler, J. E., Cowan, J. J., Gallino, R., & Bisterzo, S. 2006, ApJ, 645, 613
- Johansson et al. (1994) Johansson, S. G., et al. 1994, ApJ, 421, 809
- Kappeler et al. (1989) Kappeler, F., Beer, H., & Wisshak, K. 1989, Reports on Progress in Physics, 52, 945
- Kurucz (1993a) Kurucz, R. 1993a, ATLAS9 Stellar Atmosphere Programs and 2 km/s grid. Kurucz CD-ROM No. 13. Cambridge, Mass.: Smithsonian Astrophysical Observatory, 1993., 13
- Kurucz (1993b) —. 1993b, SYNTHE Spectrum Synthesis Programs and Line Data. Kurucz CD-ROM No. 18. Cambridge, Mass.: Smithsonian Astrophysical Observatory, 1993., 18
- Kurucz (2011) Kurucz, R. L. 2011, Canadian Journal of Physics, 89, 417
- Lai et al. (2011) Lai, D. K., Smith, G. H., Bolte, M., Johnson, J. A., Lucatello, S., Kraft, R. P., & Sneden, C. 2011, AJ, 141, 62
- Lawler et al. (2001) Lawler, J. E., Bonvallet, G., & Sneden, C. 2001, ApJ, 556, 452
- Lodders (2010) Lodders, K. 2010, in Principles and Perspectives in Cosmochemistry, ed. A. Goswami & B. E. Reddy, 379–+
- Lugaro et al. (2003) Lugaro, M., Davis, A. M., Gallino, R., Pellin, M. J., Straniero, O., & Käppeler, F. 2003, ApJ, 593, 486
- Lundberg et al. (2010) Lundberg, H., Engström, L., Hartman, H., Nilsson, H., Palmeri, P., Quinet, P., & Biémont, É. 2010, Journal of Physics B Atomic Molecular Physics, 43, 085004
- Mayo et al. (2005) Mayo, R., Ortiz, M., Campos, J., Blagoev, K., & Malcheva, G. 2005, Phys. Scr, 72, 142
- Palmeri et al. (2009) Palmeri, P., et al. 2009, Journal of Physics B Atomic Molecular Physics, 42, 165005
- Pellin et al. (2006) Pellin, M. J., et al. 2006, in Lunar and Planetary Institute Science Conference Abstracts, Vol. 37, 37th Annual Lunar and Planetary Science Conference, ed. S. Mackwell & E. Stansbery, 2041–+
- Peterson (2008) Peterson, R. 2008, Space Telescope Science Newsletter, 25, 24
- Peterson et al. (2001) Peterson, R. C., Dorman, B., & Rood, R. T. 2001, ApJ, 559, 372
- Roederer (2011) Roederer, I. U. 2011, ApJ, 732, L17+
- Roederer et al. (2010a) Roederer, I. U., Cowan, J. J., Karakas, A. I., Kratz, K., Lugaro, M., Simmerer, J., Farouqi, K., & Sneden, C. 2010a, ApJ, 724, 975
- Roederer et al. (2010b) Roederer, I. U., Sneden, C., Lawler, J. E., & Cowan, J. J. 2010b, ApJ, 714, L123
- Roederer et al. (2010c) Roederer, I. U., Sneden, C., Thompson, I. B., Preston, G. W., & Shectman, S. A. 2010c, ApJ, 711, 573
- Schwenke (1998) Schwenke, D. W. 1998, Faraday Discussions, 109, 321
- Seeger et al. (1965) Seeger, P. A., Fowler, W. A., & Clayton, D. D. 1965, ApJS, 11, 121
- Sikström et al. (2001) Sikström, C. M., Pihlemark, H., Nilsson, H., Litzén, U., Johansson, S., Li, Z. S., & Lundberg, H. 2001, Journal of Physics B Atomic Molecular Physics, 34, 477
- Sneden et al. (2008) Sneden, C., Cowan, J. J., & Gallino, R. 2008, ARA&A, 46, 241
- Sneden et al. (2003) Sneden, C., et al. 2003, ApJ, 591, 936
- Travaglio et al. (2004) Travaglio, C., Gallino, R., Arnone, E., Cowan, J., Jordan, F., & Sneden, C. 2004, ApJ, 601, 864
- Whaling & Brault (1988) Whaling, W., & Brault, J. W. 1988, Phys. Scr, 38, 707
- Wickliffe et al. (1994) Wickliffe, M. E., Salih, S., & Lawler, J. E. 1994, J. Quant. Spec. Radiat. Transf., 51, 545
- Woosley & Howard (1978) Woosley, S. E., & Howard, W. M. 1978, ApJS, 36, 285
- Xu et al. (2004) Xu, H. L., et al. 2004, Phys. Rev. A, 70, 042508
- Yong et al. (2008) Yong, D., Karakas, A. I., Lambert, D. L., Chieffi, A., & Limongi, M. 2008, ApJ, 689, 1031