Anelastic spectroscopy study of the metal-insulator transition of Nd1-xEuxNiO3
Abstract
Measurements are presented of the complex dynamic Young’s modulus of NdNiO3 and Nd0.65Eu0.35NiO3 through the Metal-Insulator Transition (MIT). On cooling, the modulus presents a narrow dip at the MIT followed by an abrupt stiffening of . The anomaly is reproducible between cooling and heating in Nd0.65Eu0.35NiO3 but only appears as a slow stiffening during cooling in undoped NdNiO3, conformingly with the fact that the MIT in NiO3 changes from strongly first order to second order when the mean size is decreased. The elastic anomaly seems not to be associated with the antiferromagnetic transition, which is distinct from the MIT in Nd0.65Eu0.35NiO3. It is concluded that the steplike stiffening is due to the disappearance or freezing of dynamic Jahn-Teller (JT) distortions through the MIT, where the JT active Ni3+ is disproportionated into alternating Ni3+δ and Ni3-δ. The fluctuating octahedral JT distortion necessary to justify the observed jump in the elastic modulus is estimated as , but does not have a role in determining the MIT, since the otherwise expected precursor softening is not observed.
pacs:
71.30.+h, 71.70.Ej, 62.40.+i, 75.50.EeI Introduction
There is still uncertainty on the exact nature of the metal-insulator transition (MIT) in the NiO3 perovskites.Cat08 ; BSP11 ; LCB11 Following a systematic study with several ion sizes,TLN92 the MIT in these perovskites has been associated with the opening of a gap between the O band and the Ni upper Hubbard band when the ion size and/or temperature are decreased.TLN92 ; IFT98 In fact, the O bond is too short with respect to the NiO one for the cubic perovskite structure and the mismatch is relieved by tilting of the NiO6 octahedra. Both a smaller size and cooling enhance the mismatch and hence tilting, for steric reasons and because of the larger thermal expansion of the O bond. This results in a further reduction of the angle between NiONi bonds with respect to 180o, reduces the overlap and hence the width of the O and Ni bands and finally opens a gap between them, causing the MIT.IFT98 Indeed, with increasing the ion size the temperature at which the MIT occurs decreases, or the metallic phase becomes more stable.TLN92 In this manner it is possible to rationalize the phase diagram of NiO3 of vs the ion size, and a similar behavior is found in cobaltites.TYK08
On the other hand, Ni3+ has an electronic configuration similar to that of Mn3+, with filled triplet states (thanks to Hund’s rule in the case of Mn) and one electron in the doublet, whose degeneracy can be lifted by tetragonal and orthorhombic distortions according to the Jahn-Teller (JT) effect. The physics of Mn perovskites is dominated by the Jahn-Teller coupling between these electronic states and the distortions of the octahedra, which is a cause of orbital ordering (OO), and the same might be expected for nickelates. On the contrary, according to the early diffraction experiments the octahedral distortions in nickelates are extremely small or null.Med97 ; IFT98 Later, starting with the nickelates with smaller , it has been found that the MIT is accompanied by a subtle orthorhombic to monoclinic structural change, with charge disproportionation (CD) 2Ni Ni Ni3-δ and charge ordering (CO) into alternately expanded and contracted NiO6 octahedra along the three directions,AGF99 and some octahedral distortion of the larger Ni3-δO6 octahedra. A similar result has been recently found also with the larger ions NdGAA09 and Dy.AMD08 Such JT distortions are found only in the larger and more ionic Ni3-δO6 octahedra and are at least one order of magnitude smaller than those observed in manganites.
Notice that in a naive picture CO and OO should not occur in the same set of Ni ions, since Ni3+ is JT active, while Ni2+ and Ni4+ are not, but to what extent CO and OO occur in nickelates is still subject of controversy. Just because of the subtleness of the structural changes attributable to CO or OO, recourse has been had to resonant X-ray scattering.SMF02 ; LHP05 ; SSJ05 ; SSM06f These experiments in NdNiO3 are interpreted as evidence of partial CO rather than OO occurring at the MIT. According to this view, the degeneracy of the orbitals would be lifted already in the metallic state, where the OO would be reflected by the tilts of the octahedra; the MIT would be due only to CD, accompanied by a small change of tilt angle.SSJ05 It is debated to what extent these experiments may provide information on the contribution of CO and OO to MIT,DiM09 but the view that MIT is due to CO rather than OO received further support from theory and experiments under hydrostatic pressure in LuNiO3,MKL07 and from the above mentioned diffraction studies on Nd and Eu, where alternated small and large octahedra are found.AMD08 ; GAA09 Nonetheless, recent experiments under pressureCZG10 suggest that the previous onesMKL07 were affected by an unwanted uniaxial component of pressure, and exclude a role of CO in the MIT;CZG10 rather, dynamic JT deformations would be responsible for large isotope effects in .ZGD03
Additional experiments that have been performed in order to probe CD with CO and OO at the MIT in nickelates include MössbauerKDP02 ; PDB05 ; CML06 ; CMA07 and x-ray absorption spectroscopies.PTR05 Again, there is no clear picture, with possibility of OOKDP02 ; PDB05 or COPDB05 ; CML06 ; CMA07 even in the metallic state.PTR05
A similarly confused situation exists for NaNiO2 and LiNiO2, which are also composed of NiO6 octahedra but sharing the edges instead of corners.KK05b While NaNiO2 undergoes a phase transformation with clear cooperative JT distortion, LiNiO2 has little or even reverse JT distortion,CPS05 which is not yet explained. Some of the proposed explanations involve the peculiar geometry of the LiNiO2 lattice, where the triangular Ni sublattice frustrates AFM correlations, but other possible causes may apply also to NiO3, like the fact that the JT distortion exists but is incoherentRDC95 or with very short coherence length,CPS05 or is hindered by the electron delocalisation.MKL07
From the above summary and recent reviewsCat08 it appears that, in spite of the wealth of experimental data on the NiO3 series, the presence and role of CD and CO and/or OO at the MIT is not clear. In the Mn perovskites important and quantitative information has been obtained on such issues by studying the associated elastic anomalies;HGN00 ; HGN04 in Ni perovskites no such type of investigation has ever been reported, except for a preliminary report of the present results.BJT11 Here anelastic spectroscopy measurements on Nd1-xEuxNiO3 are presented and discussed, which shed new light on these issues.
II Experimental
Polycrystalline samples of Nd1-xEuxNiO3 ( and 0.35) were prepared from sol-gel precursors, sintered at 1000 ∘C, and under oxygen pressure of 80 bar. Details of the synthesis process for preparing these samples are described in details elsewhere.ESM00 All samples were characterized by X-ray powder diffraction in a Brucker D8 Advance diffractometer. The x-ray diffraction patterns showed no extra reflections due to impurity phases, and indicated that all samples have a high degree of crystallinity. The samples were two bars with (NEN0) and with (NEN35), both with approximate size mm3 and a density g/cm3 for NEN0(35), about of the theoretical density. Such a high porosity makes the evaluation of the absolute value of the complex Young’s modulus problematic, but did not affect the quality of the measurement of its temperature dependence. This was measured by electrostatically exciting the flexural vibrations of the bars, which were suspended on thin thermocouple wires in vacuum, and with one face made well conducting also below the MIT with Ag paint. It was possible to excite various flexural modes, whose resonance frequencies are ideally in the ratios . The fundamental frequency is given byNB72
| (1) |
where is the length, the thickness, the density of the bar; at room temperature it was kHz.
In the Discussion we will need an estimate of the absolute value of the Young’s modulus, which is found with Eq. (1). The effective Young’s moduli at room temperature, uncorrected for porosity, were GPa for NEN0 and 12.5 GPa for NEN35, which are times smaller than the typical values GPa found in ceramics of similar type. Sources of error are the sample porosity, deviations from the shape of a rectangular parallelepiped, low homogeneity and the presence of the Ag conductive layer, wrong identification of the vibration modes and mixing of flexural with torsional modes. The largest source of error in our case seems to be the extremely high porosity, . The other causes should be of minor importance; for example, the NEN0 sample had the lowest value of , but its ratios and were in excellent agreement with the theoretical values given above. The correction for such high porosities are very unreliable; to give an idea, the Young’s modulus of porous ceramics are corrected with empirical expressions like with ,AKL01 or with .DYS02 These expressions would enhance in our case by a factor between 2.5 and 5.2. While this brings of NEN35 to reasonable values up to 66 GPa, the value of NEN0 would remain below 25 GPa. The large difference between the two may in part be accounted for by different types of porosities, in terms of shape and connectivity of the pores, and in part due to the Eu substitution. In the discussion we will assume GPa.
The anelastic spectra are displayed in terms of the real part of the Young’s modulus or its reciprocal, the compliance , and of the elastic energy loss coefficient .
III Results
In Fig. 1 is reported the anelastic spectrum of NEN0 measured during cooling (empty symbols) and subsequent heating (filled symbols) measured exciting the first odd flexural modes at 0.63, 3.5 and 8.6 kHz during the same run. During cooling, below 190 K there is a progressive stiffening of the Young’s modulus in excess of the slight linear anharmonic stiffening observed at higher temperature; such a stiffening proceeds until the lowest temperature reached by us, although in the end it starts levelling off. On heating, the modulus resumes the almost linear and weak temperature dependence except for a steplike softening followed by a dip at 191 K. It is clear by comparison with resistivity, specific heat and magnetization measurements that the steplike change of with large temperature hysteresis is due to the MIT.EBJ06 ; BJT11
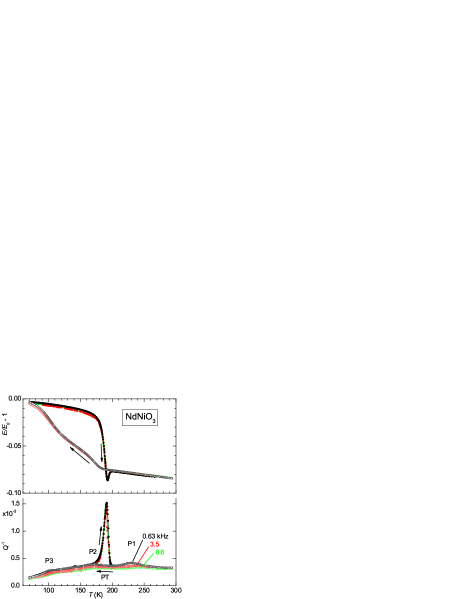
The is perfectly reproducible on heating and cooling, except for the sharp peak in correspondence with the cusped softening, both of which appear only during heating. In addition, there are other three peaks: P1 at K, P2 at 171 K and P3 at K. While the temperature of P2 is independent of frequency, the other two increase with frequency, and therefore indicate thermally activated processes whose maxima occur when the condition is met,NB72 where is frequency and a relaxation time. We will ignore these reproducible but small peaks.
The spectrum of NEN35 (Fig. 2) is similar to that of NEN0 during heating, but the MIT occurs at 288 K, if identified with the cusp in the real part, and the hysteresis is completely absent, the only difference between heating and cooling being the intensity of the peak in real and imaginary parts at the MIT. The curves measured at a frequency five times higher are not shown for clarity, since they are identical except that the peak in is higher, whereas in NEN0 it is nearly identical.
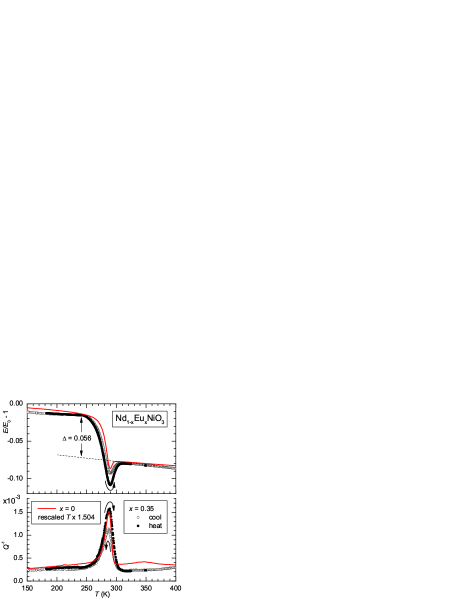
The other small peaks in the are absent in NEN35. In Fig. 2 are also reported the curves measured on NdNiO3 during heating, rescaled in temperature by a factor 1.504. The rescaled elastic anomaly of NdNiO3 is slightly sharper and narrower in the real part, with a smaller dip, and almost coincident in the absorption. In NEN35 the antiferromagnetic (AFM) transition occurs at K ,BJT11 but there is no clear sign of it in the anelastic spectra.
IV Discussion
The overall phenomenology of the anelastic anomalies found in Nd1-xEuxNiO3 appears to be mainly related to the MIT and in agreement with what is known from other techniques. In NdNiO3 the MIT occurs at K and has marked first order character, with a large hysteresis between cooling and heating. When decreasing the mean ion size by Eu doping, the MIT shifts to higher temperature and becomes second order, while shifts below . The anelastic anomalies also appear to be marginally affected by the magnetic transition, since the heating curves are very similar to each other regardless of the fact that coincides with or not. The present data can be compared with those of resistivity, magnetization and specific heat taken on the same materials.EBJ06 ; BJT11 The hysteresis is due to the fraction of material that remains metallic in the insulating phase, and the fact that the step in (see Fig. 7 in Ref. EBJ06, ) is narrower than that in during cooling is explained by the fact that the latter probes the bulk fraction of insulating and metallic phases, while resistivity rather probes percolating conductive paths.
IV.1 Comparison with the specific heat anomaly
It seems that the dip in the modulus at and the stiffening below it have different origins, since with the dip and accompanying peak in differ in amplitude between heating and cooling, while the step in is reproducible. This observation allows us to separate the two anomalies and compare the dip in the modulus, or peak in compliance , with the peak in specific heat. The curves 1 and 2 in Fig. 3 are the normalized compliance on heating and cooling, after subtracting a linear background ; the reference is the extrapolation of to 0 K. Besides the peak at 290 K and the step below that temperature, there is an additional shallow rise of the compliance below 250 K. The shape of the latter is very uncertain, due to the background subtraction. The anharmonic phonon contribution to the temperature dependence of the elastic constants is generally almost linear and levels off at low temperature, but being unable to distinguish the anharmonic contribution from the other anomalies in the temperature dependence of , we chose to use a simple linear interpolation over the whole K range. Curve 3 is the difference between curves 1 and 2 and it has been subtracted from them after multiplication by scale factors in order to remove the peaked component. It turns out that the best values of the factors are 2.00 and 1.00. The resulting curves 4 and 5 are coincident and have only the step below 290 K plus the shallow rise.
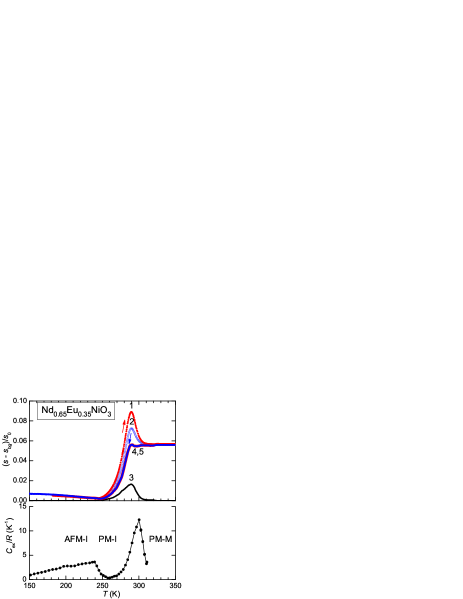
Both the peak (curve 3) and the excess compliance below 250 K can be put in relationship with the excess specific heat measured on a similar sample.BJT11 In fact, a softening proportional to the specific heat anomaly is expected at a magnetic transition,Lin79 and also at other types of transitions under the rather general condition that their critical temperature depends on pressure or more generally on stress.Tes75 A possible identification of the two anomalies in is the peak at K with the CO and/or orbital transition concomitant with the MIT, possibly with participation of spin degrees of freedom,KGG02 and the broad contribution below 250 K with the onset of long range AFM order. The latter is expected to produce a jump in the entropy of the spins,BCG94 ; PBG99 but the jumps of the entropy are only between and K and between and K. The fact that the actual step is smaller than expected from complete AFM ordering has already been noted in other NiO3 nickelates, and has been interpreted as due to AFM correlations also above , so that only a relatively small loss of entropy is involved in the long range AFM ordering.BCG94 ; PBG99
IV.2 Step-like stiffening below the MIT
The main feature of the elastic anomaly at both compositions is the stiffening below the MIT, whose step-like nature is made evident after the subtraction of the peaked component in curves 4 and 5 of Fig. 3. This is quite an unusual observation, since phase transitions are generally accompanied by softening rather than stiffening. As discussed below, if some strain component is coupled linearly with the order parameter of the transition, then its elastic constant presents a cusped softening at the critical temperature and is therefore followed by restiffening to the background elastic constant on further cooling. This is not the case of curves 4 and 5, which lack any sign of precursor softening divergent near .
There are several elastic studies of the CO and OO transitions in perovskite manganites and in other compounds, but most of them concentrate on the precursor softening above the transitions. In few cases the subsequent restiffening below the transitions has been considered, especially if it appears of excessive sharpness and amplitude with respect to the precursor softening. In these cases recourse has been had to different sets of fitting parameters above and below CZQ05 or to a Landau free energy expansion with coefficients unrelated to CO or OO.SSS02 In Nd0.5Sr0.5MnO3 a steplike stiffening at the MIT has been interpreted as the effect of the renormalisation of the elastic constant by the conduction electrons with a factor , where is the electron-phonon coupling constant and is the electron susceptibility, identified with the magnetic susceptibility .ZSL00 In that case, the MIT coincides with a transition from FM to AFM and has a negative step, which becomes positive in the renormalisation factor of the elastic constant. This type of analysis is not appropriate to Nd1-xEuxNiO3, whose magnetic susceptibility has an almost imperceptible decrease below , superimposed to a stronger rise with cooling, even after subtraction of the contribution of the Nd and Eu ions.ZGD00 ; EBJ06
Lacking an adequate precedent for a satisfactory interpretation of the step component of the elastic compliance of Nd1-xEuxNiO3, we first review what kind of elastic response is expected at a MIT or magnetic transition, and then propose an interpretation based on the response of the JT distortions, from a point of view different from that usually adopted. Detailed discussions of the elastic anomalies expected at various types of phase transitions can be found in many review articles and books, usually based on the Landau theory with the coupling between strain and order parameter included,Reh73 ; BRN92 ; CS98 ; GL03 ; Lut07 and therefore we only quote what is strictly necessary to our discussion.
IV.3 Landau analysis
Near a phase transition the free energy can be expanded in powers of the order parameter(s) . In the present case the order parameter (OP) can be one or more of the symmetrized charge fluctuation coordinates for describing charge ordering, or the quadrupolar orbital operators of the Ni ions for orbital ordering, or the staggered magnetization for the AFM transition. By including powers of up to the 6th order, it is possible to reproduce both first and second order transitions, and including coupling terms containing both and strain , it is possible to deduce the effect of the relaxation of the OP under stress on the elastic constants. In the case that the OP is strain itself or is linearly coupled to it with a term , the elastic constant coupled to the OP ideally vanishes at the transition temperature , or at least has a negative cusp. If bilinear coupling is forbidden because no strain has the same symmetry of the OP, the next coupling term, , causes a negative step at in the the elastic constant coupled to the OP, possibly including a weak restiffening below . A biquadratic coupling adds to the elastic constant a contribution below , which can be a linear or saturating rise or decrease, depending on the temperature dependence of the OP and on the sign of the coupling constant . Of all these terms, the latter is the only one that might produce a stiffening below without precursor softening; other terms are possible but less important in the great majority of cases.
IV.4 Magnetic transition
Magnetic transitions cause elastic anomalies through essentially two mechanisms: exchange striction and magnetostriction. The first mechanism causes cusp-like softening in the elastic constants involving the strains that change the atomic distances and hence the exchange constant. The magnitude of such anomalies is of the order of 1%.Lut07 Even smaller step-like softening can be caused by magnetostrictive coupling with the lattice, namely by a term linear in strain and quadratic in spin variable or magnetization, which, according to Landau’s theory,Reh73 produces below the magnetic transition a negative step in the modulus of magnitude . Such a softening is usually observed at magnetic transitions.Lin79 ; LWS69 ; KMB94
On the other hand, in the FM transition of YTiO3, a stiffening is found,MHI06 whose origin has not been explained, but also involves OO. In the hexagonal quasi-1D AFM multiferroic YMnO3, there is 1% stiffening below in and 3% in due to biquadratic couplingPLP07 (see previous paragraph). In fact, below 75 K the temperature dependence of follows the squared OP, , downto 2 K, which appears different from the abrupt rise in Nd1-xEuxNiO3. In the present case, the involvement of magnetic effects in the steplike stiffening is made even more unlikely by the fact that in Nd0.65Eu0.35NiO3 the magnetic transition occurs at .
IV.5 Cooperative Jahn-Teller phase transition and orbital ordering
Following the notation of Hazama and coworkers,HGN00 ; HGN04 the quadrupolar moments of the orbitals of Ni3+ can couple with tetragonal and orthorhombic strains (both with the same elastic constant ), and interact with each other causing the cooperative JT transition.Mel76 The relevant part of the Hamiltonian of Ni3+ ions per unit volume, referred to the unit cell volume , is
| (2) |
where the quadrupolar operators and correspond, apart from a geometrical factor , to the occupation numbers of octahedra with tetragonal and orthorhombic JT distortions reflecting the symmetry of their orbitals. The first term is the linear coupling to the external strain, with a coupling strength , and causes softening of the elastic constant, while the second term is the elastic interaction among the orbitals in the mean field approximation with strength , and determines the type of OO. The resulting softening of the elastic constant is
| (3) |
where is the background elastic constant and the susceptibility
| (4) |
is proportional to the contribution to the compliance from noninteracting orbitals, . Equation (3) can be rewritten as
| (5) |
where and . In this form it is clear that the elastic constant vanishes at , which is the onset of the OO or cooperative JT transition, and that stiffens again on further cooling. At higher temperatures, when and hence , Eq. (3) shows that the softening induced by the orbitals freely responding to the applied stress is simply given by Eq. (4) and is .
IV.6 Charge ordering
The charge fluctuations can be expanded into fluctuation modes acting as OP of the CO transition, one or some of which may be linearly coupled to the strain having the same symmetry with terms . As also shown in Appendix B, if such terms are included in the expansion of the free energy in powers of up to the fourth order, a second order transition at a temperature results, and the renormalized elastic constant can be written exactly as in the case of the OO transition, Eq. (5), where is the temperature at which the term of the Landau expansion vanishes and , , with the elastic constant appropriate to , is the temperature at which the CO transition occurs with onset of spontaneous strain of type . Therefore, OO between two orbitals and CO from condensation of a single charge fluctuation mode produce the same precursor softening on the appropriate elastic constant ( for OO within the doublet). The restiffening below the transition is discussed in Appendix B. Examples of materials similar to NiO3 where both transitions have been recognized in ultrasonic experiments are La1-xSrxMnO3 with HGN00 and Pr1-xCaxMnO3 with .HGN04
IV.7 Softening in terms of octahedral JT distortion and its disappearance below the MIT
From the above discussion it appears that a transition whose driving force is the interaction between JT active orbitals or between ionic charges would appear in the coupled elastic constant as a clear precursor softening that diverges at the transition, followed by restiffening on further cooling. This is clearly not the case of Nd1-xEuxNiO3, since the Young’s modulus presents a weak and almost linear stiffening downto a temperature very close to the MIT, which excludes any mechanism coupled to strain. This is also shown quantitatively in Sect. I.
The picture we propose is the following. The MIT is an electronic transition, presumably occurring at the opening of the charge transfer gap during cooling,TLN92 ; IFT98 when the O bonds, having larger thermal expansion of the shortest NiO bonds, shorten faster than the latter and enhance the buckling of the NiONi bonds beyond a critical threshold. The driving mechanism for this is the thermal contraction due to lattice anharmonicity, and there is no effect on the elastic constants other than the usual anharmonic stiffening. In the metallic phase the octahedra would be JT distorted with a fluctuation rate much faster than our measuring frequency, so that their contribution to the lattice softening would be noncritical, namely Eq. (3) with , and the OO transition would occur well below . The MIT would inhibit such a softening, possibly due to the concomitant CO that transforms JT active Ni3+ into (partially) inactive Ni3±δ, or making the distortions static, or both. This would make the insulating phase stiffer than the metallic one, so that the disappearance of the metallic phase would be accompanied by elastic stiffening.
In what follows we will evaluate the JT distortion necessary to explain the steplike stiffening in Figs. 1 and 2 with the above mechanism and test the consistency of this explanation with the available data. In order to relate the amount of elastic softening to the JT distortion of the octahedra, rather than to the coupling coefficient , it is convenient to recast the above results in the usual formalism of anelastic relaxation from point defects.NB72 ; 33 It may seem unrealistic to describe distorted octahedra sharing the O atoms, and hence strongly interacting, as almost independent defects carrying a distortion, but this is equivalent to the formulation of Sect. IV.5, namely the OO approach to the cooperative JT effect.KYB09 In the case of nickelates it is certainly justified by the smallness of the JT distortions, which make uncorrelated fluctuations less energetically unfavorable. If we neglect the interaction term , the hamiltonian (2) is equivalent to that of a system of independent defects of type with double-force tensor , whose interaction energy with an external strain isLB78
where with are the molar concentrations of defects, and the summation over the cartesian components selects the strain component of the same symmetry of the defect, . It appears therefore that in Eq. (2) is equivalent to , although the separate correspondences and do not necessarily hold. In turn, the double force tensor can be expressed in terms of the elastic quadrupole (usually called elastic dipoleNB72 ) as , where is the fourth-rank elastic stiffness tensor. The tensor is adimensional and is the strain of a unity concentration of defects of type , in the present case the tetragonal or orthorhombic strain of the octahedra, so that the anelastic strain due to defects is
where the obey Boltzmann’s statistics and depend on the applied stress through the defect energies . For only two types of defects with the same symmetry and coupled to strain through the same symmetrized elastic constant the relationship between and is simply , and the contribution to the compliance, , isNB72 ; 33
| (6) |
where and the numerical factor differs from those usually reported for reorientation of defects with the same symmetry, since we are dealing with the relaxation between a tetragonal and an orthorhombic state rather the reorientation of the principal axes of among equivalent crystallographic directions.
We can carry the analogy with point defects further into the dynamic response. If is the relaxation time for an electron to change orbital, the softening Eq. (6) acquires a frequency dependent factor noticeable when temperature is lowered enough to slow and make it comparable to the measuring angular frequency ;NB72 this has also been discussed in connection with JT effect in UO2.BW68 The concentration of electrons would be 1 for NiO3 if there were no disproportionation of Ni3+. The MIT may reduce the magnitude of both reducing through the concomitant disproportionation of Ni3+ and/or making null the frequency factor if the distortions become quasistatic with .
In Appendix A we define the octahedral distortions in terms of the symmetrized tetragonal and orthorhombic strains and with magnitude , and evaluate the resulting polycrystalline average of the relaxation strength of the Young’s modulus, , as
| (7) |
IV.8 Estimate of the Jahn-Teller distortion necessary to explain the stiffening below the MIT
As a first check that this mechanism can explain the stiffening at the MIT, let us suppose that on passing across the MIT the JT distortion totally disappears together with the Ni3+ ions; therefore we equate the above with to the overall jump of . The largest source of error in evaluating is the absolute value of the Young’s modulus, which we assume to be GPa (see Sect. II), and together with for NEN35 yields cmerg; the cell volume isEBJ06 cm3 and Eq. (7) with gives , namely 3% octahedral and tetragonal distortions.
In order for this interpretation to be selfconsistent, it should turn out that the temperature for OO is smaller than . There is no constraint to the smallness of the intersite contribution , which can also be negative for antiferroquadrupolar coupling. Instead, the JT energy is determined by the coupling with uniform strain, , with , where is determined by the equivalence . The elastic constant is unknown and we set it equal to , finding K and K, therefore smaller than . The same estimate for NdNiO3 with and K yields , K and K, again smaller than .
Up to now it is shown that a CD with complete suppression of the JT effect can explain the stiffening below the MIT, but it is also necessary to determine the effect of an incomplete charge disproportionation 2Ni Ni Ni3-δ with . The above treatment suggests a naive analogy of JT active octahedra with point defects, whose concentration is in the conductive phase and becomes in the insulating one, with unchanged distortion . However, this is not the picture proposed after the diffraction experiments, where is deduced from the change of valence of Ni3+, and this is in turn extracted from the average NiO bond lengths together with the bond valence model.GAA09 In this picture, all the octahedra undergo disproportionation, and are alternated along the three principal directions as small Ni3+δ and large Ni3-δ octahedra, only the latter supporting some residual JT distortion.GAA09 ; AMD08 From this point of view, a more sensible hypothesis is that, when entering the insulating phase, in Eq. (7) passes from 1 to and the JT distortion is reduced by an amount depending on . If we suppose a linear relationship between and , then we should set into Eq. (7), and repeating the above analysis with the estimate for NdNiO3,GAA09 ; SMF02 and we would find and K. The latter value, being slightly larger than , seems at first inconsistent with the present analysis, but there are several arguments that this is not necessarily the case. A first point is that we ignored the correlations between octahedra, which in the perovskite structure with octahedra sharing the vertices is expected to be antiferroelasticKK82 and corresponds to a negative compensating , as in Pr1-xCaxMnO3.HGN04 Another point is that the JT distortion may not fall linearly with but faster. Finally, if the JT distortions remained frozen below the MIT, then the kinetic factor would pass from 1 to 0 on crossing the MIT and the initial safe estimate of of Eq.(7) with would again be correct.
Once established that the stiffening below the MIT can be consistently explained by vanishing or blocking of dynamic JT distortions , it is necessary to check the compatibility of such disordered distortions above with the structural studies on NdNiO3. We refer to the most recent experiment with synchrotron powder-diffraction,GAA09 where the NiO bond lengths are reported to be Å, and the B-factors of the apical and equatorial O atoms are 0.72 and 1.13 Å2 at room temperature, resulting in thermal plus disordered displacements of 0.1 and 0.12 Å respectively. The JT distortions estimated here of require changes of the bond lengths of Å, which, being dynamically disordered, would appear only in the Debye-Waller factors, and are about half of the B-factor displacements at room temperature in NdNiO3. The JT distortions required to explain the stiffening at the MIT are therefore compatible with the diffraction experiments: above the MIT they are disordered and account for half of the thermal/disordered displacements of the O atoms; below the MIT they are totally or partially absent due to the disproportionation of the JT Ni3+ into Ni3±δ, or simply frozen. This may also explain EXAFS experiments indicating that the splitting of the NiO bond lengths persist also above the MIT in NiO3 with Pr, Nd, Eu.PTR05 This fact has been explained in terms of localized CO phase also in the metallic state, but might be due to the disordered JT distortions. Another case where the anomalously large mean-square displacements suggest JT distortions is a recent neutron diffraction study on PrNiO3.MFL08
IV.9 The peaked softening at
Up to now we dealt with the steplike stiffening below the MIT, which however is accompanied by a peaked softening and absorption. The narrow shape of such an anomaly suggests that it is due to fluctuations associated with the MIT, but the absorption is almost independent of frequency, while the critical absorption is expected to be proportional to it.Lut07
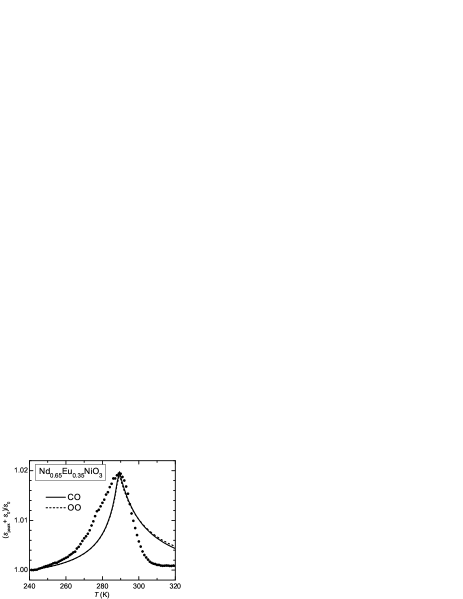
The real part of the peak, corresponding to curve 3 in Fig. 3, is plotted in Fig. 4 as , cleared of the step and temperature dependent part of the background. We tried to fit with the expressions appropriate for CO and OO, namely where is given by Eq. (5) above and in Appendix B in the low temperature phase. The parameters were K, K and , for both cases. The resulting curves, very close to each other, fit very poorly the experimental data. In particular, the observed peak is steeper in the high temperature side, while the fitting curves are steeper in the low temperature phase, as expected. This discrepancy cannot be accounted for by relaxation of domain walls in the low temperature phase, since relaxations depend on the measuring frequency and the anomaly we observe does not. The failure of reproducing the peaked component as softening from OO or CO should be considered as an indication that the origin of the peak is different and we leave it as an open question.
V Conclusions
We measured the complex dynamic Young’s modulus of NdNiO3 and Nd0.65Eu0.35NiO3, in order to study the elastic anomalies associated with the MIT and magnetic transition. The main features are a sharp stiffening of below the MIT, perfectly reproducible during cooling and heating in Nd0.65Eu0.35NiO3 and with a broad hysteresis in NdNiO3, accompanied by a narrow dip at the MIT. The change of the MIT between first- and second-order character at the two compositions agrees with the known phase diagram of NiO3 as a function of the size. The differences with respect to elasticity measurements on Mn perovskites are the absence of precursor softening associated with the MIT, the sharpness of the transition during heating or when it is second order, and the broadness of the hysteresis when it is first order. Both the narrow softening at the MIT and the stiffening below it seem not to be associated with spin ordering, which in the Eu-doped sample occurs at a temperature lower than the MIT.
By comparing cooling and heating runs, it was possible to separate the steplike stiffening from the other anomalies, which present similarities with the excess specific heat, and whose relationship with spin and charge order have been briefly considered. A fit of the dip at the MIT in terms of CO has been made, but its quality is too poor to draw a conclusion.
In order to explain the rather unusual steplike stiffening, possible mechanisms producing elastic anomalies at magnetic, charge order and orbital order transitions have been considered, and it is concluded that the stiffening is due to the disappearance or to freezing in the insulating phase of dynamic JT distortions, due to the charge disproportionation and ordering that accompanies the MIT and transforms JT active Ni3+ into Ni3±δ. The driving force for the MIT is not orbital ordering or any mechanism linearly coupled to strain, in view of the absence of precursor softening. This is in agreement with the idea that the MIT is caused by the opening of a gap when the orbital overlap drops below a threshold during cooling. In fact, such a mechanism depends only on the different thermal expansivities of the O and NiO bonds, and does not produce softening. The fluctuating tetragonal/orthorhombic Jahn-Teller distortion of the NiO6 octahedra necessary to justify the observed jump in the elastic modulus is estimated as and the compatibility of such a requirement with other structural studies is discussed.
Acknowledgments
The authors thank Prof. Marcia T. Escote and Fenelon M. Pontes for the preparation of the samples. F.C. wishes to thank Mr. P.M. Latino and F. Corvasce for their technical assistance in the experiments. This work was partially supported by the Brazil agencies FAPESP and CNPq.
V.1 Appendix A
We determine the factor that connects the amplitude of softening in Eq. (6) to the anisotropy of the elastic quadrupole tensor of the octahedral distortions . This can be done by evaluating the relaxation of the reciprocal of the Young’s modulus, , along a generic direction after application of a uniaxial stress and then performing the angular average of the relaxation strength, , over , in order to obtain an approximation of the polycrystalline average. It is convenient to decompose stress and strain into an orthonormal basis adapted to the cubic symmetryLB78
| (11) | |||||
| (18) |
where is the dilatation (irreducible representation ), and tetragonal and orthorhombic shears of type , and the three shears of type do not enter in the calculation, since they are orthogonal to the JT distortion. The generic strain can be decomposed as , or explicitly with components , the scalar product being defined as Tr. Analogously, the uniaxial stress along is decomposed as
Thanks to the orthonormality of the only the two components and will couple with and and we write them as
with
| (19) | |||||
The elastic quadrupoles of the two JT states are written as
where gives the strength of the distortion.
The application of changes their elastic energies by and their populations,
and change as , where it is used . This change of populations results in a change of the anelastic strain
. The uniaxial component of parallel to is , and using Eq. (19) or , the relaxation of the Young’s modulus along is
A simple formula for the polycrystalline average of the relaxation strength is obtained from the Reuss approximation of uniform stress over the grains,NB72 taking the angular average where the anisotropy of the material is neglected. By using Eq. (19) and , , one finally obtains
It is possible to introduce a mixing of the two normalized symmetry strains, due to hybridisation with the O orbitals and delocalisation,BA04 by setting and similarly for with . In this case, in the above formulas should be replaced by , but from anelastic measurements it is not possible to evaluate and independently, and we assume .
V.2 Appendix B
The softening in Eq. (5) is valid above the CO or OO transition temperature; below that temperature, the restiffening depends on the precise nature of the transition. In the simplest cases of doublet OO,Mel76 the susceptibility below is given by
where is the mean field felt by each ion, acting as order parameter, and is solution of the self-consistent equation
For CO, consider the Landau expansion in terms of powers of the charge fluctuation order parameter, as in Ref. [GL03, ] but limiting to the case that only one order parameter is relevant. Than the free energy is written as
where . Solving the equilibrium conditions and one finds with , . The renormalized elastic constant is then
where can be obtained by derivating with respect to the equation :
When it is and we obtain Eq. (5) as before, here rewritten as
In the CO phase, we obtain
These formulas have been used for the fits in Fig. 4.
References
- (1) G. Catalan, Phase Trans. 81, 729 (2008).
- (2) Y. Bodenthin, U. Staub, C. Piamonteze, M. García-Fernández, M.J. Martínez-Lope and J.A. Alonso, J. Phys.: Condens. Matter 23, 036002 (2011).
- (3) S. B. Lee, R. Chen and L. Balents, Phys. Rev. Lett. 106, 016405 (2011).
- (4) J.B. Torrance, P. Lacorre, A.I. Nazzal, E.J. Ansaldo and Ch. Niedermayer, Phys. Rev. B 45, 8209 (1992).
- (5) M. Imada, A. Fujimori and Y. Tokura, Rev. Mod. Phys. 70, 1039 (1998).
- (6) M. Tachibana, T. Yoshida, H. Kawaji, T. Atake and E. Takayama-Muromachi, Phys. Rev. B 77, 094402 (2008).
- (7) M.L. Medarde, J. Phys.: Condens. Matter 9, 1679 (1997).
- (8) J.A. Alonso, J.L. García-Muñoz, M.T. Fernández-Díaz, M.A.G. Aranda, M.J. Martínez-Lope and M.T. Casais, Phys. Rev. Lett. 82, 3871 (1999).
- (9) J.L. García-Muñoz, M.A.G. Aranda, J.A. Alonso and M.J. Martínez-Lope, Phys. Rev. B 79, 134432 (2009).
- (10) J.A. Alonso, M.J. Martínez-Lope, G. Demazeau, M.T. Fernández- Díaz, I.A. Presniakov, V.S. Rusakov, T.V. Gubaidulina and A.V. Sobolev, Dalton Trans. 2008, 6584.
- (11) U. Staub, G.I. Meijer, F. Fauth, R. Allenspach, J.G. Bednorz, J. Karpinski, S.M. Kazakov, L. Paolasini and F. d’Acapito, Phys. Rev. Lett. 88, 126402 (2002).
- (12) J.E. Lorenzo, J.L. Hodeau, L. Paolasini, S. Lefloch, J.A. Alonso and G. Demazeau, Phys. Rev. B 71, 045128 (2005).
- (13) V. Scagnoli, U. Staub, M. Janousch, A.M. Mulders, M. Shi, G.I. Meijer, S. Rosenkranz, S.B. Wilkins, L. Paolasini, J. Karpinski, S.M. Kazakov and S.W. Lovesey, Phys. Rev. B 72, 155111 (2005).
- (14) V. Scagnoli, U. Staub, A.M. Mulders, M. Janousch, G.I. Meijer, G. Hammerl, J.M. Tonnerre and N. Stojic, Phys. Rev. B 73, 100409 (2006).
- (15) S. Di Matteo, J. Phys.: Conf. Series 190, 012008 (2009).
- (16) I.I. Mazin, D.I. Khomskii, R. Lengsdorf, J.A. Alonso, W.G. Marshall, R.M. Ibberson, A. Podlesnyak, M.J. Martínez-Lope and M.M. Abd-Elmeguid, Phys. Rev. Lett. 98, 176406 (2007).
- (17) J.-G. Cheng, J.-S. Zhou, J.B. Goodenough, J.A. Alonso and M.J. Martinez-Lope, Phys. Rev. B 82, 085107 (2010).
- (18) J.-S. Zhou, J.B. Goodenough and B. Dabrowski, Phys. Rev. B 67, 020404 (2003).
- (19) S.-J. Kim, G. Demazeau, I. Presniakov, K. Pokholok, A. Baranov, A. Sobolev, D. Pankratov and N. Ovanesyan, Phys. Rev. B 66, 014427 (2002).
- (20) I. Presniakov, G. Demazeau, A. Baranov, A. Sobolev and K. Pokholok, Phys. Rev. B 71, 054409 (2005).
- (21) A. Caytuero, H. Micklitz, F.J. Litterst, E.M. Baggio-Saitovitch, M.M. Abd-Elmeguid and J.A. Alonso, Phys. Rev. B 74, 094433 (2006).
- (22) A. Caytuero, H. Micklitz, M.M. Abd-Elmeguid, F.J. Litterst, J.A. Alonso and E.M. Baggio-Saitovitch, Phys. Rev. B 76, 193105 (2007).
- (23) C. Piamonteze, H.C.N. Tolentino, A.Y. Ramos, N.E. Massa, J.A. Alonso, M. J. Martínez-Lope and M.T. Casais, Phys. Rev. B 71, 012104 (2005).
- (24) P. Kalyani and N. Kalaiselv, Sci. Technol. Adv. Mater. 6, 689 (2005).
- (25) J.-H. Chung, Th. Proffen, S. Shamoto, A.M. Ghorayeb, L. Croguennec, W. Tian, B.C. Sales, R. Jin, D. Mandrus and T. Egami, Phys. Rev. B 71, 064410 (2005).
- (26) A. Rougier, C. Delmas and A.V. Chadwick, Solid State Commun. 94, 123 (1995).
- (27) H. Hazama, T. Goto, Y. Nemoto, Y. Tomioka, A. Asamitsu and Y. Tokura, Phys. Rev. B 62, 15012 (2000).
- (28) H. Hazama, T. Goto, Y. Nemoto, Y. Tomioka, A. Asamitsu and Y. Tokura, Phys. Rev. B 69, 064406 (2004).
- (29) V.B. Barbeta, R.F. Jardim, M.S. Torikachvili, M.T. Escote, F. Cordero, F.M. Pontes and F. Trequattrini, J. Appl. Phys. 109, 07E115 (2011).
- (30) M.T. Escote, A.M.L. da Silva, J.R. Matos and R.F. Jardim J. Solid State Chem. 151, 298 (2000).
- (31) A.S. Nowick and B.S. Berry, Anelastic Relaxation in Crystalline Solids. (Academic Press, New York, 1972).
- (32) M. Asmani, C. Kermel, A. Leriche and M. Ourak, J. Eur. Ceram. Soc. 21, 1081 (2001).
- (33) R.A. Dorey, J.A. Yeomans and P.A. Smith, J. Eur. Ceram. Soc. 22, 403 (2002).
- (34) M.T. Escote, V.B. Barbeta, R.F. Jardim and J. Campo, J. Phys.: Condens. Matter 18, 6117 (2006).
- (35) M.E. Lines, Phys. Rep. 55, 133 (1979).
- (36) L.R. Testardi, Phys. Rev. B 12, 3849 (1975).
- (37) R. Klingeler, J. Geck, R. Gross, L. Pinsard-Gaudart, A. Revcolevschi, S. Uhlenbruck and B. Büchner, Phys. Rev. B 65, 174404 (2002).
- (38) J. Blasco, M. Castro and J. Garcia, J. Phys.: Condens. Matter 6, 5875 (1994).
- (39) J. Pérez, J. Blasco, J. García, M. Castro, J. Stankiewicz, M.C. Sánchez and R.D. Sánchez, J. Magn. Magn. Mater. 196-197, 541 (1999).
- (40) C.X. Chen, R.K. Zheng, T. Qian, Y. Liu and X.G. Li, J. Phys. D: Appl. Phys. 38, 807 (2005).
- (41) S. Seiro, H.R. Salva, M. Saint-Paul, A.A. Ghilarducci, P. Lejay, P. Monceau, M. Nunez-Regueiro and A. Sulpice, J. Phys.: Condens. Matter 14, 3973 (2002).
- (42) S. Zvyagin, H. Schwenk, B. Lüthi, K.V. Kamenev, G. Balakrishnan, D. McK. Paul, V.I. Kamenev and Yu.G. Pashkevic, Phys. Rev. B 62, 6104 (2000).
- (43) J.-S. Zhou, J.B. Goodenough, B. Dabrowski, P.W. Klamut and Z. Bukowski, Phys. Rev. Lett. 84, 526 (2000).
- (44) W. Rehwald, Adv. Phys. 22, 721 (1973).
- (45) A. Bulou, M. Rousseau and J. Nouet, Key Eng. Mater. 68, 133 (1992).
- (46) M.A. Carpenter and E.H.K. Salje, Eur. J. Mineral. 10, 693 (1998).
- (47) T. Goto and B. Lüthi, Adv. Phys. 52, 67 (2003).
- (48) B. Lüthi, Physical Acoustics in the Solid State. Springer Series in Solid-State Sciences. (Springer, Berlin, 2007).
- (49) M. Long, Jr., A.R. Wazzan and R. Stern, Phys. Rev. 178, 775 (1969).
- (50) U. Kawald, O. Mitze, H. Bach, J. Pelz and G.A. Saunders, J. Phys.: Condens. Matter 6, 9697 (1994).
- (51) S. Morita, H. Higaki, I. Ishii, M. Takemura, F. Iga, T. Takabatake, M. Tsubota and T. Suzuki, Physica B 383, 43 (2006).
- (52) M. Poirier, F. Laliberte, L. Pinsard-Gaudart and A. Revcolevschi, Phys. Rev. B 76, 174426 (2007).
- (53) R.L. Melcher, Physical Acoustics. ed. by W.P. Mason and R.N. Thurston, p. 1 (Academic Press, New York, 1976).
- (54) F. Cordero, Phys. Rev. B 47, 7674 (1993).
- (55) H. Köppel, D.R. Yarkony and H. Barentzen, The Jahn-Teller Effect - Fundamentals and Implications for Physics and Chemistry. (Springer, Heidelberg, 2009).
- (56) G. Leibfried and N. Breuer, Point Defects in Metals I. (Springer, Berlin, 1978).
- (57) O.G. Brandt and C.T. Walker, Phys. Rev. 170, 528 (1968).
- (58) K.I. Kugel and D.I. Khomskii, Sov. Phys. Usp. 25, 231 (1982).
- (59) M. Medarde, M.T. Fernández-Díaz and Ph. Lacorre, Phys. Rev. B 78, 212101 (2008).
- (60) N. Binggeli and M. Altarelli, Phys. Rev. B 70, 085117 (2004).