FIR measurements of Ly- emitters at z1.0: dust attenuation from PACS-Herschel
Abstract
One remaining open question regarding the physical properties of Ly emitters (LAEs) is their dust content and its evolution with redshift. The variety of results is large and with those reported by now is difficult to establish clear relations between dust, other fundamental parameters of galaxies (star-formation rate, metallicity or age) and redshift. In this Letter, we report Herschel PACS-100m, PACS-160m and Spitzer MIPS-24m detections of a sample of spectroscopically GALEX-selected LAEs at z0.3 and 1.0. Five out of ten and one out of two LAEs are detected in, at least, one PACS band at z0.3 and 1.0, respectively. These measurements have a great importance given that they allow us to quantify, for the first time, the dust content of LAEs from direct FIR observations. MIPS-24m detections allow us to determine IR properties of the PACS-undetected LAEs. We obtain that mid-IR/FIR detected star-forming (SF) LAEs at z0.3 have dust content within 0.75 2.0, with a median value of A1.1. This range broadens out to 0.75 2.5 when considering those LAEs at z1.0. Only one SF LAE is undetected both in MIPS-24m and PACS, with 0.75. These results seem to be larger than those reported for high-redshift LAEs and, therefore, although an evolutionary trend is not clearly seen, it could point out that low-redshift LAEs are dustier than high-redshift ones. However, the diverse methods used could introduce a systematic offset in the results.
Subject headings:
galaxies: evolution — galaxies: stellar content — infrared: galaxies — ultraviolet: galaxies1. Introduction
Ly emitters (LAEs) have been proved to be of great importance in the study of the formation and evolution of galaxies through cosmic time. At 2z7, a large number of candidates have been found, mainly via the narrow or intermediate band technique in the optical/NIR wavelength range (Ouchi et al., 2008; Cowie & Hu, 1998; Gronwall et al., 2007; Guaita et al., 2010; Shioya et al., 2009; Murayama et al., 2007; Nilsson et al., 2009; Fujita et al., 2003; Bongiovanni et al., 2010). At z2, the LAEs catalogued up to now have been found by spectroscopic surveys using the Galaxy Evolution Explorer (GALEX, Martin et al., 2005). The selection technique is based on looking for a Ly line in the UV spectra of objects with a measured UV continuum (Deharveng et al., 2008; Cowie et al., 2010).
Despite of the large number of LAE candidates found at different redshifts, their physical properties and their evolution with cosmic time are not completely understood yet. Moreover, the relation between LAEs and other kind of high redshift galaxies, such as Lyman break galaxies (LBGs) or distant red galaxies (DRGs), remains unclear. Some studies have suggested that the stellar populations of LAEs exhibit a double nature, some being old and massive and other young and less massive (Gawiser et al., 2006; Lai et al., 2008; Ono et al., 2010). However, recent studies have proved that stellar populations of LAEs vary continuously and smoothly over a wide range, conforming a big zoo of galaxies (Oteo et al. 2011, submitted; Nilsson et al., 2011).
One remaining open question is whether LAEs are primitive and dust-free objects, evolved and dusty, or present a wide range of dust attenuation. The Ly line has a resonant nature and, therefore, the probability of being absorbed by the interstellar medium (ISM) even before leaving out the host galaxy is quite high. Due to that, it was initially thought that LAEs found via a narrow band technique should be young and dust free objects, allowing the Ly line to appear in emission. However, Neufeld (1991) proposed a scenario where the Ly equivalent width could be enhanced by the presence of dust when it resides in cold and neutral clumps located within an ionized ISM. Actually, some studies (Finkelstein et al., 2009a, c; Blanc et al., 2010) have observationally confirmed this hypothesis, opening the possibility of finding the Ly emission in non primordial galaxies at different redshifts. The dust content in LAEs has been studied in a wide range of redshifts and different results have been found, from dust-free objects to low, moderate, and even high dust content. In Table 1, some results on the study of dust attenuation in LAEs at different redshifts are summarized.
Most previous works have studied the dust attenuation in LAEs by fitting the UV and optical rest-frame spectral energy distribution (SED) with stellar population templates, mainly Bruzual & Charlot (2003) (BC03) ones, and assuming the dust attenuation law of Calzetti (1997). However, both dust and old stars can redden the rest-frame integrated UV continuum, varying the expected colors from the dust-free scenario. UV and optical photons which are absorbed by dust are reemitted in the FIR region. Therefore, the most accurate way to study the dust properties of high redshift galaxies is observing the dust emission in the FIR. Finkelstein et al. (2009b) and Dayal et al. (2010) studied the expected detection of dust emission from LAEs at z4 and z6, respectively, finding that a large percentage of them at those redshifts should be detected in only a few hours with ALMA. Finkelstein et al. (2009b) also found that LBGs are 60% more likely to be detected than LAEs, meaning that they are dustier objects and showing a possible difference between the two populations. However, some recent studies did not find FIR counterparts for LBGs z3, characterizing their FIR SED only with stacked photometry (Magdis et al., 2010; Rigopoulou et al., 2010). For LAEs, Bongiovanni et al. (2010) reported the detection in the FIR of 3 LAEs at z2.3 selected from the ALHAMBRA survey (Moles et al., 2008), being their optical to mid-IR SED well fitted by AGN-like templates of Polletta et al. (2007). Oteo et al. (2011a, submitted), also found FIR counterparts for 5 spectroscopically confirmed LAEs at z2.5. In this case, according to their optical spectra, only one is an AGN, and the other four are star-forming (SF) LAEs. All of these FIR-detected LAEs resulted to be (U)LIRGs candidates and, therefore, red and dusty objects, despite having the Ly line in emission and with large equivalent widths. Chapman et al. (2005) also found evidences of the Ly emission in a sample of sub-mm galaxies detected in 850m, being most of them (U)LIRGs candidates too.
Until now, few FIR counterparts for LAEs at z2 have been reported, and for those LAEs with FIR counterparts, an extensive analysis of their FIR properties has not been done. In this letter, we report the FIR detections of a sample of LAEs at z0.3 and z1.0 by using data coming from Photodetector Array Camera and Spectrometer (PACS, Poglitsch et al., 2010) on board Herschel Space Observatory. These FIR measurements, combined with UV information, enable us to determine their dust content in an accurate way without the uncertainties coming from the properties of the dust itself, as its emission in the FIR, missing in the optical methods.
This Letter is organized as follows: In Sections 2 and 3 we present the LAE sample and the FIR data used, respectively. In Section 4 we report the FIR counterparts of our LAEs and in Section 5 we study their dust attenuation, comparing them with previous results. In Section 6, the main conclusions of our work are described.
Throughout this work we assume a flat universe with , and all magnitudes are listed in the AB system (Oke & Gunn, 1983).
2. LAE sample
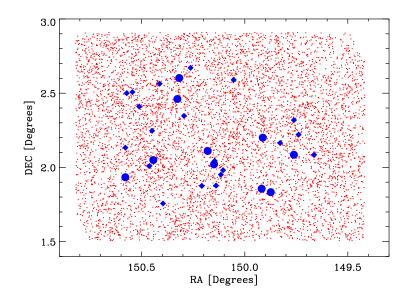
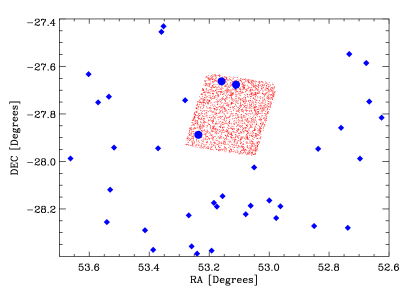
In our analysis, we use an LAE sample selected from Cowie et al. (2010), where the spectra, taken with GALEX NUV and FUV grisms, were selected from the Multimission Archive at STScI (MAST). Cowie et al. (2010) used an automatic search procedure to look for emission lines in the spectra of objects with a measured UV continuum. For each source, a polynomial curve was used for constraining the continuum, and a gaussian profile fit to look for emission lines. Given that the spectra become very noisy at the edges of the spectral range in each channel, only those objects which have the Ly emission in the wavelength ranges 1452.5-1750 Å and 2006-2735 Å for the FUV and NUV grisms, respectively, were selected. In the redshift space, this means that the sources are located within z=0.195-0.44 (z0.3 sample) and z=0.65-1.25 (z1.0 sample) in the FUV and NUV spectra, respectively. Both samples are nearly complete to an NUV limiting magnitude of 21.5 and have Ly luminosity limits of 5 and 1 erg cm-1s-1 at z0.3 and 1.0, respectively. LAEs were classified as AGN or star-forming (SF) galaxies according to the width and shape of the Ly line and the presence or absence of AGN ionization lines in the UV spectra. Figure 1 shows the spatial distribution of GALEX-selected LAEs in both COSMOS and GOODS-South fields.
3. FIR data
GOODS-South and COSMOS fields have been observed with PACS on board Herschel in the framework of PACS Evolutionary Probe project (PEP, PI D. Lutz). PEP is the Herschel Guaranteed Time Key-Project to obtain the best profit for studying FIR galaxies evolution from Herschel instrumentation (Lutz et al. 2011, in prep). For both fields, PACS-100m and PACS-160m observations are available, with 3 limiting fluxes of (1.1, 5.0) in PACS-100m and (2.0, 11.0) in PACS-160m in (GOODS-South, COSMOS). PACS-100m and PACS-160m bands cover the FIR wavelength ranges 80-130m and 130-210m, respectively. Two kind of catalogues have been built: blind and with MIPS-24m position priors by using Le Floc’h et al. (2009) and Magnelli et al. (2011) catalogs in COSMOS and GOODS-South, respectively. In order to have as much FIR information as possible and more reliability in the identification of the sources, we use the catalogs extracted with MIPS-24m priors. Data reduction, catalogs construction and simulations, aimed at deriving completeness, fraction of spurious sources and photometric reliability, are described in Lutz et al. (2011, in prep.).
Figure 1 also shows the PACS-Herschel sources extracted with 24m positions priors. It can be seen that PACS observations in COSMOS field cover the whole region where GALEX-selected LAEs are located, whereas the surveyed area by PACS in GOODS-South only covers a little portion of GALEX observations. In this sense, 28 and 4 GALEX-selected LAEs are within the PACS surveyed area in COSMOS and GOODS-South, respectively. Table 2 summarizes the number of GALEX-selected LAEs within the PACS area in both fields.
4. LAEs with FIR counterparts
In order to find out how many LAEs have FIR counterparts we performed a match between GALEX-LAEs coordinates and PACS catalogs in both fields. We look for a possible FIR detection within a radius of 2” around the position of each LAE, since it is the astrometric uncertainty in the position of the sources. With this procedure, we find that a noticeable fraction of LAEs, mostly above 30%, have PACS-FIR detections in at least one considered PACS band, considering limiting fluxes shown in Sect. 3. In Table 2, the number of PACS detection are also shown, separated by field, redshift and nature of the object (AGN or SF). The percentages of FIR detections are larger in GOODS-South than in COSMOS because of the depth of the observations. If the PACS observation had been in COSMOS as deep as in GOODS-South, a large number of FIR counterparts would have been expected.
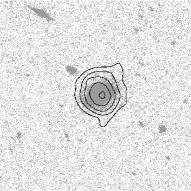
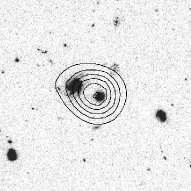
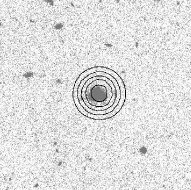
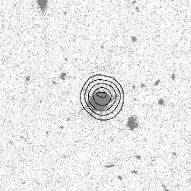
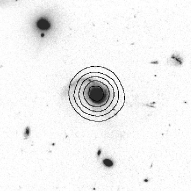
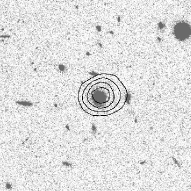
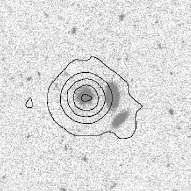
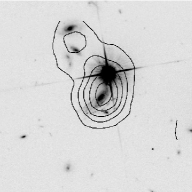
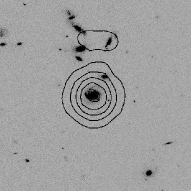
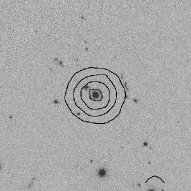
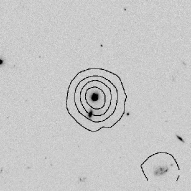
A source confusion analysis is needed to ensure that each FIR detection corresponds to the matched GALEX-selected LAE. We take 30” optical cut-outs around the position of each GALEX-selected LAE and overplot the MIPS-24m contours in order to verify if the detections in each band is related or not to the same object. We use the MIPS-24m contours given that the PACS catalogues are based in 24m positions priors, where the PSF of the observations is 30% narrower than redder bands and, therefore, the accuracy in the positions is better. It can be seen in Figure 2 that each FIR detection reported corresponds to the matched GALEX-LAE.
5. Dust attenuation in star-forming LAEs
The ratio between the total IR and UV luminosities, LIR and LUV, respectively, is directly related to the dust attenuation in galaxies, and calibrations have been already built (Meurer et al., 1999; Buat et al., 2005, 2007). Since all the PACS-detected SF GALEX-LAEs also have UV measurements, we can infer their dust attenuation from direct observations of their FIR SED. We use the NUV band given that, on one hand, it is not contaminated by the Ly emission for those GALEX-LAEs at z0.3 and, on the other hand, it is not affected by the Lyman break for those GALEX-LAEs at z1.0. LUV can be obtained directly from the observed magnitudes in the NUV band, as in Buat et al. (2005). LIR can be calculated by using the calibrations given in Oteo et al. (2011a, submitted) between PACS bands and total infrared luminosities:
| (1) |
| (2) |
where all the luminosities are in solar units and L and L are defined as . PACS-detected LAEs have measurements in 100m and/or 160m. For those detected in both bands, we obtain the by using the calibration in the PACS-160m band, since it is the closest one to the dust emission peak at our redshift ranges and, therefore, produces a more accurate result.
We can also obtain the total IR luminosities, i.e. dust content, for those PACS-undetected but MIPS-24m detected SF GALEX-LAEs by using the Chary & Elbaz (2001) calibrations between the total IR and 15m and 12m luminosities for local galaxies. These wavelengths are within the rest-frame ranges sampled through the MIPS-24m band for LAEs at z0.3 and 1.0, respectively. The applicability of these calibrations to high-redshift galaxies is discussed by Elbaz et al. (2010) who found that, below z1.5, mid-IR extrapolations to the total IR luminosities are correct for SF galaxies below the (U)LIRG regime. The MIPS-24m information was taken from the from S-COSMOS survey (Sanders et al., 2007). Only one object is not detected in that band.
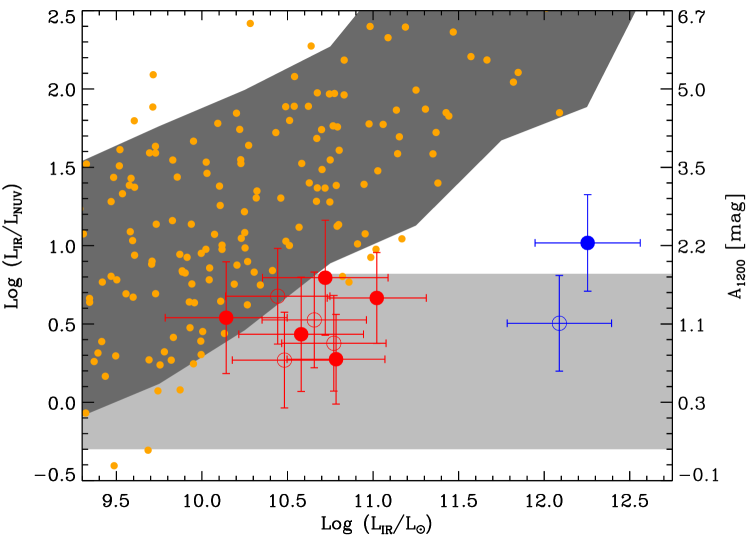
In Figure 3 we plot the ratio LIR/LUV (or, equivalently, dust attenuation) versus LIR of our mid-IR/FIR detected GALEX-LAEs, besides the corresponding data of (Gil de Paz et al., 2007, hereafter G07) for a collection of nearby, SF galaxies. Our LAEs are located in the low-dust regime of the G07 data, indicating that objects exhibiting the Ly line in emission at low and moderate redshift should not be as dusty as the whole population of galaxies at the same redshift. The dust attenuation in our mid-IR/FIR-detected LAEs at z0.3 ranges within 0.751.8 mag, with a median value of 1.1 mag. This range broadens up to 2.5 when considering the z1.0 LAEs as well. For the GALEX-LAE undetected both in MIPS-24m and PACS we assume an upper limit in its dust attenuation equal to the minimum value obtained for the mid-IR/FIR detected GALEX-LAEs: .
Finkelstein et al. (2011) studied dust content in LAEs at z0.3 by using SED fitting and Balmer decrement. They derived an attenuation in the stellar continuum from Balmer decrement ranging from A0 to 1.8, with a median value of 0.78 mag. These values are in agreement with those found via SED fitting, being most of them within the combined 1 uncertainties. Cowie et al. (2010) obtained dust attenuation from the NUV continuum slope and Balmer decrement of their LAEs at z0.3, obtaining a median value of A2.25 and 1.8, respectively, which are noticeably higher than those reported in Finkelstein et al. (2011). Nilsson & Møller (2009) reported significantly higher values, most of them being A2.0, and as large as 7.5 mag. The results derived here are slightly higher than those derived in Finkelstein et al. (2011), similar to Cowie et al. (2010) values, and lower than those in Nilsson & Møller (2009). These discrepancies may be caused by the different methodologies employed, and even when they are same, the results do not agree quite well, likely due to the low number of objects in each sample.
The dust attenuation values reported up to z2 are similar to those obtained in this work. However, at z3, while there are some measurements of high dust attenuation in high redshift LAEs, the vast majority of the reported extinction measurements are substantially lower than A0.75 and are, in many cases, consistent with essentially no extinction. This could indicate that high redshift LAEs are less dusty than those at lower redshifts. However, note that, overall at the highest redshifts, the number of the studied LAEs at each redshift is low and, therefore, the results are not statistically significant. Furthermore, it is worth noting that SED fitting estimations (sometimes done with stacking analysis), spectroscopic results and IR measurements could produce systematic differences. This means that a possible evolution of dust attenuation with redshift should be taken with caution.
6. Conclusions
In this letter, we have reported the FIR detections of a sample of GALEX-selected LAEs at z0.3 and z1.0. Our main conclusions are as follows:
-
•
We find that a large fraction of LAEs at z0.3 and z1.0 are detected in the FIR. In the worst case, the fraction of FIR detected LAEs is about 15%, although in most cases the fractions are higher than 30%. Therefore, up to z1.0, at least 30% of the LAEs are expected to be detected in the FIR under the depth of the catalogs used. The percentages of MIPS-24m detections are even higher, only one object being undetected in that band.
-
•
Based on direct measurements of the mid-IR/FIR SED, we conclude that the studied SF-LAEs at z0.3 present a wide range of dust attenuation, 0.75A1.8, with median value of 1.1. This range broadens up to 0.75A2.2 when considering LAEs at z1.0. We only find one object, undetected both in MIPS-24m and PACS, whose dust content has an upper limit of 0.75.
-
•
The dust attenuation values derived here are comparable to those reported in previous works up to z2.0, pointing out that there is no significant evolution in dust content in that epoch. At z3, although some works showed the existence of dusty LAEs, most of the extinction measurements are lower than those at z2.0, which could indicate an evolution with redshift. However, the different methods used to derive the results and the low number of LAEs at certain redshifts make the results statistically unsignificant.
References
- Blanc et al. (2010) Blanc, G. A., Adams, J., Gebhardt, K., et al. 2010, ArXiv e-prints
- Bongiovanni et al. (2010) Bongiovanni, A., Oteo, I., Cepa, J., et al. 2010, A&A, 519, L4+
- Bruzual & Charlot (2003) Bruzual, G. & Charlot, S. 2003, MNRAS, 344, 1000
- Buat et al. (2005) Buat, V., Iglesias-Páramo, J., Seibert, M., et al. 2005, ApJ, 619, L51
- Buat et al. (2007) Buat, V., Takeuchi, T. T., Iglesias-Páramo, J., et al. 2007, ApJS, 173, 404
- Calzetti (1997) Calzetti, D. 1997, in American Institute of Physics Conference Series, Vol. 408, American Institute of Physics Conference Series, ed. W. H. Waller, 403–412
- Chapman et al. (2005) Chapman, S. C., Blain, A. W., Smail, I., & Ivison, R. J. 2005, ApJ, 622, 772
- Chary & Elbaz (2001) Chary, R. & Elbaz, D. 2001, ApJ, 556, 562
- Cowie et al. (2010) Cowie, L. L., Barger, A. J., & Hu, E. M. 2010, ApJ, 711, 928
- Cowie & Hu (1998) Cowie, L. L. & Hu, E. M. 1998, AJ, 115, 1319
- Dayal et al. (2010) Dayal, P., Hirashita, H., & Ferrara, A. 2010, MNRAS, 403, 620
- Deharveng et al. (2008) Deharveng, J., Small, T., Barlow, T. A., et al. 2008, ApJ, 680, 1072
- Elbaz et al. (2010) Elbaz, D., Hwang, H. S., Magnelli, B., et al. 2010, A&A, 518, L29+
- Finkelstein et al. (2009a) Finkelstein, S. L., Cohen, S. H., Malhotra, S., & Rhoads, J. E. 2009a, ApJ, 700, 276
- Finkelstein et al. (2011) Finkelstein, S. L., Cohen, S. H., Moustakas, J., et al. 2011, ApJ, 733, 117
- Finkelstein et al. (2009b) Finkelstein, S. L., Malhotra, S., Rhoads, J. E., Hathi, N. P., & Pirzkal, N. 2009b, MNRAS, 393, 1174
- Finkelstein et al. (2009c) Finkelstein, S. L., Rhoads, J. E., Malhotra, S., & Grogin, N. 2009c, ApJ, 691, 465
- Finkelstein et al. (2008) Finkelstein, S. L., Rhoads, J. E., Malhotra, S., Grogin, N., & Wang, J. 2008, ApJ, 678, 655
- Fujita et al. (2003) Fujita, S. S., Ajiki, M., Shioya, Y., et al. 2003, AJ, 125, 13
- Gawiser et al. (2007) Gawiser, E., Francke, H., Lai, K., et al. 2007, ApJ, 671, 278
- Gawiser et al. (2006) Gawiser, E., van Dokkum, P. G., Gronwall, C., et al. 2006, ApJ, 642, L13
- Gil de Paz et al. (2007) Gil de Paz, A., Boissier, S., Madore, B. F., et al. 2007, ApJS, 173, 185
- Gronwall et al. (2007) Gronwall, C., Ciardullo, R., Hickey, T., et al. 2007, ApJ, 667, 79
- Guaita et al. (2011) Guaita, L., Acquaviva, V., Padilla, N., et al. 2011, ArXiv e-prints
- Guaita et al. (2010) Guaita, L., Gawiser, E., Padilla, N., et al. 2010, ApJ, 714, 255
- Lai et al. (2007) Lai, K., Huang, J., Fazio, G., et al. 2007, ApJ, 655, 704
- Lai et al. (2008) Lai, K., Huang, J., Fazio, G., et al. 2008, ApJ, 674, 70
- Le Floc’h et al. (2009) Le Floc’h, E., Aussel, H., Ilbert, O., et al. 2009, ApJ, 703, 222
- Magdis et al. (2010) Magdis, G. E., Elbaz, D., Hwang, H. S., et al. 2010, ApJ, 720, L185
- Magnelli et al. (2011) Magnelli, B., Elbaz, D., Chary, R. R., et al. 2011, VizieR Online Data Catalog, 352, 89035
- Martin et al. (2005) Martin, D. C., Fanson, J., Schiminovich, D., et al. 2005, ApJ, 619, L1
- Meurer et al. (1999) Meurer, G. R., Heckman, T. M., & Calzetti, D. 1999, ApJ, 521, 64
- Moles et al. (2008) Moles, M., Benítez, N., Aguerri, J. A. L., et al. 2008, AJ, 136, 1325
- Murayama et al. (2007) Murayama, T., Taniguchi, Y., Scoville, N. Z., et al. 2007, ApJS, 172, 523
- Neufeld (1991) Neufeld, D. A. 1991, ApJ, 370, L85
- Nilsson & Møller (2009) Nilsson, K. K. & Møller, P. 2009, A&A, 508, L21
- Nilsson et al. (2007) Nilsson, K. K., Møller, P., Möller, O., et al. 2007, A&A, 471, 71
- Nilsson et al. (2011) Nilsson, K. K., Östlin, G., Møller, P., et al. 2011, A&A, 529, A9+
- Nilsson et al. (2009) Nilsson, K. K., Tapken, C., Møller, P., et al. 2009, A&A, 498, 13
- Oke & Gunn (1983) Oke, J. B. & Gunn, J. E. 1983, ApJ, 266, 713
- Ono et al. (2010) Ono, Y., Ouchi, M., Shimasaku, K., et al. 2010, MNRAS, 402, 1580
- Ouchi et al. (2008) Ouchi, M., Shimasaku, K., Akiyama, M., et al. 2008, ApJS, 176, 301
- Pirzkal et al. (2007) Pirzkal, N., Malhotra, S., Rhoads, J. E., & Xu, C. 2007, ApJ, 667, 49
- Poglitsch et al. (2010) Poglitsch, A., Waelkens, C., Geis, N., et al. 2010, ArXiv e-prints
- Polletta et al. (2007) Polletta, M., Tajer, M., Maraschi, L., et al. 2007, ApJ, 663, 81
- Rigopoulou et al. (2010) Rigopoulou, D., Magdis, G., Ivison, R. J., et al. 2010, MNRAS, L154+
- Sanders et al. (2007) Sanders, D. B., Salvato, M., Aussel, H., et al. 2007, ApJS, 172, 86
- Shioya et al. (2009) Shioya, Y., Taniguchi, Y., Sasaki, S. S., et al. 2009, ApJ, 696, 546
| Reference | redshift | Dust attenuation [mag] | Method |
|---|---|---|---|
| Finkelstein et al. (2009a) | 0.3 | 0.0 2.0 | TF-BC03 |
| Finkelstein et al. (2011) | 0.3 | 0.4 1.6 | Spec |
| Nilsson & Møller (2009) | 0.3 | 2.0 7.5 | IRAC-8m measurements |
| Cowie et al. (2010) | 0.3 | A1200Å 2.25 | UV continuum slope |
| Cowie et al. (2010) | 0.3 | A1200Å 1.8 | Spec |
| Guaita et al. (2011) | 2.1 | 0.0 2.41 | TF-BC03 |
| Nilsson et al. (2011) | 2.3 | 0.0 10.0 | TF-BC03 |
| Nilsson & Møller (2009) | 2.3 | 4.0 8.0 | MIPS-24m measurements |
| Gawiser et al. (2007) | 3.1 | A1200Å | TF-BC03 & Stacked |
| Lai et al. (2008) | 3.1 | A1200Å | TF-BC03 & Stacked |
| Ono et al. (2010) | 3.1 | A1200Å | TF-BC03 & Stacked |
| Ono et al. (2010) | 3.1 | 0.0 5.6 | TF-BC03 |
| Nilsson et al. (2007) | 3.15 | A1200Å | TF-BC03 & Stacked |
| Ono et al. (2010) | 3.7 | A1200Å | TF-BC03 & Stacked |
| Ono et al. (2010) | 3.7 | 0.3 5.4 | TF-BC03 |
| Finkelstein et al. (2008) | 4.4 | 0.4 1.8 | TF-BC03 |
| Finkelstein et al. (2009c) | 4.5 | 0.3 4.5 | TF-BC03 |
| Pirzkal et al. (2007) | 5.0 | 0.0 1.8 | TF-BC03 |
| Lai et al. (2007) | 5.7 | 1.20 1.81 | TF-BC03 |
| Field | Type | z0.3 | z1.0 |
|---|---|---|---|
| COSMOS | AGN | 3 (1) | 14 (2) |
| COSMOS | SF | 9 (4) | 2 (1) |
| GOODS-South | AGN | 0 (0) | 3 (2) |
| GOODS-South | SF | 1 (1) | 0 (0) |