Two-Dimensional Spectral Interferometry using the Carrier-Envelope Phase
Abstract
Two- and multi-dimensional spectroscopy is used in physics and chemistry to obtain structural and dynamical information that would otherwise be invisible by the projection into a one-dimensional data set such as a single emission or absorption spectrum. Here, we introduce a qualitatively new two-dimensional spectroscopy method by employing the carrier-envelope phase (CEP). Instead of measuring spectral vs. spectral information, the combined application of spectral interferometry and CEP control allows the measurement of otherwise inseparable temporal events on an attosecond time scale. As a specific example, we apply this general method to the case of attosecond pulse train generation, where it allows to separate contributions of three different sub-cycle electron quantum paths within one and the same laser pulse, resulting in a better physical understanding and quantification of the transition region between cutoff and plateau harmonics. The CEP-dependent separation in time between two full-cycle spaced attosecond pulses was determined to modulate by attoseconds.
pacs:
42.62.Eh, 32.80.Wr, 78.47.J-, 42.65.KyTwo-dimensional (2D) spectroscopy is a powerful tool to study the energy-level structure, dynamics and couplings among quantum states in complex systems Tanimura and Mukamel (1993); Asplund et al. (2000); Jonas (2003). The measurements typically involve the acquisition of optical spectra as a function of dynamical (time-delay) coordinates in a multi-pulse nonlinear optical excitation at perturbative intensities. One of the time-delays is then converted into the spectral domain via Fourier transform and spectral interferometry Tokunaga et al. (1992); Geindre et al. (1994), resulting in two-dimensional spectral vs. spectral contour plots that, for instance, allow separation of homogeneous from inhomogeneous spectral linewidths and the measurement of interstate coupling of electronic excitations. The technique was recently applied to large biomolecules, where complex energy-flow pathways could be visualized on an ultrafast timescale, such as the energy transfer in a photosynthetic light-harvesting complex Brixner et al. (2005); Engel et al. (2007). The first crucial step in spectral interferometry (employed in heterodyne 2D spectroscopy) is typically the Fourier transformation of a spectral interferogram into a ’quasi-time’ domain to separate and retrieve the phase of the modulating component. So far, however, 2D spectroscopy methods have not been conceived to separate and analyze electronic events on attosecond time scales in strong few-cycle laser fields.
In such intense few-cycle laser fields, by contrast, carrier-envelope-phase (CEP) control has been shown to be an important parameter, as it allows to steer electron wavepackets on their natural attosecond timescale Baltuška et al. (2003) due to the precise temporal definition of an electromagnetic field evolution. One problem in such experiments is that typically an electron wavefunction follows several quantum trajectories or transition pathways (e.g. ionizing at several peaks of the absolute electric field) and the experimentally observed response is a coherent sum over all these trajectories. Typically, electronic events separated by a half- or full-optical cycle interfere with each other and prevent an isolated observation of distinct trajectories or their quantum phases.
Here, we present a new kind of 2D spectroscopy to quantitatively separate such intra-pulse strong-field processes on an attosecond time scale by combining the method of CEP control with spectral interferometry. This combination of techniques allows direct in-situ and quantitative temporal access to near-periodic strong-field electron dynamics. The resulting CEP-spectral interferometry (CEPSI) data provides additional two-dimensional temporal information in a manner similar (though qualitatively different) to the way 2D spectroscopy allows the extraction of otherwise inseparable spectral features or energy-transfer pathways Brixner et al. (2005); Engel et al. (2007). Here we will apply the CEPSI method to the example where the relative phase contributions of three attosecond electron trajectories (leading to an attosecond pulse train, APT) in a few-cycle pulse can be qualitatively and quantitatively disentangled in their relative timing and phase. However, the method itself can be considered to be general for the study of CEP-dependent interference phenomena and should thus find widespread use in strong-field science and physical-chemistry spectroscopy applications, especially when combined with an additional direct dynamical parameter such as a variable time delay of e.g. a pump and a probe pulse.
APTs were previously reconstructed using cross-correlation techniques between the attosecond pulses and a moderately intense near-infrared (NIR) fundamental laser field Paul et al. (2001); Kienberger et al. (2004) and theoretically developed Muller (2002); Kitzler et al. (2002); Varjú et al. (2005); Mairesse and Quéré (2005), or detected via direct optical interference of two seperately generated APTs Mairesse et al. (2005). An intrinsic property of few-cycle pulse generated APTs is the transistion from the adiabatic to the non-adiabatic regime Salières et al. (1998), where no longer all pulses in the train can be approximated to be equal in shape. This regime has previously been studied by using the non-adiabatic saddle-point approximation Sansone et al. (2004). More recently, a qualitative interpretation of spectral signatures due to interference of only a few attosecond pulses within one single few-cycle laser pulses was discussed Pfeifer et al. (2007); Mansten et al. (2009), however without direct access to the temporal phases and relative timings which define the created APTs. Here, we illustrate the power of the introduced general CEPSI method by separating the phase contributions of individual pulses in an APT, shedding light on the underlying electron trajectory evolution.
In the following we first employ a semi-classical model to describe the CEPSI method for the example of few-pulse APT generation, placing emphasis on the analysis of a non-equally spaced triple pulse. Subsequently we will use this model to analyze and interpret CEP-dependent experimental spectra. Finally, we will discuss the additional physical knowledge gained from our CEPSI method: it allows to connect our results to previously known regimes of attosecond-pulse production, while at the same time provides a better understanding of the spectral transition region between CEP-dependent cutoff harmonics and CEP-independent plateau harmonics.
We start out with a model description of an APT: in the time domain, it can be formally written as a coherent sum of the electric fields of single attosecond pulses
| (1) |
where and are the amplitude and phase of each pulse, and denotes their temporal position. In the spectral domain, interference fringes will enter the intensity distribution whenever the slow varying spectral amplitude functions of different attosecond pulses share a common frequency range. Their intensity modulation can be described as
| (2) |
where is the frequency-dependent spectral phase of the -th pulse and denotes their temporal difference. A Fourier transform of this resulting spectral intensity modulation in Eq. (2) thus gives access to the spectral phase difference . Problems with this method arise whenever multiple contributions are overlapping, as it is the case for an APT with multiple half-cycle spaced () pulses. In this case, the contributions cannot be separated.
In the following, we focus on the specific case of a train of three attosecond pulses generated by (HHG) with a few-cycle strong-field driver pulse to illustrate the method. In that scenario, two temporal contributions exist at roughly the half-cycle spacing. The key idea of the CEPSI method is to separate the two overlapping temporal contributions by varying the CEP. As CEP variation in strong-field processes typically affects the phase of different contributions (e.g. multiphoton transitions Abel et al. (2009) or here, quasi-classical electron trajectories) in a different way, the individual components can be separated.
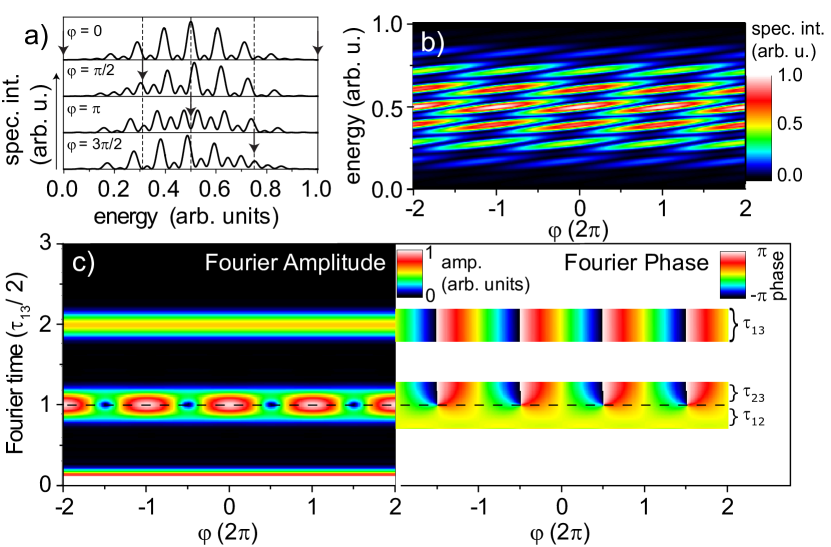
In our illustration model and in analogy to the experimental situation discussed below the temporal spacings and between the three pulses are chosen slightly asymmetrically (), where is on the order of the pulse duration, around 10% of . The temporal phases of the pulses are chosen to be 0 for the first two pulses and for the third pulse. The spectral interference pattern of such a triple pulse is illustrated in Fig. 1a) and b). The spectra consist of alternating major and minor peaks spaced by , in analogy to the diffraction pattern of a spatial triple slit. Additionally, for , a beating with frequency occurs. At the minima of this beating, the role of the major and minor peaks in the interference pattern swap which is marked by the arrows in Fig. 1a). This swapping occurs at different spectral positions, linearly depending on the relative phase of the third pulse with respect to the other two pulses. A Fourier analysis of the complete -dependent interference pattern both in amplitude and phase is shown in Fig. 1c). Now the previously defined relative pulse characteristics can be separated by observing a -dependent amplitude and phase structure, which would not have been possible for a single value of or a -averaged spectrum. The amplitude peak appearing at exhibits the linear phase difference of between the two pulses. The amplitude peaks at and appear very close to each other within their temporal bandwidth. Due to their different -dependence, a minimum appears in the temporal overlap region at , i.e. when the relative phases between the first two and the latter two pulses are out of phase.
For the experiment, few-cycle () laser pulses at 760 nm central wavelength with stable CEP down to are focused, with an spherical mirror, into a mm long cell filled with neon gas at mbar backing pressure. To preferentially phase match short trajectories, the gas cell was placed just after the laser focus Antoine et al. (1996). The generated high-harmonic radiation is transmitted through a pair of thin zirconium metal foils to remove direct and indirect fundamental stray light. The remaining coherent soft-x-ray light is spectrally analyzed with a period free-standing transmission grating and detected with a back-illuminated x-ray-CCD camera.
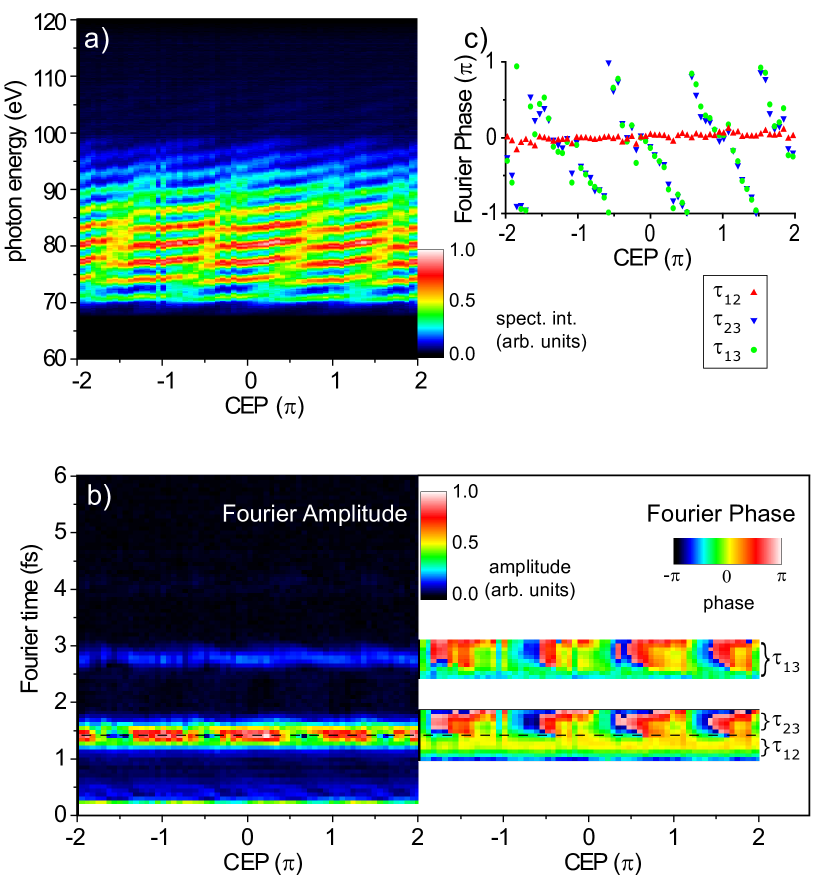
In Fig. 2a), spatially integrated experimental spectra are shown as a function of the CEP. The spectra exhibit interference structures spaced by , the well known odd-harmonic spacing. For the energies above the interference fringes shift linearly from one order to the next within one CEP cycle confirming earlier findings in the harmonic cutoff region Nisoli et al. (2003); Sansone et al. (2004). Interestingly, in the energy region just below the cutoff ( eV), a switching between different harmonic peaks occurs with a change in CEP. Repeating the previously illustrated Fourier analysis on these experimental data (Fig. 2b) results in a close agreement to the previous asymmetric three-pulse toy model, where the CEP now takes the role of the general phase as introduced before. A CEP dependence both for the full-cycle Fourier peak as well as for the upper temporal part of the half-cycle Fourier peak appears, whereas the lower temporal part of this peak shows a constant phase as a function of the CEP. The local minima in the half-cylce Fourier peak in Fig. 2b) occur periodically at CEPs of 0.5 modulo . An integration over the phase for the different Fourier components is shown in Fig. 2c) to extract the different phase evolutions.
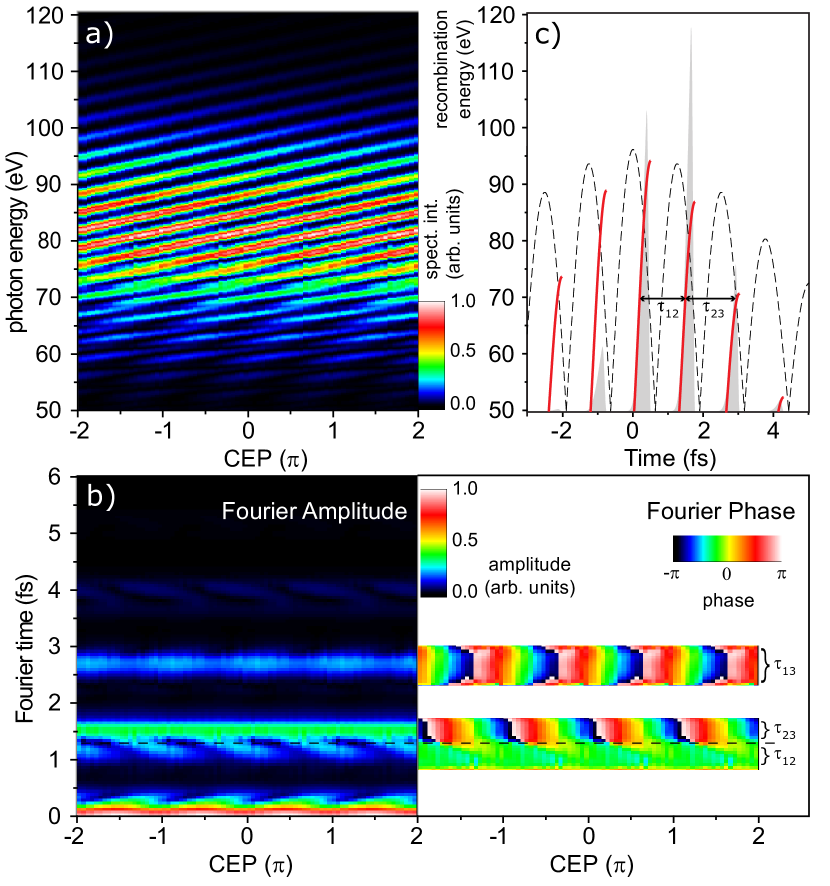
To better understand the quantum-dynamical mechanism behind the formation of this asymmetric triple slit in the time domain, we carried out a quasi-classical strong-field approximation simulation of HHG based on the three-step model Corkum (1993); Lewenstein et al. (1994). Only the short trajectories were considered. A FWHM Gaussian laser pulse centered around with peak electric field strength a.u. was used in the simulations. The simulated harmonic spectra are shown in Fig. 3a). At lower energies around 65 eV, the characteristic switching of the harmonic peaks becomes apparent, in agreement both with the experiment as well as with the presented initial toy model of non-equidistantly spaced triple pulses. At this stage it should be pointed out that propagation effects are not taken into account, which may be the reason behind some slight quantitative disagreement between the experiment and the single-atom simulations.
Knowledge and analysis of the quasi-classical electron trajectories and their recollision energetics allows to trace the origin of the observed triple-pulse behavior, as shown in Fig. 3c): The three most intense pulses exhibit a different temporal spacing at a given photon energy, indicated by the horizontal arrows and . For the two most intense pulses, a photon energy of 65 eV corresponds to their half-cycle-plateau region (strong frequency upchirp of the individual attosecond pulses), whereas the third pulse contributes to this energy out of its half-cycle cutoff region (no frequency chirp near cutoff). The asymmetric temporal spacing of the three pulses thus clearly originates from the nonlinear chirp of the attosecond pulses that arises when the short trajectory of one pulse smoothly transits from its plateau into its cutoff region. It is well known Balcou et al. (1999); Sansone et al. (2004) that the cutoff-harmonic phase depends roughly linearly on intensity while the plateau harmonics for the short trajectory are approximately independent of the intensity. By varying the CEP, we move individual attosecond pulse contributions up and down the envelope of the driver pulse, thus changing the intensity with which they are produced on a sub-cycle (attosecond) time scale. CEPSI thus allows to separate these different phase contributions caused by individual trajectories on a sub-cycle basis, surpassing previous approaches that used direct intensity variation of the entire pulse to extract intensity-dependent phases averaged over all half-cycles of the entire driver pulse. Here, the sub-cycle resolution allowed us to disentangle the trajectories in the transition region from the cutoff to the plateau regime within the driver pulse.
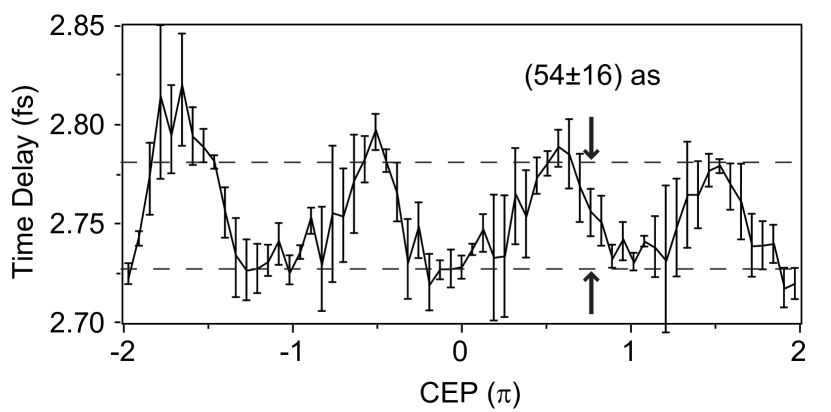
Finally, after CEPSI allowed extracting the qualitative physical mechanism, we now further use it to quantify the CEP-dependent relative group delay between two full-cycle spaced attosecond pulses in the experiment. The full-cycle Fourier peak corresponding to in Fig. 2b) is fitted with a Gaussian function to determine its central position at each value of the CEP. The result is shown in Fig. 4, where a periodic modulation in time delay of can be observed. The minima appear at CEP values where all three pulses are approximately equal in phase, whereas the maxima correspond to CEP values where phase-jumps occur across the half-cycle Fourier peak (compare to Fig. 2). An explanation for this modulation is as follows: For minimal group delays, the corresponding CEP values belong to situations where all three pulses contribute with their plateaus. In contrast, when the group delay is at its maximum, the corresponding attosecond pulse configurations consist of only two pulses within their plateau region, while the third pulse on the trailing edge contributes with its own cutoff region (as indicated in Fig. 3c)), resulting in a larger spacing between pulses 2 and 3.
In conclusion we introduced the combination of CEP sweeping and spectral interferometry (CEPSI) to create a novel sub-cycle multidimensional spectroscopy method. It allows to separate otherwise overlapping quantum paths within the same strong-field driver pulse. Application of this method in HHG allows access to the transition region between the cutoff and plateau part in the spectrum of APTs by qualitatively and quantitatively separating contributions of individual sub-cycle electron trajectories. An asymmetric arrangement of three attosecond pulses could thus be identified and analyzed with respect to its CEP dependence and the variation of the relative timing of the two outermost pulses in the pulse triplet could be measured with sub-20 attosecond precision.
While applied here to the special case of HHG as an illustration example, the method is general and can enhance physical insight on other strong field processes that are known to depend on the CEP within a single pulse, such as (above-threshold) ionization in the multiphoton or tunneling regime, recollision imaging, and electron localization in molecules. In all these processes several different quantum (transition, transport) pathways exist, with their phase depending sensitively on the CEP. In analogy to the high-harmonic case considered here, CEPSI can separate the contributing quantum paths by their phase dependence and thus extract novel physical mechanisms as well as quantify already existing ones at high temporal or spectral resolution.
Financial support from the Max-Planck Research Group program is gratefully acknowledged.
References
- Tanimura and Mukamel (1993) Y. Tanimura and S. Mukamel, J. Chem. Phys. 99, 9496 (1993).
- Asplund et al. (2000) M. C. Asplund, M. T. Zanni, and R. M. Hochstrasser, Proc. Natl. Acad. Sci. U. S. A. 97, 8219 (2000).
- Jonas (2003) D. M. Jonas, Annu. Rev. Phys. Chem. 54, 425 (2003).
- Tokunaga et al. (1992) E. Tokunaga, A. Terasaki, and T. Kobayashi, Opt. Lett. 17, 1131 (1992).
- Geindre et al. (1994) J. P. Geindre, P. Audebert, A. Rousse, F. Falliès, J. C. Gauthier, A. Mysyrowicz, A. D. Santos, G. Hamoniaux, and A. Antonetti, Opt. Lett. 19, 1997 (1994).
- Brixner et al. (2005) T. Brixner, J. Stenger, H. M. Vaswani, M. Cho, R. E. Blankenship, and G. R. Fleming, Nature 434, 625 (2005).
- Engel et al. (2007) G. S. Engel, T. R. Calhoun, E. L. Read, T. K. Ahn, T. Mancal, Y. C. Cheng, R. E. Blankenship, and G. R. Fleming, Nature 446, 782 (2007).
- Baltuška et al. (2003) A. Baltuška, T. Udem, M. Uiberacker, M. Hentschel, E. Goulielmakis, C. Gohle, R. Holzwarth, V. S. Yakovlev, A. Scrinzi, T. W. Hänsch, et al., Nature 421, 611 (2003).
- Paul et al. (2001) P. M. Paul, E. S. Toma, P. Breger, G. Mullot, F. Auge, P. Balcou, H. G. Muller, and P. Agostini, Science 292, 1689 (2001).
- Kienberger et al. (2004) R. Kienberger, E. Goulielmakis, M. Uiberacker, A. Baltuška, V. Yakovlev, F. Bammer, A. Scrinzi, T. Westerwalbesloh, U. Kleineberg, U. Heinzmann, et al., Nature 427, 817 (2004).
- Muller (2002) H. G. Muller, Appl. Phys. B 74, 17 (2002).
- Kitzler et al. (2002) M. Kitzler, N. Milosevic, A. Scrinzi, F. Krausz, and T. Brabec, Phys. Rev. Lett. 88, 173904 (2002).
- Varjú et al. (2005) K. Varjú, Y. Mairesse, P. Agostini, P. Breger, B. Carré, L. J. Frasinski, E. Gustafsson, P. Johnsson, J. Mauritsson, H. Merdji, et al., Phys. Rev. Lett. 95, 243901 (2005).
- Mairesse and Quéré (2005) Y. Mairesse and F. Quéré, Phys. Rev. A 71, 011401 (2005).
- Mairesse et al. (2005) Y. Mairesse, O. Gobert, P. Breger, H. Merdji, P. Meynadier, P. Monchicourt, M. Perdrix, P. Salières, and B. Carré, Phys. Rev. Lett. 94, 173903 (2005).
- Salières et al. (1998) P. Salières, P. Antoine, A. de Bohan, and M. Lewenstein, Phys. Rev. Lett. 81, 5544 (1998).
- Sansone et al. (2004) G. Sansone, C. Vozzi, S. Stagira, and M. Nisoli, Phys. Rev. A 70, 013411 (2004).
- Pfeifer et al. (2007) T. Pfeifer, A. Jullien, M. J. Abel, P. M. Nagel, L. Gallmann, D. M. Neumark, and S. R. Leone, Opt. Express 15, 17120 (2007).
- Mansten et al. (2009) E. Mansten, J. M. Dahlström, J. Mauritsson, T. Ruchon, A. L’Huillier, J. Tate, M. B. Gaarde, P. Eckle, A. Guandalini, M. Holler, et al., Phys. Rev. Lett. 102, 083002 (2009).
- Abel et al. (2009) M. J. Abel, T. Pfeifer, A. Jullien, P. M. Nagel, M. J. Bell, D. M. Neumark, and S. R. Leone, J. Phys. B 42, 075601 (2009).
- Antoine et al. (1996) P. Antoine, A. L’Huillier, and M. Lewenstein, Phys. Rev. Lett. 77, 1234 (1996).
- Nisoli et al. (2003) M. Nisoli, G. Sansone, S. Stagira, S. De Silvestri, C. Vozzi, M. Pascolini, L. Poletto, P. Villoresi, and G. Tondello, Phys. Rev. Lett. 91, 213905 (2003).
- Corkum (1993) P. B. Corkum, Phys. Rev. Lett. 71, 1994 (1993).
- Lewenstein et al. (1994) M. Lewenstein, P. Balcou, M. Y. Ivanov, A. L’Huillier, and P. B. Corkum, Phys. Rev. A 49, 2117 (1994).
- Balcou et al. (1999) P. Balcou, A. S. Dederichs, M. B. Gaarde, and A. L’Huillier, J. Phys. B 32, 2973 (1999).