L1157-B1: Water and ammonia as diagnostics of shock temperature
Abstract
We investigate the origin and nature of the profiles of water and ammonia observed toward the L1157-B1 clump as part of the HIFI CHESS survey (Ceccarelli et al. 2010) using a new code coupling a gas-grain chemical model with a parametric shock model. First results from the unbiased survey (Lefloch et al. 2010, Codella et al. 2010) reveal different molecular components at different excitation conditions coexisting in the B1 bow shock structure, with NH3, H2CO and CH3OH emitting only at relatively low outflow velocities whereas H2O shows bright emission at high velocities. Our model suggests that these differences are purely chemical and can be explained by the presence of a C-type shock whose maximum temperature must be close to 4000 K along the B1 clump.
1 Introduction
During the earliest stage of star formation, protostars generate fast jets. The supersonic impact between the jet and the parent cloud generates shock fronts propagating through the high-density gas surrounding the protostar. The shocks heat and compress the ambient gas, and complex chemistry driven by endothermic chemical reactions, ice grain mantle sublimation and sputtering occur. Several molecules, such as H2O, NH3, CH3OH, H2CO, undergo abundance enhancements by orders of magnitude (e.g. Draine et al. 1983; Kaufman & Neufeld, 1996), as observed at mm-wavelengths in a number of outflows (Garay et al. 1998; Bachiller & Pérez Gutiérrez 1997; Jiménez-Serra et al. 2005; Jørgensen et al. 2007).
One of the best laboratories is the L1157 region located at a distance between 250 and 440 pc, where a Class 0 protostar (L1157-mm) drives a chemically rich bipolar outflow (e.g, Gueth et al. 1996, Bachiller et al. 2001). The outflow is associated with several bow shocks seen in IR H2 (Nisini et al. 2010), in CO (Gueth et al. 1996) as well as in other molecules (Bachiller & Pérez Gutiérrez 1997) thought to be released from icy mantles such as H2CO, CH3OH, and typical tracers of high-speed shocks such as SiO, sputtered from dust grains (Caselli et al. 1997; Gusdorf et al. 2008; Jiménez-Serra et al. 2008). The brightest bow-shock, L1157-B1, has been extensively studied from the ground using IRAM-PdB and NRAO-VLA interferometers, revealing a rich and clumpy structure (Tafalla & Bachiller 1995; Benedettini et al. 2007; Codella et al. 2009).
As part of the Herschel Key Program CHESS (Chemical Herschel Surveys of Star forming regions, Ceccarelli et al. 2010), L1157-B1 has been investigated with a spectral survey in the 500–2000 GHz interval using the HIFI instrument to provide high-resolution (1 MHz) spectra. Preliminary results (Codella et al. 2010; Lefloch et al. 2010) have not only confirmed the chemical richness of the L1157-mm outflow, but have also revealed the presence of different molecular components at different excitation conditions coexisting in the B1 structure. In addition, the CHESS data have allowed, for the first time, comparison of the line profiles of tracers of shocked material such as CH3OH, H2CO, with those due to the fundamental transitions of water and ammonia. These species show two different kinds of profiles, with CH3OH, H2CO, and NH3 emitting only at relatively low outflow velocities (15 km s-1 with respect to the ambient velocity), whereas H2O shows bright emission even at the highest velocities (up to 30 km s-1), as seen in SiO (e.g. Zhang et al. 1995) and CO (Lefloch et al. 2010). The intensity of methanol, formaldehyde, and ammonia with respect to H2O decreases towards higher outflow velocities suggesting, in case of optically thin emission, a similar decrease in the abundance ratios. Note that while SiO and CO are not products of surface reactions, H2O, NH3, CH3OH and H2CO are all highly enhanced on the dust grains, and therefore the distinct behaviour of water is worth investigating.
High NH3 abundances in the gas phase have been observed in many warm regions (e.g. hot cores and outflows, Beuther et al. 2005; Sepulveda et al. 2011). NH3 is believed to be mainly a direct product of grain surface reactions (although at high temperatures ammonia can also form in gas phase, reaching abundances of 10-5 - see Section 3) with nitrogen hydrogenating until saturation as it sticks to the dust during the cold phase (e.g. Brown et al. 1988; Viti et al. 2004a). Water is enhanced by the release of the icy mantles as well as by endothermic reactions occurring in the warm ( K) shocked gas, which convert the bulk of atomic oxygen into water (e.g. Kaufman & Neufeld 1996, and references therein).
In this Letter we investigate the differences between the water and ammonia profiles by using a new code which couples a gas-grain chemical model with a parametric shock model.
2 The model
The gas-grain chemical code UCL_CHEM (Viti et al. 2004a) was coupled with the parametric shock model developed by Jiménez-Serra et al. (2008). UCL_CHEM is a time dependent gas-grain chemical model in two phases. During Phase I, gravitational collapse, gas-phase chemistry and sticking on to dust particles with subsequent processing occur. This phase simulates the formation of high density clumps and starts from a diffuse ( 100 cm-3) medium in atomic form (apart from a fraction of hydrogen in H2). The initial abundances adopted are solar but different initial values for the sulfur elemental abundance were also used. Atoms and molecules are depleted onto grain surfaces as in Rawlings et al. (1992, Eq. 2) and hydrogenate when possible. The depletion efficiency is determined by the fraction of the gas-phase material that is frozen onto the grains. This approach allows a derivation of the ice composition. Phase II computes the time dependent chemical evolution of the gas and dust once the clump has formed and stellar activity is present (in the form of a protostar and/or outflows). Full details of the code can be found in Viti et al. (2004a). For this work the UCL_CHEM was coupled with the parametric shock model of Jiménez-Serra et al. (2008) which calculates the physical structure of a plane-parallel steady-state C-shock that propagates with a velocity through an unperturbed medium. This approximation was validated by comparing its results with those from magnetohydrodynamic (MHD) C-shock modelling (Flower et al. 2003, Kaufman & Neufeld 1996). Although not strictly accurate, the general behaviour of the velocity of the ion and neutral fluids (i.e. and ), of the density of the neutral particles (), and of the temperature of the ions and neutrals ( and ), mimics the MHD physical structure of C-shocks (Figures 1 and 2 in Jiménez-Serra et al. 2008).
In addition to the C-shock physical structure, the parametric model includes the sputtering of dust grains following the formalism used by Caselli et al. (1997), updated with the results from May et al. (2000). In our chemical model, the icy mantles are sputtered once the dynamical age across the C-shock has reached the ‘saturation time-scales’ (or ; Jiménez-Serra et al. 2008). These are the time-scales for which almost all molecular material within the mantles is released into the gas. In Jiménez-Serra et al. (2008), were originally derived for SiO (see their Table 5). However, we adopt the same values for H2O and NH3 because the mathematical expressions of the fraction of SiO, H2O and NH3 sputtered from the grain mantles are the same for all these molecular species except for their initial abundance contained in the mantles (see Appendix B in Jiménez-Serra et al. 2008). The adopted for H2O and NH3 were finally scaled for the different initial H2 densities explored in our study, by assuming 111The cooling time-scales vary roughly as , where is the density of the ion fluid and is proportional to the H2 density of the gas - see e.g. Chièze et al. 1998; Lesaffre et al. 2004). that .
For this work, Phase I was used to form the pre-existing (to the shock) clump, B1. We do not know how dense the pre-existing clump was; however modelling of the clumps along a similar outflow (CB3; Viti et al. 2004b; Benedettini et al. 2006) has shown that in order for the chemistry to be as rich as observed, some level of clumpiness must pre-exist the shock; hence we did not consider final densities for Phase I lower than 1000 cm-3 (see Table 1). The shock model was then included in the Phase II of the chemical model.
A total of 15 models were run (Table 1) where we varied: i) the final densities of Phase I (and hence the initial density of the clump before it became shocked); we have restricted these densities to the range between 103 to 105 cm-3, similar to those derived by Güsdorf et al. (2008) and Nisini et al. (2010) for the B1 clump. Higher pre-shock densities have not been considered in this study because the collisional dissociation of H2 would highly overcome the formation rate of H2, leading to the development of a J-type discontinuity within the physical structure of the shock for the shock velocities we are considering (Le Bourlot et al. 2002). However, we note that, although most of the shocks along the L1157-mm outflow are non-dissociative (or C-type; see Nisini et al. 2010), we cannot rule out the possibility that a compact J-type shock component is present in clump B1, as suggested by the detection of [SiII], [FeII] or [SI] emission arising from this condensation (Neufeld et al. 2009). The final density and initial velocity also determine the maximum temperature attainable by the neutral gas within the shock (Draine et al. 1983 - see Figures 8b and 9b for the assumed values of Tn,max shown in Table 1; Jiménez-Serra et al. 2008). Flower & Pineau des Forêts (2003) predict higher temperatures for the same density and initial velocities at the beginning of the shock than Jiménez-Serra et al. (2008), although the values converge in the middle of the dissipation region. Since, however, recent MHD calculations from van Loo et al. (2009) seem to agree with the lower estimates, we adopt the calculations from Jiménez-Serra et al. (2008); ii) the initial elemental sulfur abundance: we use 1, 1/10 and 1/100 of the solar value; (iii) the degree of depletion, from 1 to 60% of gas depleted by the end of Phase I, an arbitrary range; (iv) the shock velocity from 35 to 60 kms-1.
| Model | n(H2) | Vs | Tsat | Tn,max | Depl. | S |
|---|---|---|---|---|---|---|
| cm-3 | km s-1 | yrs | K | |||
| 1 | 105 | 40 | 4.6 | 4000 | 1% | 1 |
| 2 | 105 | 40 | 4.6 | 4000 | 15% | 1 |
| 3 | 105 | 40 | 4.6 | 4000 | 30% | 1 |
| 4 | 105 | 35 | 4.6 | 3200 | 30% | 1 |
| 5 | 105 | 35 | 4.6 | 3200 | 1% | 1 |
| 6 | 103 | 40 | 455 | 2200 | 10% | 1 |
| 7 | 104 | 40 | 45.5 | 2200 | 15% | 1 |
| 8 | 104 | 60 | 38 | 4000 | 30% | 1 |
| 9 | 103 | 60 | 380 | 4000 | 30% | 1 |
| 10 | 103 | 60 | 380 | 4000 | 10% | 1 |
| 11 | 105 | 40 | 4.6 | 4000 | 30% | 1/10 |
| 12 | 105 | 40 | 4.6 | 4000 | 30% | 1/100 |
| 13 | 105 | 40 | 4.6 | 4000 | 60% | 1 |
| 14 | 104 | 40 | 45.5 | 2200 | 60% | 1 |
| 15 | 105 | 35 | 4.6 | 3200 | 60% | 1 |
Finally as a first attempt at reproducing the trends of the molecular line profiles, we input the fractional abundances, densities and temperatures as a function of distance and velocity produced by the chemical and shock model to the radiative transfer model SMMOL (Rawlings & Yates 2001), along with values for the dust temperature and radiation field intensity. The SMMOL code has accelerated -iteration, a numerical scheme that solves the exact radiative transfer problem in multilevel non-local conditions, using an approximate lambda operator to derive ‘pre-conditioned’ statistical-equilibrium equations (e.g. Rybicki and Hummer 1991). We ran SMMOL for o-H2O, and NH3. The collisional data for water and ammonia were taken from Faure et al. (2007) and Danby al. (1988) respectively. New collisional data for ammonia are available (Maret et al. 2009); however as they only cover up to temperatures of 100K and para-H2, we have, for this work, used the older data. While water had been modelled by SMMOL before (Lerate et al. 2010) this is the first time that SMMOL was used to model the line intensities and profiles of ammonia. This is the first attempt at using a non LTE non LVG radiative transfer code to model the high resolution H2O and NH3 lines observed by HIFI.
3 Results
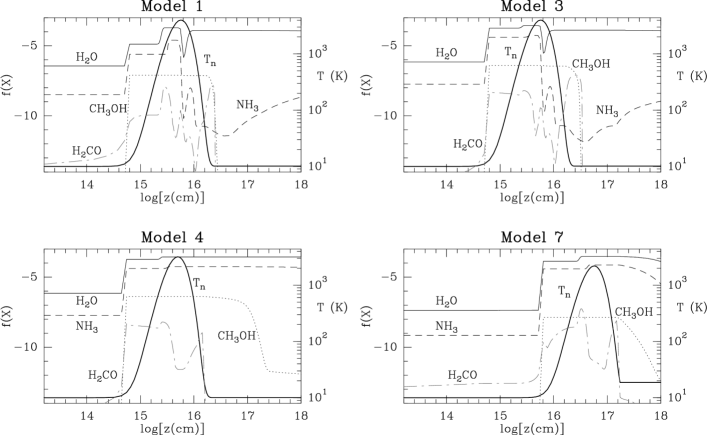
The aim of this work is to understand qualitatively the origin and history of the molecular gas. Codella et al. (2010) find that the NH3/H2O intensity ratio decreases at high velocities implying a similar decrease in the abundance ratios. This is the first statement that we will test: Figure 1 shows the chemical evolution of selected species as a function of distance within the shock ( in units of cm) for four of our models (Model 1, 3, 4 and 7), chosen as examples of variations in depletion, pre-shock densities and shock velocities. We note that the value for the initial abundance of sulfur does not affect the water and ammonia behaviour at all and we won’t discuss it further. An increase in depletion efficiency has the effect of increasing all the species that are formed or enhanced on the dust surfaces, but does not affect the abundance trends. Varying the pre-shock density and the shock velocity (and hence the neutral gas shock temperature) has a profound effect on the abundances trends. For Models 1 and 3 water behaves differently from the other three species in that it always remains abundant after the gas cools down, i.e it remains abundant at higher velocities within the post-shock gas (vn 15 km s-1). At first glance, this is certainly consistent with the assumption proposed by Codella et al. (2010) that the NH3/H2O decrease in intensity at high velocities corresponds to a decrease in their abundance ratio. In Models 4 and 7, on the other hand, ammonia remains high in abundance at high velocities. The key difference among these models is the maximum temperature reached by the gas due to the passage of the shock, and this, in turn, constrains the minimum pre-shock density for the clump (for models with the same shock velocities). Indeed, if vs = 40 km s-1 only models with initial H2 densities greater or equal to 105 cm-3 show temperatures of the neutral fluid of 4000 K in the postshock gas, reproducing the observed differences in the NH3/H2O abundance ratio. The fact that Model 7, where the initial density of the B1 clump is only 104 cm-3, does not fit the observed behaviour is consistent with previous models of chemically rich clumps along outflows (Viti et al. 2004b), and supports the idea of an inhomogeneous medium with dense pre-existing clumps along L1157. Finally we also note that the observed decrease in the H2CO/H2O and CH3OH/H2O abundance ratios with increasing velocity within the shock (Codella et al. 2010), is better reproduced by Models 1 and 3 than by Models 4 and 7.
For ammonia to be abundant in the gas phase alone, high temperatures are required; by running several UCL_CHEM Phase I test models (with constant densities of 105 cm-3, with and without freeze out) we find that high abundances (at least 10-6) of pure gas phase ammonia are only reached if: (i) the temperature is higher than 800 K (as its main route of formation, H2 + NH2, is endothermic, with a barrier of 1400K); (ii) no substantial freeze out occurs; (iii) the density of the gas is high (in our case 105 cm-3) for at least 104 years. These results are of course consistent with previous findings (see review by Ho & Townes 1983). Taking as an example Model 3, the implications for our L1157 model are as follows: during Phase I of our model, when the temperature is 10K, the bulk of the ammonia is formed on the grains. During Phase II, the bulk of the ammonia is released from the grain mantles due to sputtering at tsat 5 years (i.e at 51014 cm); however an increase in abundance (from 4 to 610-5) does occur during the passage of the shock. The increase corresponds to when the temperature reaches 1200K (corresponding to vn 15 kms-1), but it is short-lived as NH3 starts declining when the temperature reaches 3500K (corresponding to vn 25 kms-1). In terms of emission size of the clump this corresponds to less than 0.001 pc (0.5"–0.8" assuming a distance of 400 and 250 pc respectively). This implies that observations of NH3 toward the B1 clump with single dishes (20"–40") would then give lower NH3 abundances than those predicted by our model due to beam dilution (i.e. 510-5 [1"/(20"–40")2] 10-7–310-8). We note that these diluted abundances are similar to those reported by Bachiller et al. (1993) toward the B1 clump. High-angular resolution observations of high-excitation lines of NH3 with the VLA are therefore required to establish the length of the region within the postshock gas where NH3 is expected to be enhanced.
The degree and extent of the increase in the NH3 abundance due to gas phase high temperature chemistry will also depend on the degree of depletion adopted in Phase I; for example, if one compares Model 1 and Model 3 (where 1% and 30% of the gas phase is depleted by the end of Phase I, respectively) one notes that in Model 1 the relative increase is more substantial (at 31015 cm), due to the lower NH3 abundance released from the grains in Phase II.
Ultimately, therefore, the difference between the water and ammonia behaviours between Models 1 and 3, and Models 4 and 7 is due to the temperature: in a model where the initial density is 105 cm-3, or the velocity is 40 kms-1, the maximum temperature reached by the C-shock is 3000 K. Under these conditions ammonia is maintained high as there is no effective destruction route while it can efficiently form via the reaction H2 + NH2. For models where the temperature during the shock is 4000 K, ammonia is instead efficiently destroyed by the reaction: H + NH3 NH2 + H2. The latter has a high barrier ( 5000K) and hence it is inefficient for models where the maximum temperature of the shock is lower than 4000K. The main reaction that forms water, on the other hand, is very efficient as long as temperatures are over 220K while the main destruction route (via reaction with atomic hydrogen) has a very high barrier ( 9000K).
As the discriminating factor seems to be the maximum temperature attained by the shock we note that if the shock velocity is higher (e.g. 60 kms-1) then low initial densities may still lead to maximum temperatures of 4000K (Models 8-10). However we find that, regardless of the shock parameters, low initial densities imply that the gas abundances of water and ammonia (and other species) do not reach high values until the shock is at least half way through the dissipation region, leading to underestimated column densities. Moreover, if a shock velocity of 60 kms-1 were present toward B1, we should expect to detect H2O at much higher terminal velocities than observed (30 kms-1). These qualitative comparisons indicate that the best fit dynamical model for L1157 is one where the shock velocity is 40 kms-1 and nH 105 cm-3.
Comparing our water abundances with those found by Lefloch et al. (2010) we are in good qualitative agreement: they find that the water is enhanced by two orders of magnitude between the low (from VLSR=2.5 to -6 km s-1) and high-velocity (from VLSR=-6 to -25 km s-1) components from 810-7 to 810-5 respectively; comparing these abundances with our lowest pre-shock water abundances of 810-7 (corresponding to VLSR up to -6 kms-1) and the high abundance reached during the shock of 210-4 (from -7 to -30 kms-1), respectively; the latter is a factor of 3 higher than observed; we consider a match within a factor of three as a good agreement.
Finally, we test whether the profile of the water line does indeed differ from that of ammonia. We have used the velocity, abundance, temperature and density profiles from Models 3 and 4 as input to our radiative transfer model SMMOL and we computed the line profiles for water and ammonia. Figure 2 shows water and ammonia profiles for Model 3, overplotted with the ammonia profile for Model 4 (the water profile for Model 4 is very similar to that of Model 3). Clearly, while certainly not a match, the line profile for water is different from that of ammonia for Model 3, and in particular it extends to higher velocities. Moreover, in very good agreement with the observations, the water intensity is about a factor of 7 higher than that of ammonia (the latter is multiplied by this factor in the figure - see caption). On the contrary, the NH3 profile for Model 4 extends at higher velocities and its intensity is higher than observed (in the figure it is multiplied by a factor of 5). This is the first time that modelling very high resolution profiles of water and ammonia in shocked regions starting from a pure ab initio approach has been attempted. Note that we do not aim at a quantitative match with the high resolution HIFI spectra: this would require a better knowledge of the geometry and structure of the B1 clump and most importantly a three dimensional radiative transfer model. Nevertheless this first attempt is very promising as we are in fact able to reproduce how the NH3/H2O intensity ratio changes with velocity.

Acknowledgements
IJS acknowledges the Smithsonian Astrophysical Observatory for the support provided through a SMA fellowship.
References
Bachiller R., R.; Martínn-Pintado, J.; Fuente, A., 1993, ApJ, 417, L45
Bachiller R., & Peréz Gutiérrez M. 1997, ApJ, 487, L93
Bachiller R., Peréz Gutiérrez M., Kumar M.S.N., & Tafalla M. 2001, A&A 372, 899
Bendettini, M, Yates, J A, Viti S, Codella C, 2006, MNRAS, 370, 229
Benedettini M., Viti, S.; Codella, C.; Bachiller, R.; Gueth, F.; Beltrán, M. T.; Dutrey, A.; Guilloteau, S., 2007, MNRAS, 381, 1127
Beuther H., Thorwirth, S., Zhang, Q., Hunter, T. R., Megeath, S. T., Walsh, A. J., Menten, K. M., 2005, ApJ, 627, 834
Brown P. D., Charnley, S. B., Millar, T. J., 1988, MNRAS, 231, 409
Caselli, P., Hartquist, T. W., & Havnes, O. 1997, A&A, 322, 296
Ceccarelli C., Bacmann A., Boogert A., et al., 2010, A&A, 521, L22
Chieze, J.-P.; Pineau des Forêts, G.; Flower, D. R., 1998, MNRAS, 295, 672
Codella C., Benedettini M., Beltrán M.T., et al. 2009, A&A, 507, L25
Codella C., Lefloch B., Ceccarelli, C., et al. 2010, A&A, 518, L112
Danby G., Flower D. R., Valiron P. Shilke P., 1988, MNRAS 235, 229
Draine B. T.; Roberge, W. G.; Dalgarno, A., 1983, ApJ, 264, 485
Faure A, Crimier N, Ceccarelli C, Valiron P, Wiesenfeld L, Dubernet M L, 2007, A&A,472, 1029
Flower, D. R., & Pineau des Forêts, G. 2003, MNRAS, 343, 390
Gueth F., Guilloteau S., & Bachiller R. 1996, A&A 307, 891
Ho P T P, Townes C H, 1983, ARA&A, 21, 239
Jiménez-Serra, I., Caselli, P., Martín-Pintado, J., & Hartquist, T. W.
2008, A&A, 482, 549
Jiménez-Serra, I.;
Martín-Pintado, J., Rodríguez-Franco, A., & Martín, S.
2005, ApJ, 627, L121
Kaufman, M. J., & Neufeld, D. A. 1996, ApJ, 456, 250
Garay G., Köhnenkamp I., Bourke T.L., Rodríguez L.F., & Lehtinen K.K. 1998, ApJ, 509, 768
Gusdorf A., Pineau Des Forêts G., Cabrit S., & Flower D.R. 2008, A&A 490, 695
Jørgensen J.K., Bourke T.L., & Myers P.C. 2007, ApJ, 659, 479
Le Bourlot, J.; Pineau des ForȬts, G.; Flower, D. R.; Cabrit, S., 2002, MNRAS, 332, 985
Lefloch B., Cabrit S., Codella C., et al. 2010, A&A, 518, L113
Lerate, M. R.; Yates, J. A.; Barlow, M. J.; Viti, S.; Swinyard, B. M., 2010, MNRAS, 406, 2445
Lesaffre P.; Chiéze, J.-P.; Cabrit, S.; Pineau des Forêts, G, 2004, A&A, 427, 147L
Maret, S.; Faure, A.; Scifoni, E.; Wiesenfeld, L., 2009, MNRAS, 399, 425
May, P. W., Pineau des Forêts, G., Flower, D. R., Field, D.,
Allan, N. L., & Purton, J. A. 2000, MNRAS, 318, 809
Neufeld D A; Nisini, B; Giannini, T; Melnick, G J.; Bergin, E A; Yuan, Y; Maret, S.; Tolls, R.; Güsten,lf; Kaufman, M J., 2009, ApJ, 706, 170
Nisini, B, Giannini, T, Neufeld, D, Yuan, Y, Antoniucci, S, Bergin, E A, Melnick, G, 2010, ApJ, 724, 69
Rawlings J. M. C.; Yates, J. A., 2001, MNRAS, 326, 1423
Rawlings J. M. C.; Hartquist, T. W.; Menten, K. M.; Williams, D. A., 1992, MNRAS, 255, 471
Rybicki G. B., Hummer D. G., 1991, A&A, 245, 171
Sepulveda I., Anglada, G., Estalella, R., López, R.; Girart, J. M., Yang, J., 2011, A&A, 527, 41
Tafalla M., & Bachiller R. 1995, ApJ 443, L37
van Loo, S.; Ashmore, I.; Caselli, P.; Falle, S. A. E. G.; Hartquist, T. W., 2009, MNRAS, 395, 319
Viti, S, Collings, M P, Dever, J W, McCoustra M R S, Williams D A, 2004, MNRAS, 354, 1141
Viti, S, Codella, C, Benedettini M, Bachiller R, 2004, MNRAS, 350, 1029
Zhang Q., Ho T. P., Wright M. C. H., Wilner D. J., 1995, ApJ, 451, L71