22institutetext: Observatoire de Paris, LERMA (CNRS:UMR8112), 61 Av. de l´Observatoire, F-75014, Paris, France
Turbulent and fast motions of H2 gas in active galactic nuclei
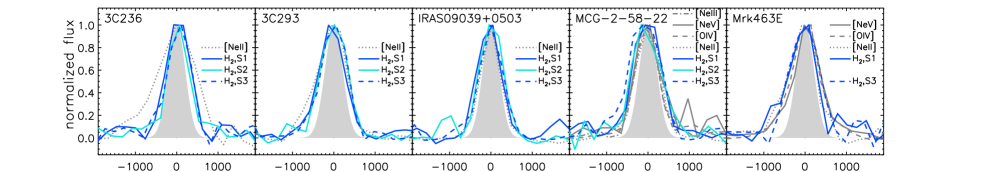
Querying the Spitzer archive for optically-selected active galactic nuclei (AGN) observed in high-resolution-mode spectroscopy, we identified radio and/or interacting galaxies with highly turbulent motions of gas at a temperature of a few hundred Kelvin. Unlike all other AGN that have unresolved line profiles at a spectral resolution of 600, 3C236, 3C293, IRAS09039+0503, MCG-2-58-22 and Mrk463E have intrinsic velocity dispersions exceeding 200 km s-1 for at least two of the rotational S0, S1, S2, and S3 lines. In a sixth source, 4C12.50, a blue wing was detected in the S1 and S2 line profiles, indicating the presence of a warm molecular gas component moving at -640 km s-1 with respect to the bulk of the gas at systemic velocity. Its mass is 5.2107 , accounting for more than one fourth of the gas at 374K, but less than 1% of the cold gas computed from CO observations. Because no diffuse gas component of 4C12.50 has been observed to date to be moving at more than 250 km s-1 from systemic velocity, the line wings are unlikely to be tracing gas in shock regions along the tidal tails of this merging system. They can instead be tracing gas driven by a jet or entrained by a nuclear outflow, which is known to emerge from the west nucleus of 4C12.50. It is improbable that such an outflow, with an estimated mass loss rate of 130 yr -1, entirely quenches the star formation around this nucleus.
Key Words.:
ISM: jets and outflows — ISM: kinematics and dynamics — Line: profiles — Galaxies: active — Galaxies: nuclei — Infrared: galaxies1 Introduction
Large-scale feedback effects such as jets and outflows from active galactic nuclei (AGN) are thought to be capable of affecting the formation of new stars in their host galaxies. The triggering of star formation by compression of gas (e.g., van Breugel et al., 1985), as well as the suppression of star formation by heating of gas that prevents its further collapse (e.g., Nesvadba et al., 2010) have been observed in local AGN. Cosmological simulations have suggested that AGN feedback effects, which are often associated with mergers, could make galaxies appear red, or even explain the observed luminosity functions of galaxies (Croton et al., 2006; Hopkins et al., 2006). Combined with multi-wavelength observations indicating that the star-formation history and the black-hole-accretion history of the Universe peak at comparable redshifts, between 13 (Marconi et al., 2004; Merloni et al., 2004), this suggests that AGN feedback could have affected the shape of present-day galaxies considerably.
Extensive tests of the role of AGN feedback on the interstellar medium (ISM) of galaxies require a detailed kinematic study of outflowing gas in local sources. Signs of massive gas outflows have been detected for ionized atomic gas (e.g., Veilleux et al., 1995; Emonts et al., 2005; Holt et al., 2006; Müller-Sánchez et al., 2006), neutral atomic gas (e.g., Morganti et al., 2005; Rupke et al., 2005), and molecular CO and OH gas (e.g., Curran et al., 1999; Das et al., 2005; García-Burillo et al., 2009; Sakamoto et al., 2009; Feruglio et al., 2010; Fischer et al., 2010; Sturm et al., 2011). In this letter we present evidence for the first detection of highly turbulent motions of gas at a temperature of a few hundred Kelvin as seen with Spitzer for several local AGN. We adopt H0=70 km s-1 Mpc-1, =0.3, and =0.7 throughout this work.
| Source | fS1 | FWHMS1a𝑎aa𝑎aRest-frame, instrumental-broadening-corrected FWHM. Their measured values appear in parenthesis. Their error bars correspond to 510% of their values. | fS2 | FWHMS2a𝑎aa𝑎aRest-frame, instrumental-broadening-corrected FWHM. Their measured values appear in parenthesis. Their error bars correspond to 510% of their values. | fS3 | FWHMS3a𝑎aa𝑎aRest-frame, instrumental-broadening-corrected FWHM. Their measured values appear in parenthesis. Their error bars correspond to 510% of their values. | Mwarm | T | Mcoldb𝑏bb𝑏bfootnotemark: | |
|---|---|---|---|---|---|---|---|---|---|---|
| - | - | 10-17W m-2 | km s-1 | 10-17W m-2 | km s-1 | 10-17 W m-2 | km s-1 | 107 | K | 109 |
| 3C236 | 0.0989 | 1.060.07 | 582 (750) | 0.490.08 | 557 (719) | 0.810.09 | 624 (767) | 6.10 | 345 | 5.1 |
| 3C293 | 0.0450 | 5.300.38 | 510 (716) | 1.790.31 | 553 (732) | 2.960.38 | 519 (714) | 6.62 | 323 | 23 |
| IRAS09039+0503 | 0.1254 | 3.090.54 | 519 (700) | 1.340.06 | 575 (730) | 2.040.13 | 569 (751) | 31.6 | 334 | … |
| MCG-2-58-22 | 0.0472 | 3.860.42 | 544 (740) | 1.500.25 | 636 (796) | 3.400.46 | 662 (824) | 4.19 | 359 | 5.7 |
| Mrk463E | 0.0507 | 3.370.59 | 556 (748) | 1.98 | … (…) | 3.760.44 | 590 (767) | 4.06 | 378 | 1.2 |
| 4C12.50 (mainc𝑐cc𝑐c The main and wing components correspond to the primary and the secondary Gaussian functions in Figure 2. ) | 0.1217 | 1.640.21 | … (519) | 1.200.11 | … (552) | 1.780.46 | … (652) | 13.9 | 374 | 15 |
| 4C12.50 (wingc𝑐cc𝑐c The main and wing components correspond to the primary and the secondary Gaussian functions in Figure 2. ) | 0.1196d𝑑dd𝑑d The Gaussians that best fit the S1 and S2 line wings peak at -646 km s-1 and -634 km s-1 from systemic velocity, respectively. | 0.620.21 | … (568) | 0.440.11 | 521 (690) | … | … (…) | 5.19 | 374e𝑒ee𝑒e The excitation temperature of the rapidly moving gas is assumed to be identical to that of the at systemic velocity to facilitate the comparison of their masses. | … |
2 The sample selection
We queried for turbulence in the warm gas in local AGN using mid-IR spectra obtained with Spitzer in high-resolution mode. The full archival sample comprises 298 sources that are classified as AGN based on optical spectroscopy. It is presented in Dasyra et al. (2011) together with the data reduction techniques and the extracted spectra.
To look for turbulent gas motions, we examined the profiles of the purely rotational (0-0)S0 28.22 m, (0-0)S1 17.04 m, (0-0)S2 12.28 m, and (0-0)S3 9.66 m lines. We searched for either resolved profiles with velocity dispersion 200 km s-1, or for profiles with asymmetric wings that are characteristic of outflows. To ensure the reliability of our results, we only examined sources with at least two lines of signal-to-noise (S/N) ratio 5. We also requested that at least two lines suggest a similar kinematic pattern, i.e. a wing or a resolved profile. To consider a line resolved we requested that its full width at half maximum (FWHM) value minus the FWHM error exceeds the instrumental resolution plus the resolution error at the observed-frame wavelength of the line (Dasyra et al., 2011). The average value in the 12.018.0 m range, which comprises the S1 and S2 transitions, is 50766 km s-1.
3 Results: Sources with highly turbulent or rapidly moving gas in the warm phase
Of the 298 sources 62 had at least two lines detected with S/N5. The profiles of two or more lines were spectrally resolved in only five sources, namely 3C236, 3C293, IRAS09039+0503, MCG-2-58-22, and Mrk463E (Fig. 1). Their velocity dispersions are in the range 220280 km s-1 (Table 1). Because all these sources are radio galaxies and/or interacting systems, the high turbulence in their warm motions can be driven by AGN feedback mechanisms, by gravitational instabilities, or by supernova winds. Still, no mechanism is efficient enough to kinematically distort a detectable mass of warm gas to velocity dispersions exceeding 300 km s-1. We computed the excitation temperature T and mass of the turbulent gas (Table 1) using the detected S1, S2, and S3 line fluxes as in Higdon et al. (2006). At temperatures of 300400 K, its mass is typically on the order of 1% of the cold gas mass indicated by CO observations.
Further outflow or inflow signatures were sought for in the line wings and in the difference of the recession velocity from the systemic velocity, . The latter was determined from the [Ne II] line, emitted by ions that are abundant in star-forming regions and in the AGN vicinity owing to their low ionization potential, 21.56 eV. The recession velocity agreed within the errors with for all sources, including those with massive outflows of the gas that is photoionized by the AGN and that is traced by the [Ne V] or [O IV] lines (i.e., 3C273, IRAS13342+3932, IRAS05189-2524, IRAS15001+1433, IRAS23060+0505, Mrk609; Dasyra et al., 2011).
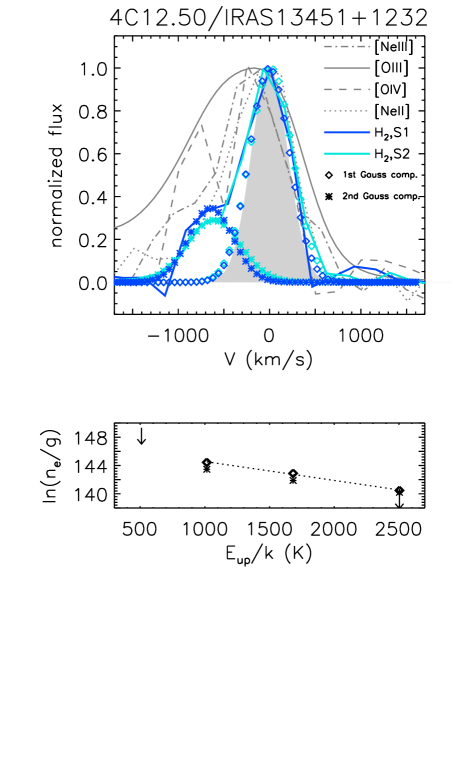
The only source with wing signatures in its line profiles was 4C12.50, also known as IRAS13451+1232 or PKS1341+12. The S1 and S2 line wings (Fig. 2; upper panel), detected with S/N3, point at two warm molecular gas kinematic components in this source. The peak of the secondary Gaussian that is needed to fit both profiles is blueshifted by 640 km s-1 from the primary Gaussian at . The flux ascribed to the primary Gaussian is only 2.6 and 2.7 times higher than that ascribed to the secondary Gaussian of the S1 and S2 transitions, respectively. Using the actual flux in each Gaussian (Table 1), we separately calculated the gas mass for each kinematic component. We find the excitation temperature of the bulk of the gas to be 37412 K. It is equal to the inverse of the slope of the line that best fits the excitation diagram points (Rigopoulou et al., 2002). The excitation diagram (Fig. 2; lower panel) shows the natural logarithm of the number of electrons ne that descended from the upper to the lower state, normalized by the statistical weight g of the transition, as a function of the temperature that corresponds to the energy of the upper state Eup divided by the Boltzmann constant . The value of ne is computed as L/(), where h is the Planck constant, is the Einstein coefficient of the transition, and is the frequency of the emitted line. For a single temperature of 374K we find that the mass of the gas at systemic velocity is 1.4108 (see also Higdon et al., 2006). Assuming (for simplicity) that T is the same for both kinematic components (see Figure 2), we find that the mass of the gas moving at 640 km s-1 is 5.2107 . This is 0.3% of the cold gas mass in the west nucleus of 4C12.50, which was found from CO observations to be 1.51010 (Evans et al., 2002).
4 Discussion: An AGN-driven molecular gas outflow in 4C12.50?
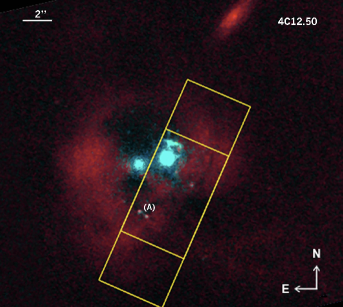
Even though 4C12.50 is an IR-bright system of two interacting galaxies (Axon et al., 2000), the secondary Gaussian of Figure 2 is unlikely to be tracing gas in the east nucleus, which is mostly located outside the IRS slit (Fig. 3). Any residual gas from the east nucleus inside the slit would be moving at a velocity comparable to the difference in the recession velocity of the two nuclei, 200 km s-1. This difference is computed from ionized gas kinematics (Holt et al., 2003), and it is confirmed by stellar kinematics from CO absorption features presented in Dasyra et al. (2006). Besides the two nuclei residing in a common bulge, 4C12.50 also has off-nuclear gas concentrations and super star clusters in tidal tails. The blueshifted emission could arise from gas in a tidal tail inside the IRS slit (Fig. 3), which is entering a shock front created during the collision (see Cluver et al., 2010). The tidal tail could be moving faster or be at a different inclination angle than its corresponding nucleus, of 20∘ in either case. Because the deprojected tail velocity would be equal to 640/ km s-1, it could reach a value as high as 2000 km s-1. This scenario is also unlikely given that no off-nuclear, large-scale (20 kpc) kinematic component has been observed to be moving faster than 250 km s-1 from along the line of sight (Holt et al., 2003; Rodríguez Zaurín et al., 2007).
A scenario that agrees better with existing observations is that the gas is moving toward us driven by feedback mechanisms (e.g., Alatalo et al., 2011). Optical spectroscopy indicated the presence of an outflow from the west nucleus of 4C12.50 by revealing the existence of three kinematic components for the nuclear [O I], [S II], and [O III] emission (Holt et al., 2003). Most of the [O III] emission is blueshifted by 400 km s-1, while its broadest component (of FWHM1900 km s-1) is blueshifted by 2000 km s-1 from . MIR spectroscopy suggested an AGN-related nuclear outflow of ionized gas. Blue wings were observed in the profiles of the [O IV] 25.89 m and the [Ne V] 14.32 m lines (Spoon & Holt, 2009; Dasyra et al., 2011), emitted by ions that are primarily found in hard radiation fields. Radio observations revealed an HI absorption line blueshifted by 1000 km s-1 from (Morganti et al., 2004). Because a background radio source is required for HI absorption to be seen, the hydrogen clouds are likely to be located between the observer and the AGN or its jet. Estimates of the outflow mass range from 8105 for the ionized 104K gas (Holt et al., 2011) to 5.6108 for the neutral gas traced by Na ID (Rupke et al., 2005), bracketing our mass estimate, , of 5.2107 for the outflowing 400K gas.
If the outflow is caused by AGN radiation pressure or winds (Holt et al., 2011), it can be considered spherical. If the gas is also distributed in a sphere, and if its density is falling with the inverse square of the distance from the center, its mass outflow rate, , will be given from the product . For an outflow velocity of 640 km s-1 and for a radius of 270 pc, as estimated for the CO gas assuming that it is thermalized to the dust temperature (Evans et al., 2002) and as converted to the adopted cosmological distance, will be 130 yr-1. An outflow of these properties is unlikely to entirely suppress star formation in the west nucleus of 4C12.50, whose star-formation rate (SFR) is estimated to be between 370-1380 yr-1. The lower value is found from the CO mass using a gas consumption timescale of 4107yrs, while the upper value is found by folding the CO-based mass and radial extent in the Schmidt-Kennicutt law (Evans et al., 2002). If the outflow were symmetric, both a blue and a red line profile wing should exist unless the gas moving away from the observer is obscured by dust. This is plausible for a source with E(B-V) of 1.44 magnitudes (Holt et al., 2011) and 9.7 m optical depth of 0.59 (Veilleux et al., 2009), which could translate into a 1020% absorption of the total flux at 17 m (Li & Draine, 2001), and which could preferentially suppress the red line wing for a circumnuclear dust distribution.
Alternatively, a radio jet encountering clouds on its path could be driving the outflow (e.g., Dietrich & Wagner, 1998). A jet is indeed known to emerge from the west nucleus of 4C12.50. It extends out to 45 pc in projection in the north and 170 pc in the south (Stanghellini et al., 1997), and it propagates close to the speed of light at a small angle from the line of sight (Lister et al., 2003). A previous flare of the jet, undetected in the radio because of its weak signal, could be associated with the shocked gas whose extended X-ray emission peaks at 20 kpc south of the nucleus (Siemiginowska et al., 2008). The scenario of a jet-driven outflow can easily explain the observed line profiles. The detection of a blue or a red wing is random since it depends on the location of the clouds with respect to the jet propagation axis.
5 Summary and concluding remarks
We queried the archival catalog of 298 optically-selected AGN observed with Spitzer IRS in high-resolution mode (Dasyra et al., 2011), aiming to identify sources with turbulent motions of their warm molecular gas. We examined the profiles of the S0, S1, S2, and S3 lines and found only five radio and/or interacting galaxies with 200 km s-1 but no source with 300 km s-1. In a sixth source, 4C12.50, the S1 and S2 lines have a blue wing that points at warm gas moving toward us with 640 km s-1. Its mass, 5.2107 , corresponds to an impressively high fraction, 1/4, of the total 400K gas mass. While it could be tracing shock regions along tidal tails, it is more likely to be tracing an AGN jet or wind-driven outflow, known from ionized and neutral gas kinematic studies. Even if all of this gas is entrained by an outflow, it is unlikely to entirely suppress star formation in 4C12.50. Additional tests of the role of AGN feedback mechanisms in increasing the turbulence of the molecular gas require observations of high-rotational-number transitions of CO molecules that can be mostly excited by the AGN (van der Werf et al., 2010). An essential role in revisiting this question will also be played by the Atacama Large Millimeter Array, which, via high-resolution studies of the cold gas, will enable a comparison never performed before: the computation of the warm-to-cold molecular gas mass ratio in an outflow vs the rest of the ISM.
Acknowledgements.
K. D. acknowledges support by the European Community through a Marie Curie Fellowship (PIEF-GA-2009-235038) awarded under the 7th Framework Programme (2007-2013).References
- Alatalo et al. (2011) Alatalo, K., Blitz, L., Young, L. M., et al. 2011, ApJ, 735, 88
- Axon et al. (2000) Axon, D. J., Capetti, A., Fanti, R., et al. 2000, AJ, 120, 2284
- Batcheldor et al. (2007) Batcheldor, D., Tadhunter, C., Holt, J., et al. 2007, ApJ, 661, 70
- Bertram et al. (2007) Bertram, T., Eckart, A., Fischer, S., et al. 2007, A&A, 470, 571
- Cluver et al. (2010) Cluver, M. E., Appleton, P., Boulanger, F., et al. 2010, ApJ, 710, 248
- Croton et al. (2006) Croton, D. J., Springel, V., White, S. D. M., et al., 2006, MNRAS, 367, 864
- Curran et al. (1999) Curran, S. J., Rydbeck, G., Johansson, L. E. B., & Booth, R. S. 1999, A&A, 344, 767
- Das et al. (2005) Das, M., Vogel, S. N., Verdoes K. G. A., et al. 2005, ApJ, 629, 757
- Dasyra et al. (2006) Dasyra, K. M., Tacconi, L. J., Davies, R. I., et al. 2006, ApJ, 638, 745
- Dasyra et al. (2011) Dasyra, K. M., Ho, L. C., Netzer, H., et al. 2011, ApJ, in press, arXiv/1107.3397
- Dietrich & Wagner (1998) Dietrich, M., & Wagner, S. J. 1998, A&A, .338, 405
- Emonts et al. (2005) Emonts, B. H. C., Morganti, R., Tadhunter, C. N., et al. 2005, MNRAS, 362, 931
- Evans et al. (1999) Evans, A. S., Sanders, D. B., Surace, J. A., & Mazzarella, J. M. 1999 ApJ, 511, 730
- Evans et al. (2002) Evans, A. S., Mazzarella, J. M., Surace, J. A., & Sanders, D. B. 2002 ApJ, 580, 749
- Feruglio et al. (2010) Feruglio, C., Maiolino, R., Piconcelli, E., et al. 2010, A&A. 518. L155
- Fischer et al. (2010) Fischer, J., Sturm, E., González-Alfonso, E., et al. 2010, A&A, 518, L41
- García-Burillo et al. (2009) García-Burillo, S., Combes, F., Usero, A., & Fuente, A. 2009, AN, 330, 245
- Higdon et al. (2006) Higdon, S. J. U., Armus, L., Higdon, J. L., Soifer, B. T., & Spoon, H. W. W. 2006 ApJ, 648, 323
- Holt et al. (2003) Holt, J., Tadhunter, C. N., & Morganti, R. 2003, MNRAS, 342, 227
- Holt et al. (2006) Holt, J., Tadhunter, C. N., & Morganti, R. 2006, AN, 327, 147
- Holt et al. (2011) Holt, J., Tadhunter, C. N., Morganti, R., & Emonts, B. H. C. 2011, MNRAS, 410, 1527
- Hopkins et al. (2006) Hopkins, P. F., Somerville, R. S., Hernquist, L., et al. 2006, ApJ, 652, 864
- Li & Draine (2001) Li, A. & Draine, B. T. 2001, ApJ, 554, 778
- Lister et al. (2003) Lister, M. L., Kellermann, K. I., Vermeulen, R. C., et al. 2003, ApJ, L584, 135
- Marconi et al. (2004) Marconi, A., Risaliti, G., Gilli, R., et al. 2004, MNRAS, 351, 169
- Merloni et al. (2004) Merloni, A., Rudnick, G., & Di Matteo, T. 2004, MNRAS, 354, L37
- Morganti et al. (2004) Morganti, R., Oosterloo, T. A., Tadhunter, C. N., et al. 2004, A&A, 424, 119
- Morganti et al. (2005) Morganti, R., Tadhunter, C. N., & Oosterloo, T. 2005, A&A. 444, L9
- Müller-Sánchez et al. (2006) Müller-Sánchez, F., Davies, R. I., Eisenhauer, F., et al. 2006, A&A, 454, 481
- Nesvadba et al. (2010) Nesvadba, N., Boulanger, F., Salomé, P., et al. 2010, A&A, 521, 65
- Peng et al. (2002) Peng, C. Y., Ho, L. C., Impey, C., & Rix, H.-W. 2002, AJ, 124, 266
- Rodríguez Zaurín et al. (2007) Rodríguez Zaurín, J., Holt, J., Tadhunter, C. N., & González Delgado, R. M. 2007, MNRAS, 375, 1133
- Rigopoulou et al. (2002) Rigopoulou, D., Kunze, D., Lutz, D., et al. 2002 A&A, 389, 374
- Rupke et al. (2005) Rupke, D. S., Veilleux, S., & Sanders, D. B. 2005, ApJ, 632, 751
- Sakamoto et al. (2009) Sakamoto, K., Aalto, S., Wilner, D. J., et al. 2009, ApJ, L700, 104
- Saripalli & Mack (2007) Saripalli, L., & Mack, K.-H., MNRAS, 376, 1385
- Siemiginowska et al. (2008) Siemiginowska, A., LaMassa, S., Aldcroft, T. L., et al. 2008, ApJ, 684, 811
- Spoon & Holt (2009) Spoon, H. W. W., & Holt, J. 2009, ApJ, 702, L42
- Stanghellini et al. (1997) Stanghellini, C., O’Dea, C. P., Baum, S. A., et al. 1997A&A, 325, 943
- Sturm et al. (2011) Sturm, E., González-Alfonso, E., Veilleux, S., et al. 2011, ApJ, 733, L16
- van Breugel et al. (1985) van Breugel, W., Filippenko, A. V., Heckman, T., & Miley, G. 1985, ApJ, 293, 83
- van der Werf et al. (2010) van der Werf, P. P., Isaak, K. G., Meijerink, R., et al. 2010, A&A, L518, 42
- Veilleux et al. (1995) Veilleux, S., Kim, D.-C., Sanders, D. B., et al. 1995, ApJS, 98, 171
- Veilleux et al. (2009) Veilleux, S., Rupke, D. S. N., Kim, D.-C., et al. 2009, ApJS, 182, 628