Transient Super-strong Coronal Lines and Broad Bumps in the Galaxy SDSS J074820.67+471214.3
Abstract
Variable super-strong coronal emission lines were observed in the spectrum of one galaxy, SDSS J095209.56+214313.3, and their enigmatic origin remains controversy. In this paper, we report detection of variable broad spectral bumps, reminiscent of the spectrum of type II-Plateau (II-P) supernova taken a few days after the shock breakout, in the second galaxy with variable super strong coronal lines, SDSS J074820.67+471214.3. The coronal line spectrum shows unprecedented high ionization with strong [Fe X]6376, [Fe XI]7894, [Fe XIV]5304, [S XII]7612 and [Ar XIV]4414, but without detectable optical [Fe VII] line emission. The coronal line luminosities are similar to thos e observed in bright Seyfert galaxies, and 20 times more luminous than that reported in the hottest Type IIn SN 2005ip. The coronal lines ( km s-1) are much broader than the narrow emission lines ( km s-1) from the star forming regions in the galaxy, but at nearly the same systematic redshift. We also detected a variable non-stellar continuum in optical and UV. In the follow-up spectra taken 4-5 years later, the coronal lines, SN-like feature, and non-stellar continuum disappeared, while the [O III]5007 intensity increased by about a factor of ten. Our analysis suggests that the coronal line region should be at least ten light days in size, and be powered either by a quasi-steady ionizing source with a soft X-ray luminosity at least a few erg s-1or by a very luminous soft X-ray outburst. These findings can be more naturally explained by a star tidally disrupted by the central black hole than by an SN explosion. The similarity of their coronal line variability trend observed in the two galaxies suggests that the two transient events are of the same origin with SDSS J074820.67+471214.3 being caught at an earlier stage by the spectroscopic observation.
1 Introduction
Superstrong coronal lines have been detected in two galaxies spectroscopically observed in the Sloan Digital Sky Survey (SDSS, York et al. 2000), SDSS J095209.56+214313.3 (hereafter SDSS J0952+2143, Komossa et al. 2008) and SDSS J124134.25+442639.2 (Gelbord et al. 2009). Follow-up observations of SDSS J0952+2143 showed that high ionization coronal lines were fading on time scales of years since their discovery (Komossa et al. 2008, 2009)111We obtained two-epoch follow-up spectroscopic observations of SDSS J124134.25+442639.2 using the MMT 6.5m telescope at Feb. 11 and Mar. 30, 2008, and found that it shows the similar variability trend as SDSS J0952+2143 (Zhou et al. in prep.).. Two physical processes were proposed for the transient coronal lines: (1) an episodic accretion onto a supermassive black hole (SMBH) following the tidal disruption of a star in the vicinity of the central black hole; and (2) a peculiar type supernova (SN) with strong coronal lines, such as SN2005ip discovered recently (Smith et al. 2009). In the former case, it provides a way for a systematic search for the tidal disruption events through optical spectroscopic surveys, and thus, can be used to constrain the stellar distribution and dynamics in the vicinity of supermassive black holes, as well as the circum-nuclear environment. The latter case is also interesting in that, though coronal line emission in SNs can be fairly well understood on the basis of current models, none of such models has been tested in these extreme cases.
Narrow coronal lines up to [Fe VII]6087, [Fe X]6376, [Fe XI]7894, and [Fe XIV]5304 were observed in the late phase of a few SNe (e.g., Gröningsson et al. 2006; Smith et al. 2009). SN2005ip is the only SN that coronal lines, together with recombination lines, were detected also in its early phase, probably a few weeks after the explosion. The coronal lines are thought to arise from the interaction between the SN and circum-stellar material (CSM). The X-rays from the radiative shock ionize CSM, and give rise to emission lines of a wide range ionization states, including coronal lines. It is unclear whether superstrong coronal emitters (SSCLEs), in which coronal lines are a factor of several tens to hundreds more lumninous than SN2005ip, can still be understood within this context.
Strong variable narrow coronal lines has been detected in the galactic nucleus with soft X-ray flares (Komossa & Bade 1999). The X-ray flares are thought as a signature of stellar disruption by SMBH (e.g., Rees 1988; Bade et al. 1996; Komossa et l. 2004; Halpern, Gezar & Komossa 2004). Thus, it is natural to associate SSCLE with the tidal disruption process. As the tidal debris set down, it forms an accretion disk around the black hole. The strong UV and X-ray radiation from the accretion disk illuminates the outer debris as well as interstellar medium further out, giving rise to broad and narrow high ionization emission lines (e.g., Komossa & Bade 1999).
To distinguish between the two scenarios, it is important to find spectroscopic signatures of both of a supernova and a tidal disruption flare. Traditionally, core-collapse supernovae have been divided into different subtypes according to their spectral signature and/or the shape of light-curve (see Filippenko 1997 for a review). The different spectral signatures arise because different stellar evolution track of SN progenitor leads to different stellar radius, atmospheric chemical composition, and core mass. Most massive stars will lose their entire hydrogen and even helium envelope in Wolf-Rayet star stage, resulting in a type Ib or Ic SN; less massive stars will retain a hydrogen shell at the end of their evolution stage, ending with a Type II SN. Type II SN will be further divided into Type II-L and Type II-P, depending on the lack or presence of a plateaus in the light-curve, which may be connected to the thickness of hydrogen shell. Stars with a mass just above 8-10 M☉ will have a thick hydrogen shell at the end of red supergiant (RSG), and explodes as a Type II-P SN with a plateaus in the light curve.
In this paper, we report the detection of variable broad bumps reminiscent of a young SN II-P in the spectrum of the galaxy SDSS J074820.67+471214.3 (SDSS J0748+4712 for short)–a SSCLE at a redshift of z=0.0616, which was identified during a systematic search of coronal line emitters in the SDSS spectroscopic sample of galaxies. The paper is organized as follows. We present the observations, data analysis, and results in §2. The implications on the emission line region and ionizing continuum are discussed in §3. We discuss several models of SSCLEs in §4. Throughout this paper, we assume a dominated cosmology with km s-1 Mpc-1, and .
2 Observation and Data Analysis
2.1 Observation, Photometric and Spectral Data
SDSS J0748+4712 was observed by SDSS in the imaging mode at 2003-10-23. A disk galaxy is seen in the position. An SDSS spectrum centered on the nucleus was taken at 2004-02-20, about 4 months after the imaging. The galaxy was detected in the GALEX survey on 2004-03-10, 20 days after the spectroscopic observation, and reobserved by GALEX at 2010-01-09 in NUV. Four low resolution () optical spectra were taken with the OMR Cassegrain spectrograph mounted on the 2.16m telescope at Xinglong station of National Astronomical Observatory of China, one on 2008-12-25, and three on 2009-03-25 with one hour exposure each. The spectra taken at the same night are combined. The slit is centered at the galactic nucleus with a width of 20 to match the seeing disk. The galaxy was detected in the 2MASS survey at 1999-02-20. The 2MASS point source catalog quoted magnitudes of , , and , with a notation of association with an extended source. Thus, these near-infrared magnitudes can only be considered as upper limits. All of the data were corrected for the Galactic extinction of (Schlegel et al. 1998) before further analysis.
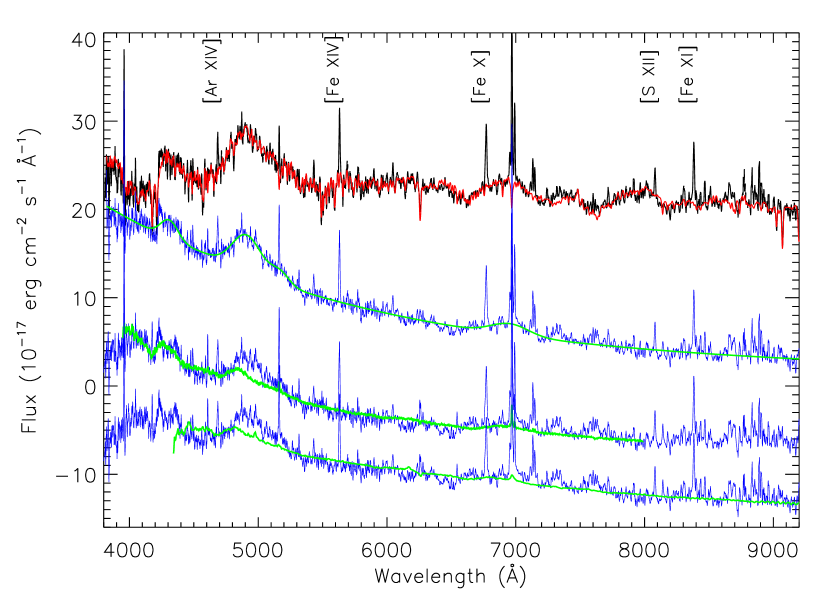
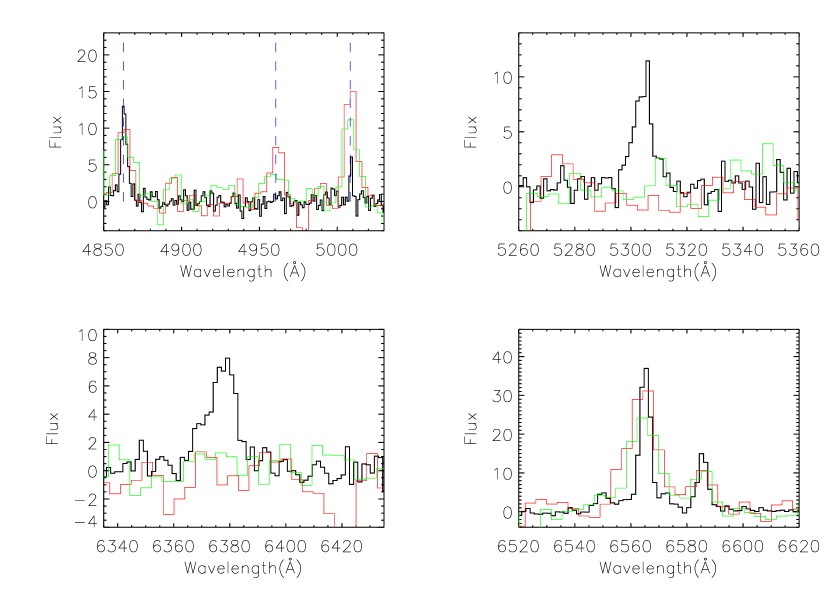
We examine the SDSS spectrum, and find three broad bumps and numerous narrow high ionization coronal lines, including [Fe XIV]5304, [Fe XI]7894, [Fe X]6376, [S XII]7612 and [Ar XIV]4414, along with other lines commonly seen in an emission line galaxy, H, H, [N II]6548,6583, [S II]6716,6732, [O III]5007, [O II]3727 (Figure 1). The broad bumps peak around 4050, 4600 and 6560Å with widths of several hundred Å. These bumps do not correspond to any emission lines in an AGN, but similar bumps are seen in the spectra of some supernovae. In the figure, we overlay also the spectra of type II-P supernova SN1999gi on the day of discovery (day 1; Leonard et al. 2002), which is believed to correspond to only a few days after the shock breakout, and another type IIP SN 2006bp, also a few days after the shock breakout (Quimby et al. 2007). It is evident that the bumps look similar to SN1999gi and SN2006bp although their strengths are much larger. The broad bumps and coronal lines disappeared in the Xinglong’s spectra taken 4 and 5 years later, indicating these features are not persistent, while [O III]4959,5007 brightened remarkably (Figure 2). The similarities of the broad bumps between SDSS J0748+4712 and SNs, including the centroids, profiles, and transient nature, motivate us to connect both of bumps and coronal lines to a SN-like flare.
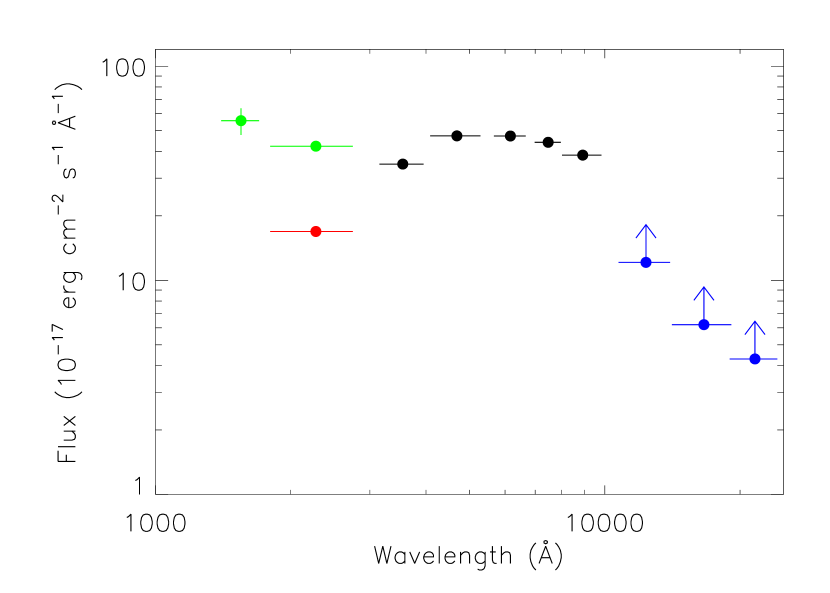
Next, we check the spectral energy distribution (SED, Fig 3). The synthesis magnitudes of the SDSS spectrum in , and bands are brighter than fiber magnitudes determined from the SDSS imaging data by 0.51, 0.44 and 0.47 mags, respectively. The median seeing during the spectral observation is about 20, similar to that used to smooth the SDSS image for fiber magnitude estimate (Adelman-McCarthy et al. 2008), thus fiber magnitudes properly reflect the galaxy light within the spectral fiber. However, SDSS spectra are calibrated by tying synthesis magnitudes to the point spread function (PSF) magnitudes for calibration stars, as a result, synthesis magnitudes are brighter than fiber magnitudes (Adelman-McCarthy et al. 2008). The exact difference depends on the observational conditions and the surface brightness distribution of the source. In this paper, we estimate the distribution of the difference in each band using all galaxies on the same plate of SDSS J0748+4712. These distributions are then fitted with gaussian functions to evaluate mean deviations and their width. SDSS J0748+4712 locates far away from the main distributions in all of the three bands. We calculate the variations in each band by subtraction the mean difference, and calculate the uncertainty by considering both the width of the distribution and the uncertainty in the synthesis magnitudes. Assuming SDSS photometric data are not affected by the supernova, we estimate the magnitudes of SN-like event to be 19.90.24, 20.50.09 and 19.70.13 at , and bands. At the redshift of , the absolute magnitudes are , and mag.
The 2MASS photometric fluxes are lower than SDSS fluxes, indicating that they miss part of the extended light for the galaxy. The UV fluxes at 2004-03-10 are above the simple extrapolation of optical SED, suggesting substantial contribution from the SN-like activity. This is confirmed by that fact that the NUV magnitude at 2010-01-09 is about 0.68 mag fainter than that at 2004-03-10. Note that the NUV flux at 2010-01-09 is consistent with a nature extension of optical SED (Figure 2). Assuming that the later flux comes from the starlight, the absolute NUV magnitude of the flare was mag at 2004-03-10 without considering the intrinsic reddening. The SED of the host galaxy implies that the contribution of the host galaxy to the FUV flux at 2004-03-10 is much less than that in NUV, and FUV flux was dominated by the flare component.
2.2 Detailed Analysis of Optical Spectrum
We fit the SDSS spectrum with the starlight from the host galaxy and a supernova template first. The starlight is modeled as a combination of independent components (ICs), which are convolved with a Gaussian kernel to match the absorption line width, and shifted in redshift to match the centroid of the absorption lines. The 6 ICs were derived by applying Ensemble Learning ICA to the simple stellar population of BC03 (refer to Lu et al. 2006 for detail). A uniform extinction to the starlight is included as a free parameter.
We adopt Peter Nugent’s supernova templates 222http://supernova.lbl.gov/ nugent/nugent_templates.html for the SN component. The templates include 439 spectra of different type supernovae with several ages, including Type Ia, Type Ib, Type Ibc, Type II-L, Type II-P, and Type II-n, and peculiar type Ia supernova, SN 1991bg and SN 1991t. Because of similarity of SDSS J0748+4712 to the early spectra of SN 1999gi (II-P), SN 2006bp (II-P, Immler et al. 2007; Quimby et al. 2007) and SN1991N (Type Ic/b, Filippenko & Korth 1991), we also include these spectra from SUSPECT project 333http://suspect.nhn.ou.edu (see Leonard et al. 2002; Quimby et al. 2007; and Matheson et al. 2001 for original spectra). The optical spectra of the last three supernovae were corrected for the Galactic and internal reddening from above literature. Finally, we also added two spectra of SN 2005ip on day 1, a few weeks after SN explosion, and on day 93 after the discovery (Smith et al. 2009). Dust extinction to the supernova component is treated as a free parameter with the extinction curve of in Cardelli et al. (1989). Obvious narrow emission lines were masked during the fit.
For each SN template, we obtain the best fitted parameters by minimizing . The least reduced is then sorted out among these minima, and the corresponding supernova template is considered as the best match. We find that SN 1999gi at day 1 provides the best fit (reduced chi-square ), followed by SN 2006bp at day 1 (), also a few days after explosion. Other templates gives significantly worse fit due to mismatch of the bumps. As shown in Figure 1, these fits are still not able to reproduce strong enough the 4600Å bump strength. Noticeably, there is a global deficit in the fit from the peak to the red side of the bump. The internal reddening of the supernova is relatively small with for SN199gi and SN2006bp templates. These templates give a consistent stellar velocity dispersions km s-1. Because the value is well below the spectral resolution of SDSS and resolutions of IC templates and SDSS spectrum are not perfectly matched, it can only be considered as an indication for a small stellar velocity dispersion. In passing, we note that the late spectrum of SN2005ip do not provide fit to the SDSS spectrum although the first day spectrum of SN2005ip gives a reasonable fit up to wavelength of 4900Å. Because the first day spectrum does not cover the wavelengths of two blue bumps, which are the most prominent features in the spectrum of SDSS J0748+4712, it is not clear if SDSS J0748+4712 looks similar to SN2005ip at early stage.
Because SN templates do not provide good fits to the SDSS spectrum, we also considered another empirical model consisting of a black body and four Gaussian for bumps. With this description, we obtain a much better fit to the SDSS spectrum (; also Figure 1). The fit yields a temperature (1.30.4) K and a moderate reddening , marginally larger than the SN template fit. In the following, we will refer this fit as our baseline model.
We measure narrow emission lines in the residual spectrum after subtraction of the model continuum. Each emission line is fitted with one Gaussian except for H, which requires an additional broad component. In the fit to [N II]6583 and H blending, the width and center of the two narrow components are locked in the velocity space. Continuum is modeled either as a local constant for isolated or close doublets, or as a linear function in [O III]+H, H+[N II]+[S II] regimes. This scheme yields accepted fits for all emission lines. The derived parameters are summarized in Table 1. Normal narrow lines, such as [O II]3727, [N II]6583, H have a width around km s-1, after removal of the SDSS instrumental broadening of 69 km s-1. Their redshifts are consistent with being the same. [O III]5007 is very weak. is somewhat broader, perhaps due to including of an intermediate component, which is prominent in H. The line ratios, [N II]6583/H and [O III]5007/H, locates in the HII regime on the BPT diagram (e.g., Kewley et al. 2006). Therefore, these normal narrow lines are likely dominated by HII regions of the galaxy. The Balmer decrement is consistent with the Case-B recombination, indicating little dust extinction to the HII regions, in line with low extinction to starlight inferred in the last section. The [N II]6583/H and [S II]6716/H ratios suggest half a solar metallicity for the HII regions (Pettini & Pagel 2004). This is in line with the luminosity of galaxies (). The intermediate width component of H has a width of around 1500km s-1and a flux of 2/3 of the narrow component. Such a component may also be present in the H line (Figure 3). As mentioned above, we did not include this component in the fit due to low signal to noise ratio.
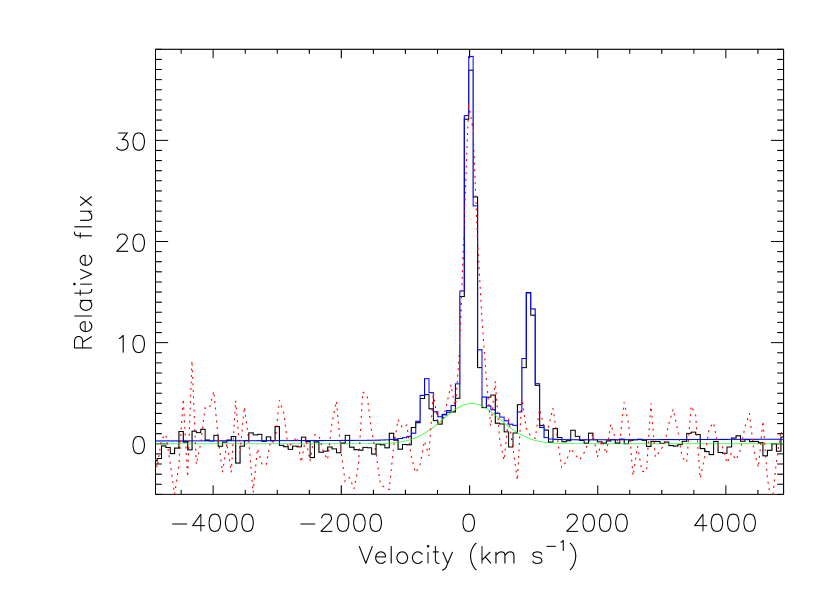
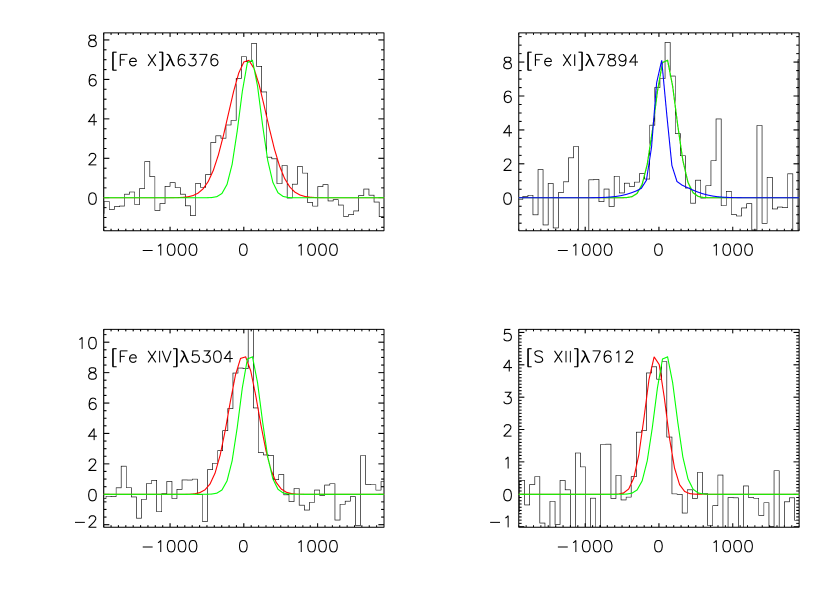
The coronal lines are much broader, but their profiles show subtle difference from one line to another (Fig 4). [Fe XI]7894 is the narrowest ( km s-1) and redshifted by 70 km s-1 with respect to H or [NII]. It is entirely possible that that [Fe X]6376 has a profile similar to that of [Fe XI]7894. The core component of [Fe X]6376 is very similar to that of [Fe XI]7894 but there appears an additional weak blue component in [Fe X]6376, which may be due to contamination of other lines. If this were verified, there would be a trend that higher ionization lines are blueshifted relative to lower ionization lines. Other high ionization coronal lines are blueshifted by 40 to 130 km s-1 with respect to [Fe XI]7894. These differences are larger than the uncertainty of the SDSS spectral calibration. [Fe XIV]5304 profile is well defined, and is broader (18818 km s-1) than and blueshifted (21 km s-1) with respect to [Fe XI]7894. [S XII]7612 is blueshifted (25 km s-1), but with almost the same width (12424km s-1). [Ar XIV]4414 appears also blueshifted and broader, though with a low S/N ratio. At a redshift of z=0.0616, the line luminosities are (8.8, 7.4, 7.5, 3.6 and 3.5) erg s-1, for [Fe X]6376, [Fe XI]7894, [Fe XIV]5304, [S XII]7612 and [Ar XIV]4414 before correction for the internal reddening, which may affect the line luminosities by no more than 50%.
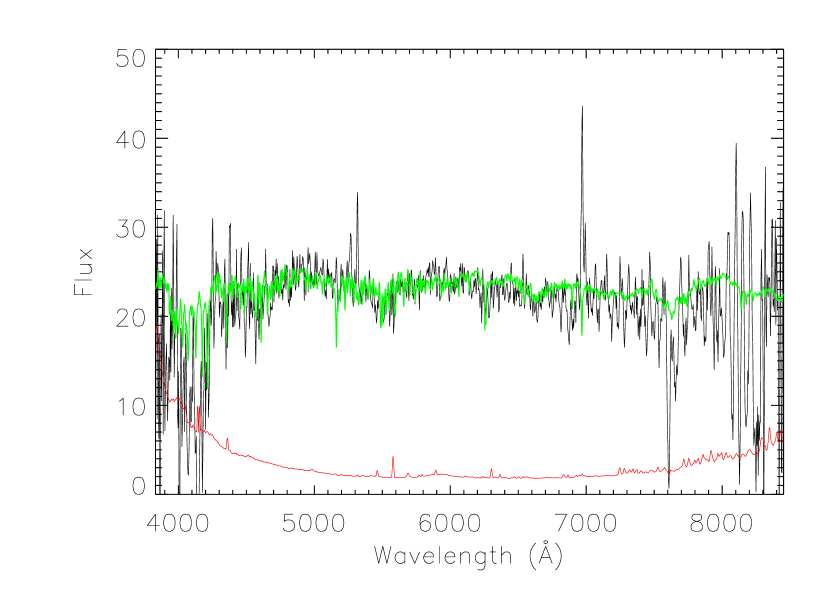
We also measure the narrow emission lines in the BAO spectra with a similar procedure but without a SN continuum component. Despite the low S/N ratio of either spectrum, the coronal lines are very weak if present at all (Figure 5). However, [O III]5007 is 10 times stronger than in the SDSS spectrum, suggesting the trend that low-ionization lines are being strengthened while high ionization being weakened (Figure 2).
3 The Emission Line Region and Ionizing Continuum
3.1 On Coronal Line Emission Region
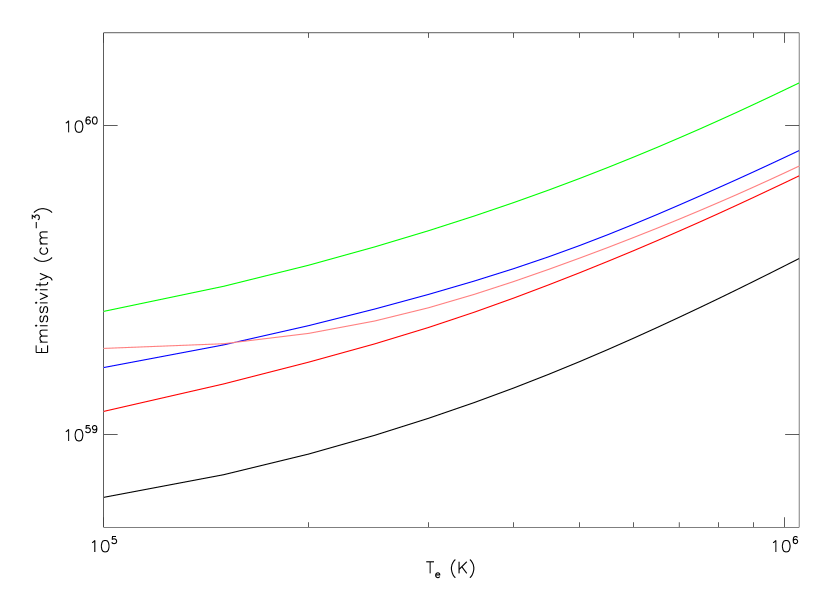
First we estimate the Emission Measure, , or for a uniform medium of volume , ion density and electron density , assuming that collisional de-excitation and continuum fluorescence are unimportant. The observed line luminosity relates to with, e.g., , where is the collisional strength from the lower to the upper levels of the correspondent transition, which is a descending function of gas temperature , and n(Fe+9) the density of Fe+9. If gas is photo-ionized, its temperature is around K (e.g., Korista & Ferland 1989). We take the collisional excitation rates from the atomic data archive of CHIANTI (Dere et al. 2009). This gives emission measures of 0.6, 2.5, 1.6, 1.9 and 1.2 cm-3 for , , , and using the observed line luminosities. Note that collisional ionized gas will have a much higher temperature (a few K), thus much lower , and requires one order of magnitude larger (Figure 6). Assuming a solar abundance for , i.e., , and being the dominated species of the atom, we can derive a minimum [Ar/H]-1 cm-3. Other lines give the same order of magnitude, but slightly lower . Considering unknown ionization correction, they can be taken as all consistent. Since Ar, S and Fe are synthesized only during SNe, it is unlikely that they are much more over-abundant in circum-stellar medium unless the coronal line region (CLR) was polluted SN process, which seems less likely (see below).
Next we explore what constraints on CLR can be imposed based on the above estimates. A minimum size of CLR can be set in the first place. For a uniform spherical CLR, the radius can be written as lt days, where is the density in units of cm-3, the emission measure in units of cm-3. [Fe X] has the lowest critical density of 1.5 cm-3 among these detected coronal lines, and gas density should not be much larger than this. This gives a minimum size of CLR of order one light day. On the other hand, with this minimum radius, the gaseous column density of CLR will be [Ar/H]-1/3 cm-2. At this column density, CLR is optically thick to X-rays up to ten keV. However, photo-ionization requires that CLR should be optically thin to soft X-ray rays because these photons ionize the gas. To meet this constraint, CLR must be much larger than this minimum radius, i.e., having much lower density. If the column density is less than a few cm-2, CLR will be order of a light year and the density around cm-3.
If gas in CLR is in a thin shell or clumpy, CLR can be smaller. In a thin shell case, the density and column density can be written as [Ar/H]-1/2 cm-3, and [Ar/H]-1/3 cm-2, where is the relative thickness. For a given density and , a smaller will result in a smaller column density and a larger radius. If , the gaseous column density will be order of a few 1022 cm-2, which is still not very optically thick to soft X-rays, and CLR is order of 10 light days. The column density and density for clumpy gas should be in between the thin shell and uniform sphere case. These exercises suggest that CLR should be larger than 10 light days in size.
Note in passing, if collisional de-excitation is important, the above estimated will be only a lower limit. On the other hand, Korista & Ferland (1989) showed that far-UV (300Å) continuum pumping process accounts for nearly half of coronal emission line intensity in Seyfert galaxies. The exact effect depends on the gas density and the shape of ionizing continuum. For the minimum size estimated above, the density is around cm-3. At this density, collision should dominate the excitation unless far-UV radiation field is very strong. Thus we believe that it will not affect the order of magnitude estimate above.
3.2 On the Ionizing Source
We assume that gas is photo-ionized because collisional ionization will require much larger emissivity. The ionization potential of Fe+8, Fe+9, Fe+12, S+10 and Ar+12 are 233.6, 262.1, 361, 504 and 685.9 eV, so soft X-rays are required to ionize them. With the above estimated density, the recombination time of the gas is , typically less than 1 hour for the ions listed above if cm-3, which should be shorter than the lasting time of X-ray radiation, while ionization time is even shorter than this if these ions are dominated species. Therefore, the gas is likely in quasi-ionization equilibrium. In this case, we can estimate the ionizing photons absorbed by the corresponding ions from their coronal lines. Each ion stays at the upper level on average for a time of before it recombines to a lower ionization sate, where is recombination coefficient to excited states 444Recombination to the ground state will give rise to an ionizing photon.. During that period, the ion is collisionally excited times. If collisional de-excitation is not important, each collisional excitation will result in a coronal line photon. Thus, the absorbed ionization photon flux can be written as, taking [Fe X]6376 as an example,
| (1) |
One can write similar equations for [Fe XI]7894, [Fe XIV]5304, [Ar XIV]4414 and [S XII]7612. By summing over all terms in the left and right, we estimate that a minimal X-ray luminosity absorbed by these ions is 50 of the total coronal line luminosity. Therefore, a minimum X-ray luminosity of a few erg s-1 is required to power the coronal lines in a photo-ionization equilibrium model. This estimate is in-exact because we have not considered two important processes. First, recombination to lower levels will emit a photon that may be able to ionize other ions. The re-emitted photons are distributed nearly isotropic with an average delay of recombination time with respective to incident ionizing radiation. Second, the ionization of other ions requires additional X-rays. For example, when [Fe X]6376 to [Fe XIV]5304 become dominant species, hydrogen and helium-like oxygen, lithium-like neon, magnesium, and L-shell silicon are by up to a factor of ten more abundant than Fe+10, Fe+11, Fe+14, S+12 and Ar+14 for a gas with solar metallicity. Giving the two effects are opposite, we believe that it still gives a reasonable order of magnitude estimate. Note that the above estimated X-ray luminosity is much lower than the X-ray luminosity of Seyfert galaxies with a similar coronal line luminosity ( and ; Gelbord et al. 2009).
As discussed in §3.1, it is quite possible that coronal line emission sustains for years although we only have an upper limit of 4 years to the decay time. In this case, the total energy in coronal lines would be about a few ergs. According to the above estimate, this requires a total energy in soft X-rays of ergs to power CLR. In addition, a large amount of UV photons are required to ionize light elements, such as hydrogen, helium, etc. It should be noted that coronal lines can be ionized by an active X-ray source or they may be echoes of a past soft X-ray flare on extended medium.
4 The Nature of Superstrong Coronal Line Emitters
4.1 A Class of Superstrong Coronal Emission Galaxies?
SDSS J0748+4712 is the second SSCLE reported to show large line variations on time scale of years. It shares many common properties with the first such object, SDSS J0952+2143 (Komossa et al. 2008; 2009). Coronal lines are among the strongest narrow line. [Fe X]6376 is as strong as [O III]5007 in SDSS J0952+2143, and all high ionization coronal lines are several times stronger than [O III]5007 in SDSS J0748+4712. An intermediate width component of Balmer lines is present in the SDSS spectra of both objects, although it is much stronger in SDSS J0952+2143. In either objects, high ionization coronal lines fades while low ionization lines remain constant or even increases years after its discovery. In SDSS J0952+2143, high ionization lines [Fe XIV]5304, [Fe XI]7894 and [Fe X]6376 decreased by a factor ten from 2005 to 2008, while [Fe VII]6087 by only 30% and [O III]5007 even slightly increased; in SDSS J0748+4712, coronal lines disappeared while [O III] increased by a factor 10 from 2004 to 2009. But there are some obvious differences in their SDSS discovery spectra. The SDSS spectrum of SDSS J0748+4712 displays prominent broad bumps and high ionization coronal lines but no [Fe VII] and He II4686, while the spectrum of the latter does not show such bumps but with prominent [Fe VII] and He II. Also intermediate width Balmer lines are much weaker in SDSS J0748+4712 than in SDSS J0952+2143. Note that [Fe X]6376 luminosity in SDSS J0748+4712 is a factor 5 times lower than in SDSS J0952+2143. We find four more SSCLEs in the SDSS spectroscopic sample of galaxies (including the one in Gelbord et al. 2009): two without [Fe VII] emission while another two similar to SDSS J0952+2143.
The similarity between SSCLEs with and without [Fe VII]6087 indicates that they are the same type object, while decreasing ionization with time in both objects suggests that different ionization of the line spectrum observed may be unified in a time evolution picture. SDSS J0748+4712 was observed earliest among them, so it show highest ionization level, and also displays continuum and bump emission. As time passes, the broad bumps disappeared and intermediate width Balmer lines increases, and the ionization of CLR decreases. Later on, both [Fe XIV],[Fe X] and intermediate width Balmer lines weaken, while [O III] and [Fe VII] strengthen. Further on, both coronal lines and the intermediate width component of Balmer lines disappear, and [O III] and low ionization narrow lines further brighten. The time scale for such evolution is 3-5 years. Future continuously monitoring of objects similar to SDSS J0748+4712 can verify this picture.
4.2 A Type II Supernova?
Three pieces of evidence points to a SN-like activity in SDSS J0748+4712: 0.1-0.2 magnitude brightening between the SDSS spectroscopic and photometric observations; three broad bumps in the SDSS spectrum similar to these seen in spectra of some young supernovae; and vanishing of such features and coronal lines in the spectra taken 4 years later. By comparison of SDSS photometric data with SDSS spectrum, we estimated absolute magnitudes of the SN-like flare with 16.7, 16.7 and 17.4 at , and bands before correction for internal extinctions. The internal reddening correcting is quite modest ( mag in ). This places its optical luminosity well in the range of a type II-P supernova (Poznanski et al. 2009).
The broad bumps are similar to these in the spectra of Type II-P supernovae a few days after the shock-break. In type II-P SN 2006bp, Dessart et al (2008) identified the bump around 4000Å as blended emission lines N III 4001-4099, that around 4600Å as blending of He II4686, N III4638, C III4647, and H I, and around 6500Å due to mixture of HI and HeI. With this interpretation, the stronger 4600Å bump and weak or absent He I 5760Å bump, in comparison with SN 2005ip, indicates stronger He II emission, thus a higher photosphere temperature. Notice that the 4600Å bump evolves very fast in the first few days due to rapid decrease of the photosphere temperature (Dessart et al. 2008), and SN 1999gi, SN 2006bp are the only type II-P known today to have been observed so early in the optical spectra showing He II emission lines. It is unclear whether a spectrum taken at slightly earlier time than the above two SNs will show 4600Å bump as strong as observed in this object, and whether other type core-collapse supernovae at early phase can also reproduce similar spectral feature. An intermediate width H line is seen in the residual spectrum. Such a line is usually considered as arising from interaction of the supernova with its circum-stellar medium (CSM; Filippenko 1997; Pastorello et al. 2002; Smith et al. 2010). The presence of such material can be considered as an evidence for a massive SN progenitor, which tends to support a core-collapse SN.
Even though a young SN II-P is a plausible explanation for the photometric variation and the broad bumps seen in the SDSS spectrum, such a scenario has several drawbacks in explaining coronal line emission. First, the X-ray from young type II-P SN is far insufficient to power the coronal lines. As noted in last section, a total amount of energy in the soft X-rays is likely greater than erg s-1. If this energy is released in the shock breakout, which lasts for about s, then the X-ray luminosity would be erg s-1. This is several orders of magnitude higher than expected X-ray emission from Type II SN (e.g., Soderberg et al. 2008; Nakar & Sari, 2010). Alternatively, the ionizing X-rays are produced in the shock of blast wave into the dense CSM. However, according to Chevaliar and Fransson (1994), interaction of expanding shell with the CSM can produce an X-ray luminosity of order erg s-1, assuming half of X-rays are absorbed by the shell, where is the shock velocity in units of km s-1, and is the particle density at shock frontier in units of cm-3 for a uniform spherical wind. This X-ray luminosity is an order of magnitude lower than that required to power the coronal lines if reasonable parameters are used. This energy budget is already noted by Komossa et al. (2009).
Second, SN template fit suggests that SN is very young, a few days after the shock breakout. If coronal line emission is related to SNe, CLR at SDSS observing time should be less than the light travel distance with the age of SN 555In the case a continuum flare during the SN breakout, the intense UV/X-ray ionizing photons will ionize CSM surrounding on the way they travel out. The ionized bubble expands nearly at the speed of light in the region optically thin to the ionizing continuum for the ionization parameters concerned here, but stalled after that. Due to the light traveling effect, the observed line photons come from a thick shell around the parabolic iso-delay surface, with a lag of SN age and a width of continuum duration, that intersects the CSM, in the optically thin case. In the case of , taking into account of such a delay will give a correction of order of unity.. However, a CLR of at least 10 light days is required to account for high coronal line luminosity as discussed in §3.2.
Finally, the width of coronal lines is not consistent with a RSG progenitor of Type II-P SN. Giving the line width of 300-450 km s-1in FWHM, it can not be formed in the shock region itself, which has a much larger velocity, or post-shock region because the expanding shell is opaque to these lines, rather it must be emitted from the pre-shocked region, as in the case of SN 2005ip (Smith et al. 2009). Also our analysis in §3.2 shows that CLR is much larger than the expanding shell. Thus, the kinematics of coronal line emitting gas reflects the undisturbed CSM. In this case, the line is broadened due to different projected velocity of wind, and the wind velocity must be a few hundred km s-1. This requires a compact progenitor, rather than a RSG, which produces a wind of order 15 km s-1. In viewing of these problems, if supernova is responsible for the strong coronal line emission, it must be very different from any known SN.
4.3 Tidal Disruption
Tidal disruption of a star by a supermassive/intermediate mass black hole (SMBH/IMBH) produces a flare, fading on time scales from several months to a year, in UV and X-rays with a peak luminosity close to Eddington one once part of debris falls back to form an accretion disk around the black hole (e.g., Rees 1988). Systematic search in the X-ray, UV and optical has lead the discovery of a dozen candidates (Komossa & Bade 2004; Halpern et al. 2004; Esquej et al. 2008; Rosswag, Ramirez-Ruiz & Hix 2009; Maksym, Ulmer & Eracleous 2010; Sari et al. 2009). Komossa et al (2008) proposed tidal disruption may be also responsible for variable coronal line emission. Both SDSS and our spectrum includes the galactic center, this process should be considered as well. As Komossa et al. (2009) pointed out that tidal disruption can potentially accounts for the observed emission line and continuum properties of SDSS J0952+2143 although detail model prediction is still lack. The UV and X-ray radiation from the accretion disk is a natural ionizing source. When the flare illuminates surrounding gas, it ionizes and excites gas, giving rise to broad and narrow emission lines, depending on the gas kinematics. The variable intermediate-width double horn Balmer lines in that object were interpreted as from unbounded tidal debris illuminated by the central radiation, while coronal lines are formed by the dense circum-nuclear gas.
Much of their arguments are valid for SDSS J0748+4712 as well. As far as the central back hole is greater than , the accretion disk can account for high soft X-ray ionizing photons. Black hole of in the galactic center is entirely possible giving the luminosity of the galaxy (), although much larger than this can be ruled out from stellar velocity dispersion measurement (Tremaine et al. 2002). If CLR is virialized and dominated by the gravity of the black hole, gas at will produce a line width similar around 300400 km s-1 (FWHM), similar to the observed coronal line width. For a black hole with a mass , this corresponds to a size of a few ten light days, which meet the constraints in §3.2.
Photometric variations and broad bumps in the spectrum can put additional constraints on the tidal disruption model. The accretion rate, so luminosity, is determined by the fall-back rate of bounded tidal debris, which decreases with time as after reaching its peak (Rees 1988; c.f. Lodato, King & Pringle 2009). The target was brighter during the SDSS spectroscopic observation than during the photometric observation. This set an upper limit to the age of disruption event to 4 months during SDSS spectroscopic observation in SDSS J0748+4712. The flare has an absolute optical magnitude during the spectroscopic observation, which is on the same order of magnitude as predicted by some models for a black hole (e.g., Strubbe & Quatuert 2009).
The broad bumps probably can be interpreted as optical emission lines. Strubbe & Quataert (2009) argued that most tidal debris should blow away in a wind at the early times, leaving very broad optical emission lines in the spectrum for black holes. In their model, the strongest lines are Balmer ones, which can not explain strong bumps in the SDSS spectrum of SDSS J0748+4712. However, if a star is strongly evolved, and much of hydrogen envelope has been stripped off. Then tidal debris should be helium-enriched, this may explain strong blue-shifted HeII line. It should be noted that the bumps around 4600Å can be fairly well fitted with a combination of HeII, H and 6560Å with H, with their line centers and widths locked. Detailed physical model, which is beyond the scope of this paper, is certainly needed to verify this explanation.
5 Conclusion
We detected broad bumps, reminiscent of a young type II-P supernova, and strong high ionization coronal lines in the spectrum of SDSS J0748+4712. The coronal line luminosity is typical of Seyfert galaxies, but other narrow lines suggest a normal star-forming galaxy. The source brightened by about 0.2 magnitudes in -band from the SDSS imaging to SDSS spectroscopic observations in 4 months. These bumps and coronal lines disappeared in the spectra taken 4-5 years later, while [O III] line increases by a factor of ten. The variation trend is similar to another SSCLE reported previously, suggesting of the same physical origin. Their different properties between the two objects may be ascribed to different observed evolution stage.
We set a robust lower limit on the size of CLR to be 10 light days, and on the total energy of the ionizing continuum in soft X-rays to be erg. Both the size of emission line region, high soft X-ray luminosity and broad width of coronal lines cannot be understood in the young Type II-P supernova context. If coronal lines are indeed associated with supernova explosion, then the supernova must be very different from that current known. We argued that tidal disruption of evolved star by a massive black hole may provide a viable explanation from the bumps and coronal lines. In this model, the bumps are considered as broad emission lines from winds produced during the tidal disrupted process (Strubbe & Quataert 2009), and the star is partially evolved.
A critical test to the above scenario should come from continuous monitoring the spectral evolution and early follow-up in other bands, such as X-ray, UV and infrared band, shortly after the discovery of the coronal line emitter. X-ray and UV emission from supernova predicted in current model drops very fast after hours and ten days (Nakar & Sari, 2010), while in the tidal disruption model, the tidal debris is accreted on the time scale of years (e.g., Lodato, King & Pringle 2009). We found that the absolute magnitude of the flare in GALEX NUV band is -17.3 at 20 days after the SDSS spectroscopic observation for SDSS J0748+4712, which is brighter than that predicted by supernova models, but consistent with the tidal disruption model. We plan to carry out such a survey with future Chinese spectroscopic survey telescope–LAMOST, and conduct early follow-up observations of such events with other observatories.
References
- Adelman-McCarthy et al. (2008) Adelman-McCarthy, J. K., et al. 2008, ApJS, 175, 297
- Clayton & Mathis (1989) Clayton, G. C., & Mathis, J. S. 1989, ApJ, 345, 245
- Chevalier & Fransson (1994) Chevalier, R. A., & Fransson, C. 1994, ApJ, 420, 268
- Dere et al. (2009) Dere, K. P., Landi, E., Young, P. R., Del Zanna, G., Landini, M., & Mason, H. E. 2009, A&A, 498, 915
- Dessart et al. (2008) Dessart, L., et al. 2008, ApJ, 675, 644
- Esquej et al. (2008) Esquej, P., et al. 2008, A&A, 489, 543
- Filippenko (1997) Filippenko, A. V. 1997, ARA&A, 35, 309 bibitem[Filippenko & Korth(1991)]1991IAUC.5234….1F Filippenko, A. V., & Korth, S. 1991, IAU Circ., 5234, 1
- Gelbord et al. (2009) Gelbord, J. M., Mullaney, J. R., & Ward, M. J. 2009, MNRAS, 397, 172
- Gezari et al. (2009) Gezari, S., et al. 2009, ApJ, 698, 1367
- Gröningsson et al. (2006) Gröningsson, P., Fransson, C., Lundqvist, P., Nymark, T., Lundqvist, N., Chevalier, R., Leibundgut, B., & Spyromilio, J. 2006, A&A, 456, 581
- Halpern et al. (2004) Halpern, J. P., Gezari, S., & Komossa, S. 2004, ApJ, 604, 572
- Immler et al. (2007) Immler, S., et al. 2007, ApJ, 664, 435
- Kewley et al. (2006) Kewley, L. J., Groves, B., Kauffmann, G., & Heckman, T. 2006, MNRAS, 372, 961
- Komossa & Bade (1999) Komossa, S., & Bade, N. 1999, A&A, 343, 775
- Komossa et al. (2008) Komossa, S., et al. 2008, ApJ, 678, L13
- Komossa et al. (2009) Komossa, S., et al. 2009, ApJ, 701, 105
- Korista & Ferland (1989) Korista, K. T., & Ferland, G. J. 1989, ApJ, 343, 678
- Lodato et al. (2009) Lodato, G., King, A. R., & Pringle, J. E. 2009, MNRAS, 392, 332
- Leonard et al. (2002) Leonard, D. C., et al. 2002, AJ, 124, 2490
- Lu et al. (2006) Lu, H., Zhou, H., Wang, J., Wang, T., Dong, X., Zhuang, Z., & Li, C. 2006, AJ, 131, 790
- Maksym et al. (2010) Maksym, W. P., Ulmer, M. P., & Eracleous, M. 2010, ApJ, 722, 1035
- Matheson et al. (2001) Matheson, T., Filippenko, A. V., Li, W., Leonard, D. C., & Shields, J. C. 2001, AJ, 121, 1648
- Nakar & Sari (2010) Nakar, E., & Sari, R. 2010, ApJ, 725, 904
- Pettini & Pagel (2004) Pettini, M., & Pagel, B. E. J. 2004, MNRAS, 348, L59
- Pastorello et al. (2002) Pastorello, A., et al. 2002, MNRAS, 333, 27
- Poznanski et al. (2009) Poznanski, D., et al. 2009, ApJ, 694, 1067
- Quimby et al. (2007) Quimby, R. M., Wheeler, J. C., Höflich, P., Akerlof, C. W., Brown, P. J., & Rykoff, E. S. 2007, ApJ, 666, 1093
- Rees (1988) Rees, M. J. 1988, Nature, 333, 523
- Rosswog et al. (2009) Rosswog, S., Ramirez-Ruiz, E., & Hix, W. R. 2009, ApJ, 695, 404
- Schlegel et al. (1998) Schlegel, D. J., Finkbeiner, D. P., & Davis, M. 1998, ApJ, 500, 525
- Smith et al. (2009) Smith, N., et al. 2009, ApJ, 695, 1334
- Smith et al. (2010) Smith, N., Chornock, R., Silverman, J. M., Filippenko, A. V., & Foley, R. J. 2010, ApJ, 709, 856
- Soderberg et al. (2008) Soderberg, A. M., et al. 2008, Nature, 453, 469
- Strubbe & Quataert (2009) Strubbe, L., & Quatuert, E. 2009, MNRAS, 400, 2070
- York et al. (2000) York, D. G., et al. 2000, AJ, 120, 1579
| Line | bbIncluding the SDSS instrument width of about 69 km s-1. | ||
|---|---|---|---|
| Å | km s-1 | ||
| [O II]3727 | 3727.300.14 | 85 8 | 39 5 |
| [O II]3729 | 3730.06 | 85 | 525 |
| [Ar XIV]4414 | 4414.280.55 | 24622 | 39 5 |
| H | 4863.160.15 | 122 9 | 61 4 |
| [O III]4959 | 4960.910.19 | 69ccThe value is pegged at the lower-limit during the fit. | 4 2 |
| [O III]5007 | 5008.85 | 69 | 13 3 |
| [Fe XIV]5304 | 5304.340.29 | 19917 | 80 6 |
| [Fe X]6376 | 6377.210.34 | 25116 | 94 6 |
| [N II]6548 | 6550.290.05 | 80 2 | 21 1 |
| H | 6565.10 | 80 | 152 6 |
| H | 6566.400.90 | 46059 | 99 11 |
| [N II]6583 | 6585.70 | 80 | 64 3 |
| [S II]6716 | 6718.800.14 | 79 6 | 35 3 |
| [S II]6731 | 6733.18 | 79 | 24 3 |
| [S XII]7612 | 7611.870.90 | 14259 | 38 11 |
| [Fe XI]7894 | 7896.340.37 | 14514 | 81 7 |