Herschel††thanks: Herschel is an ESA space observatory with science instruments provided by European-led Principal Investigator consortia and with important participation from NASA. observations of the Centaurus cluster - the dynamics of cold gas in a cool core
Abstract
Brightest cluster galaxies (BCGs) in the cores of galaxy clusters have distinctly different properties from other low redshift massive ellipticals. The majority of the BCGs in cool-core clusters show signs of active star formation. We present observations of NGC 4696, the BCG of the Centaurus galaxy cluster, at far-infrared (FIR) wavelengths with the Herschel space telescope. Using the PACS spectrometer, we detect the two strongest coolants of the interstellar medium, [Cii] at 157.74 m and [Oi] at 63.18 m, and in addition [Nii] at 121.90 m. The [Cii] emission is extended over a region of 7 kpc with a similar spatial morphology and kinematics to the optical H emission. This has the profound implication that the optical hydrogen recombination line, H, the optical forbidden lines, [Nii] , the soft X-ray filaments and the far-infrared [Cii] line all have the same energy source.
We also detect dust emission using the PACS and SPIRE photometers at all six wavebands. We perform a detailed spectral energy distribution fitting using a two-component modified black-body function and find a cold 19 K dust component with mass 1.6 and a warm 46 K dust component with mass 4.0. The total FIR luminosity between 8 m and 1000 m is 7.5, which using Kennicutt relation yields a low star formation rate of 0.13 . This value is consistent with values derived from other tracers, such as ultraviolet emission. Combining the spectroscopic and photometric results together with optical H, we model emitting clouds consisting of photodissociation regions (PDRs) adjacent to ionized regions. We show that in addition to old and young stellar populations, there is another source of energy, such as cosmic rays, shocks or reconnection diffusion, required to excite the H and [Cii] filaments.
1 Introduction
Clusters of galaxies offer us a unique opportunity to study astrophysical components on widely differing scales. Intensive theoretical and observational efforts have revealed that these components are closely tied to one another. The megaparsec-scale intracluster medium (ICM) is a hot plasma emitting bremsstrahlung X-ray radiation. The central regions of this plasma (kpc) have high electron densities; hence the numerous observed clusters with peaked surface-brightness profiles. Such high gas densities imply rapid gas cooling () leading to a steady, mass deposition rate (tens to a few hundreds yr-1) (e.g. Fabian, 1994) and iteratively increasing central densities.
However, this picture is far from complete. High-resolution XMM-Newton spectral and Chandra imaging of cool-core (CC) clusters (e.g., Tamura et al., 2001; Peterson et al., 2001; Kaastra et al., 2001; Peterson et al., 2003; Xu et al., 2002; Sakelliou et al., 2002; Sanders et al., 2008; Hudson et al., 2010) have shown very little cool gas in their cores with the central temperatures no lower than a fifth of the virial temperature. Heating by clustercentric active galactic nuclei (AGN) through outflows (possibly in conjunction with other processes like heat conduction, cosmic-ray heating and convection) appears to be an irreplaceable heating mechanism that prevents the gas from undergoing excessive cooling (e.g. Binney & Tabor, 1995; Churazov et al., 2002; Roychowdhury et al., 2004; Voit & Donahue, 2005). Several studies have established morphological, statistical and physical correlations between X-ray properties of CC clusters and AGN at their centers (Burns, 1990; Bîrzan et al., 2004; Rafferty et al., 2006; Peterson & Fabian, 2006; Mittal et al., 2009; McNamara & Nulsen, 2007; Dunn & Fabian, 2006; Edwards et al., 2007) that support active galactic nuclei as the primary heating candidates.
Despite AGN and other plausible sources of heating which stop the ICM from cooling catastrophically, recent observations of many () brightest cluster galaxies (BCGs) show that the intracluster medium gas is cooling but at a much suppressed level. They appear to have substantial amount of cold gas, of which a small fraction is forming stars (e.g., Johnstone et al., 1987; McNamara et al., 1989; Edge & Frayer, 2003; O’Dea et al., 2004; O’Dea et al., 2010, 2008; Hicks & Mushotzky, 2005; Mittaz et al., 2001; Allen, 1995). It seems that the cold gas is able to somehow survive for long periods of time.
A significant number of cool-core clusters show optical line-filaments, such as in A 426 (Perseus, Conselice et al., 2001), A 1795 (Crawford et al., 2005). Crawford et al. (1999) did an optical study of dominant galaxies in X-ray selected galaxy clusters and showed that about 25 % of them have H emission-line in their spectra with intensity ratios typical of cooling flow nebulae (also see Hu et al., 1985; Heckman et al., 1989). Amidst these exciting discoveries of H, Canning et al. (2010) have detected the optical coronal line emission [FeX] 6374 in NGC 4696 using VIMOS spectra, implying yet another component of gas at temperatures in the range to K (also see Oegerle et al., 2001; Bregman et al., 2006). Warm molecular H2 at K (Jaffe & Bremer, 1997; Donahue et al., 2000; Edge et al., 2002; Hatch et al., 2005), cold molecular H2 at (300-400) K (Johnstone et al., 2007) and cold CO gas at few tens of kelvin (Edge, 2001; Salomé et al., 2008) also exists in the cores and also regions overlapping with the extended optical filaments. Edge (2001) detected 16 CC clusters with IRAM and JCMT, implying a substantial mass of molecular gas within 50 kpc radius of the BCGs. Similarly, Salomé & Combes (2003) studied 32 BCGs in cool-core clusters with the IRAM 30 m telescope and found gas masses between to .
From the above observations of CC clusters it is clear that there are different components of gas at almost every temperature in the range varying from the virial temperature of the ICM ( K) to the temperature of the star-forming molecular clouds ( K). An important result from the point of view of energetics of the observed warm molecular hydrogen emission and also the optical coronal emission line is that these emissions are very likely due to the gas being reheated rather than cooling out of the ICM (Donahue et al., 2000; Canning et al., 2010). The molecular H2 emission, for example, is too bright to arise from gas cooling out of the ICM. Based on the measured H2 line luminosity and assuming the fraction of cooling in the line emission, , the estimated mass cooling rate is two orders of magnitude larger than the mass deposition rate predicted from the X-ray surface brightness profile. Understanding the details of how the mass and energy transfer occurs is crucial. To that end a key component is the molecular gas and dust at K, whose natural emission is accessible by Herschel.
In this paper, we study NGC 4696, the brightest galaxy of the Centaurus cluster of galaxies (Abell 3526). This work is a part of a Herschel Open Time Key Project devoted to study cold gas and dust in 11 BCGs. Preliminary results of this study can be found in Edge et al. (2010b) and Edge et al. (2010a). NGC 4696 is at a redshift of 0.01016 (Postman & Lauer, 1995) corresponding to a radial velocity of 3045 km s-1. Owing to its proximity, this cluster has been a subject of numerous studies (e.g. Fabian et al., 1982; Lucey et al., 1986; de Jong et al., 1990; Sparks et al., 1989; O’Dea et al., 1994; Allen & Fabian, 1994; Sparks et al., 1997; Laine et al., 2003; Crawford et al., 2005; Taylor et al., 2006; Johnstone et al., 2007; Canning et al., 2010; Farage et al., 2010). The Chandra X-ray observations show a bright dense core with plume-like structures that spiral off clockwise to the northeast. It is a classic cool-core cluster based on its short central [at 5 kpc (111 is the radius within which the average mass density of the cluster is 500 times the critical density of the Universe.)] cooling time (Gyr). However, the expected gas mass deposition rate within the cooling region is relatively small, a few tens of solar masses per year (Fabian et al., 1982; Hudson et al., 2010; Ikebe et al., 1999; Sanders & Fabian, 2002). Detailed XMM-Newton Reflection Grating Spectrometer (RGS) observations indicate the presence of cool gas at the center of the cluster with temperature in the range of (0.35 to 3.7) keV. Optical observations reveal bright line-emitting filaments in [Nii] and H, which were first discovered by Fabian et al. (1982) and have been mapped more recently using the EMMI instrument on the 3.58 m New Technology Telescope with a much higher resolution by Crawford et al. (2005). These filaments extend out in a similar manner to the spiral structure seen in the X-ray. They also show a remarkable spatial correlation with the dust features, in particular the dust lane seen looping around the core of the NGC 4696 (Sparks et al., 1989; Laine et al., 2003).
NGC 4696 is a host to the low-power steep-spectrum FR I radio source, PKS 1246-410 (e.g. Taylor et al., 2006). The total radio luminosity of the radio source is erg s-1 (Mittal et al., 2009). The radio core coincides well with the duo-core optical nucleus revealed by the high-resolution HST imaging. The radio emission, which shows a one-sided jet oriented to the south on small (pc) scales that into lobes oriented east-west on kpc-scales (Taylor et al., 2006). The total extent of the lobes along the east-west direction is about 10 kpc after which both the lobes eventually turn south. The radio plasma is clearly interacting with the hot X-ray gas and seems to be correlated with the X-ray cavities.
We describe the Herschel observations and data reduction in Sect. 2 and the results in Sect. 3. We present an analysis of the AGN contribution and kinematics in Sect. 4 and a detailed modeling of the photodissociation region in Sect. 5. We give our final conclusions in Sect. 6 and a summary of this study in Sect. 7. We assume throughout this paper the CDM concordance Universe, with km s-1 Mpc-1, and . This translates into a physical scale of kpc at the redshift of NGC 4696.
2 Herschel Observations and Data Analysis
We used the ESA Herschel space observatory (Pilbratt et al., 2010) using PACS (Poglitsch et al., 2010) and SPIRE (Griffin et al., 2010) to study the cold phase ( K) of the interstellar and intracluster medium. The aim of these observations was to understand the details of mass and energy transfer between the different phases of gas. In particular, we study photodissociation regions (PDRs) which are relatively small in volume-filling factor but owing to high densities (and thermal pressures) as compared to that of the average interstellar medium (ISM) dominate the radiation of a galaxy (e.g. Hollenbach & Tielens, 1999). PDRs define the emission characteristics of the ISM and star formation regions in a galaxy. They primarily comprise molecular hydrogen, ionized carbon, neutral oxygen, CO and dust, such as silicates, silicate carbides, poly aromatic hydrocarbons (PAHs) etc. Detailed PDR descriptions and chemical processes can be found in (e.g. Hollenbach & Tielens, 1999; Kaufman et al., 1999; Röllig et al., 2007).
2.1 PACS Spectrometry
| Line | Peak Rest | ObsID | Duration | Bandwidth | Spectral FWHM | Spatial FWHM | Mode | ||
|---|---|---|---|---|---|---|---|---|---|
| ( m) | (s) | ( m) | (km s-1) | ( m) | (km s-1) | ||||
| OI | 63.180 | 1342188700 | 6912 | 0.266 | 1250 | 0.017 | 79 | 3x3 raster, step size | |
| CII | 157.74 | 1342188700 | 3096 | 1.499 | 2820 | 0.126 | 237 | 3x3 raster, step size | |
| NII | 121.90 | 1342188701 | 3440 | 1.717 | 4180 | 0.116 | 280 | pointed | |
| OIII | 88.36 | 1342188701 | 3680 | 0.495 | 1660 | 0.033 | 110 | pointed | |
| OIb | 145.52 | 1342188702 | 3440 | 1.576 | 3215 | 0.123 | 250 | pointed | |
| SiI | 68.47 | 1342188702 | 3840 | 0.218 | 945 | 0.014 | 62 | pointed | |
We observed the two primary coolants of the neutral ISM, the [Cii] line at 157.74 m and the [Oi] line at 63.18 m, along with [Oib] at 145.52 m, [Sii] at 68.470 m, [Nii] at 121.90 m and [Oiii] at 88.36 m with the PACS spectrometer on Herschel. The 2PP1/2 fine-structure emission line of [Cii] is very often the brightest emission line in galaxy spectra, followed by the [Nii] lines at 122 m (3PP1) and 205 m (3PP0). Ionized nitrogen and oxygen are mainly produced in warm ionized medium, such as Hii regions, and so the [Nii] 122 m and the [Oiii] 88.36 m lines can be used to obtain constraints on the fractions of ionized and neutral media.
All lines were observed in the line-spectroscopy mode with the chopping and nodding implementation to subtract the rapidly varying telescope background and dark current. The details of the observational parameters are summarized in table 1. We used the large chopper throw throughout, such that the mirror chops two regions of sky apart alternately. While [Oi] and [Cii] observations were made in the raster-mapping mode, all the other line observations were made in the pointed mode with a field of view of . The PACS spectrometer contains an image slicer unit for integral field spectroscopy. The slicer transforms a 5x5 pixel focal plane image into a linear array of 25 spatial pixels termed , each in size. This technique ensures high sensitivity to detecting weak emission lines and provides simultaneous spectra of all extended emission in the field of view. The signal from each spaxel then goes through the grating assembly resulting in 16 spectral elements. The PACS spectrometer has two channels, red (51-105) m and blue (102-220) m, which can be operated at the same time. This allowed us to perform sequential observations of both [Oi] and [Cii]. The raster mapping consisted of a 3 by 3 array of overlapping single pointings (3 raster lines and 3 points per line) separated by in both the directions, along and orthogonal to the raster lines.
We applied the standard pipeline routines described in the PACS data reduction guideline (PDRG) to process the data from their raw state (level 0) to a fully-calibrated state (level 2), using the Herschel Interactive Processing Environment (HIPE) (Ott, 2010) version 3.0 CIB 1475. The data-reduction steps included removing cosmic-ray glitches and correcting for the intrinsic non-linearities. We used the ground-based flat-field estimates to correct for the pixel responses, which are known to overestimate the fluxes. We followed the PACS spectroscopy performance and calibration (PSPC) memo to correct the fluxes by applying factors of 1.3 for the blue band and 1.1 for the red band. The penultimate final PACS data product is in the form of two cubes, corresponding to the two nodding positions, where is the number of wavelengths present. This product is further rebinned in wavelength in accordance with the actual wavelengths present and the user-requested resolution (see Sect. 2.1.1). The PACS spatial resolution varies from for the [Cii] 157.74 m line to for the [Oi] 63.18 m line.
2.1.1 Over- and up-sampling factors
As mentioned above, the cubes are further rebinned in wavelength by applying two factors called ‘oversample’ and ‘upsample’. The oversample factor increases the number of bins over which the data are averaged to create a spectrum and the upsample factor specifies the shift in wavelength in the units of the binwidth. The default values, oversample=2 and upsample=1, correspond to the signal sampled at the Nyquist-Shannon rate, yielding the instrument spectral resolution at that wavelength. Increasing the upsample factor, for example, to upsample=2 yields two spectra, both adhering to the instrument resolution but shifted by half a binwidth with respect to each other. An upsample factor greater than unity may be used to identify features narrower than the instrument resolution in the line profile but at the expense of increased noise. Lastly, the combination oversample=1 and upsample=1 undersamples the data to render a spectral resolution a factor of two coarser than the original one, hence affecting the full-width half maximum (FWHM) of the fitted line. We investigated various combinations of oversample and upsample factors for each of the lines to optimize the signal to noise ratio and the spectral resolution.
2.1.2 Line Flux Estimation
In the case of emission well-centered on the central spaxel, a wavelength-dependent point-source correction factor has to be applied to the measured line flux-density to account for the fraction of the beam that is lost to the neighbouring spaxels (beam spillover). An alternate way of recovering the flux in the entire beam is to co-add the spectra obtained in different spaxels but this method suffers from the risk of line distortion. A yet alternate method is to keep the spectra separate and add only the fluxes contained in the spaxels with significant point source contribution. This method works well also for slightly extended sources provided that the emission is fully contained within the central few spaxels of the pointing. However, in case of extended emission spread over more than a single pointing (), we used the HIPE inbuilt task ‘specProject’ for obtaining the integrated line flux. This algorithm involves a projection of all the positions in the input cube onto the sky. It calculates a regular RA/Dec grid with a default spaxel size of and projects the raster positions onto it. The details of this algorithm can be found in the spectroscopy pipeline described in the PDRG documentation. Thereafter, we conducted ‘aperture photometry’ by placing a rectangular box around the visible emission and integrating the flux to obtain a spectrum. Since none of our observations were performed in dithered mode, the main necessity of using ‘specProject’ was to obtain a projection of the multiple single pointings on the sky plane. Since the individual pointings overlap by a considerable amount, simply adding the fluxes in all spaxels contributing above a certain threshold results in an overestimation of the line emission.
We used the Levenberg-Marquardt minimization routine (Levenberg, 1944; Marquardt, 1963) to fit a model to an observed spectrum. The model comprised a gaussian for the line emission and a polynomial of order 0 (or 1) for the pseudo-continuum222Presently, there are offsets in the continuum levels between the different spaxels preventing the extraction of reliable continuum data. baseline. A positive line detection was based in terms of the signal-to-noise ratio (SNR). The SNR was defined as the ratio of the line peak to the standard deviation of the data about the fitted model.
2.2 PACS Photometry
The PACS photometric observations were taken in large scan mapping mode in all three bands of the photometer, blue-short (BS) (70 m), blue-long (BL) (100 m) and red (R) (160 m) using the medium scan speed (s-1). The scan maps comprised 18 scan line legs of length and cross-scan step of . Each observation had a “scan” and an orthogonal “cross-scan” direction and we calibrated the corresponding data separately before combining them into a single map of . The resulting maps have a resolution of and at 70 m, 100 m and 160 m. The PACS photometer performs dual-band imaging such that the BS and BL bands each have simultaneous observations in the R band so we have two sets of scans in the R band.
For PACS photometry, we used the HIPE version 3.0 CIB 1475 to reduce the data and adopted the PDRG to process the raw level-0 data to calibrated level 2 products. We employed the official script for PACS ScanMapping mode with particular attention to the high pass filtering to remove “1/” noise. We used the ‘HighPassFilter’ method to remove the large scale () artefacts. The target BCG and other bright sources in the field were masked prior to applying the filter. The size of the mask was chosen to be less than the filter size so as to minimize any left-over low-frequency artefacts under the masks. We used a filter size of 20 readouts for the BS and BL bands and 30 readouts for the R band and a mask radius of for the BS and BL bands and for the R band. Finally the task ‘photProject’, was used to project the calibrated data onto a map on the sky in units of Jy pixel-1. The “scan” and “cross-scan” maps were then averaged together to produce the final coadded map.
| Line | (m) | Offset (km s-1) | FWHM (km s-1) | Line Flux | Total Extent | ||
|---|---|---|---|---|---|---|---|
| zbcg | zcl | Obs. | Intrinsic | () W/m2 | |||
| [Oi] | 63.8270.005 | -1528 | -5228 | 22854 | 21835 | 57.67.7 | |
| [Cii] | 159.3700.003 | 1811 | -2211 | 41013 | 33516 | 174.73.1 | |
| [Nii] | 123.1710.009 | 4840 | 840 | 45254 | 35169 | 24.91.7 | |
| [Oiii] | … | … | … | … | … | … | |
| [Oib] | … | … | … | … | … | … | |
| [Sii] | … | … | … | … | … | … | |
2.3 SPIRE Photometry
The SPIRE photometry was performed in the large scan map mode with cross-linked scans in two orthogonal scan directions. The photometer has a field of view of , which is observed simultaneously in three spectral bands, PSW (250 m), PMW (350 m) and PLW (500 m) with a resolution of about , and , respectively.
For SPIRE photometry, we used a newer HIPE version 4.0 CIB 1432 and the standard HIPE pipeline for the LargeScanMap observing mode and the naïve map-maker. The pre-processed raw telemetry data were first subject to engineering conversion wherein the raw timeline data were converted to meaningful units, the SPIRE pointing product was created, deglitching and temperature drift correction were performed, and maps were created, the units of which were Jy beam-1.
3 Results
3.1 Line Detections
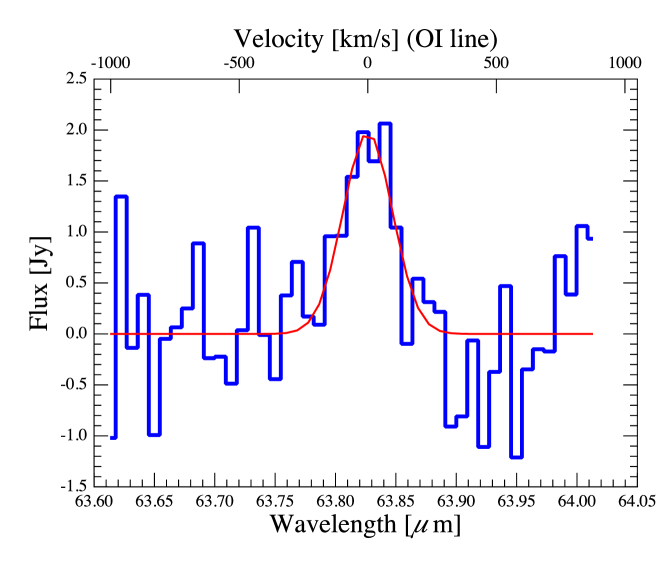
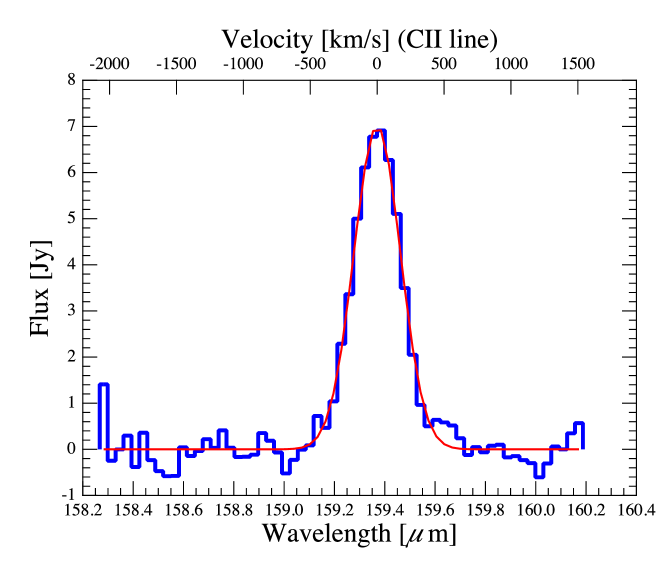
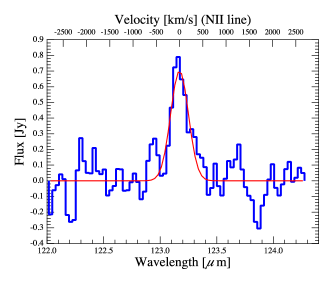
Of the lines observed, we detected [Oi], [Cii] and [Nii] in NGC 4696 (Fig. 1). We did not detect [Sii], [Oiii] and [Oib] emission lines at a 3 level of W/m2 for [Sii] and [Oiii], and W/m2 for [Oib]. The line parameters are summarized in table 2.
The [Nii] emission line at 121.9 m has been detected only in the central spaxel. The [Oi] emission line spectrum at 63.18 m, although noisy, has clearly been detected. Shown in the top left panel of Fig. 1 is the continuum-subtracted spectrum integrated over a central region of in diameter (3 kpc). Hence, the [Oi] emission is slightly extended. The spectrum is obtained with oversample=2 and upsample=1 followed by the projection technique, ‘specProject’, described in Sect. 2.1.2.
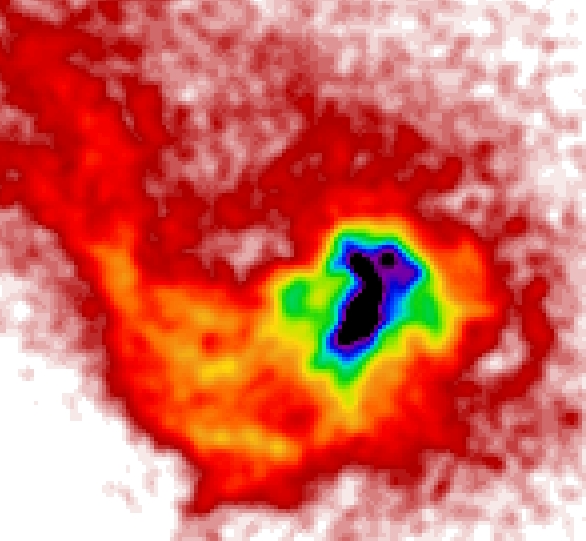
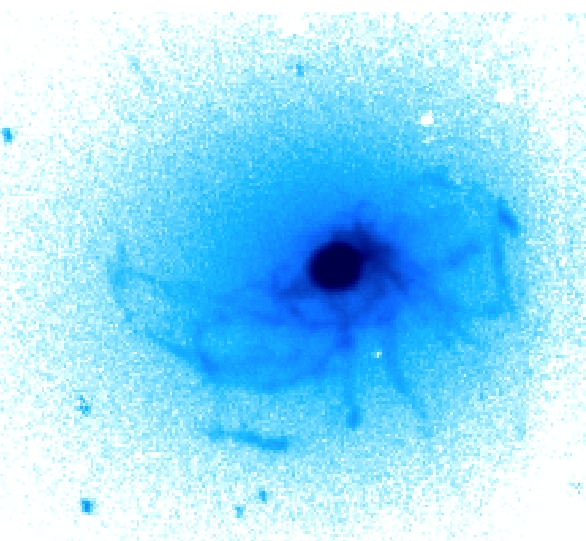
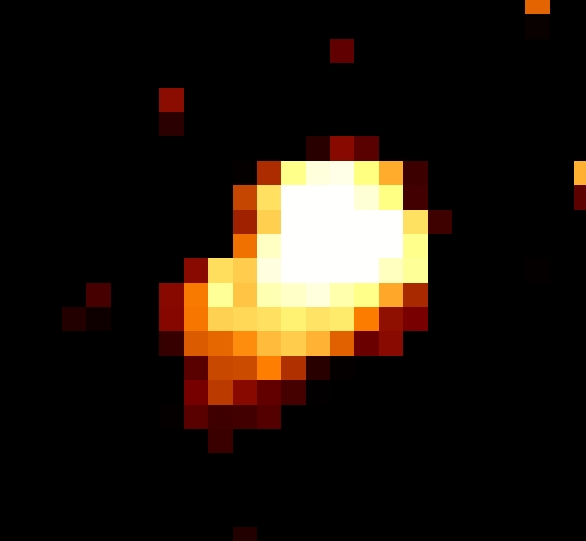
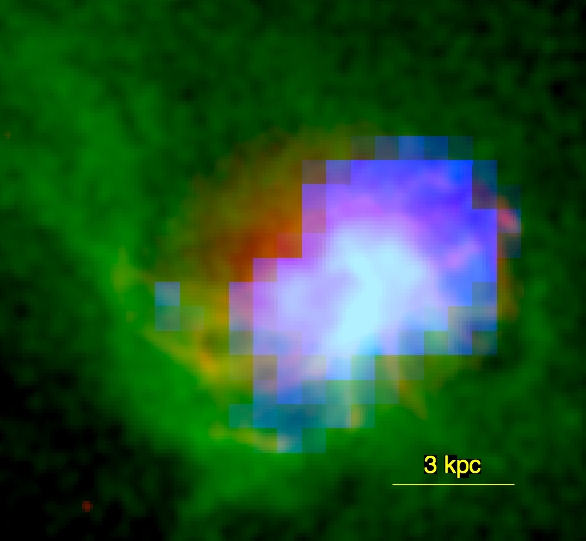
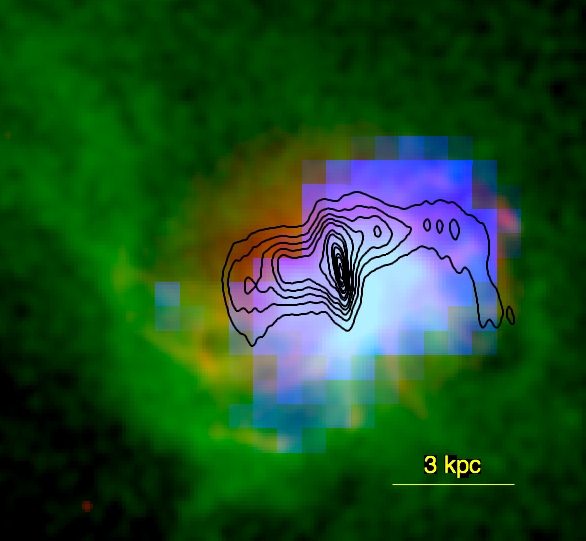
The [Cii] continuum-subtracted integrated line emission at 157.74 m is shown in the top right panel of Fig. 1. It is obtained using oversample=1 and upsample=4 and projecting the two nods onto the sky. Though oversample=1 results in poorer instrumental resolution, it helps in beating down the noise and upsample=2 or 4 helps recover some of the lost information. The two-dimensional distribution of [Cii] emission is shown in the multiwavelength collage in Fig. 2, which contains an optical H image from NTT, an X-ray image from Chandra and 1.4 GHz radio contours from VLA/NRAO333The National Radio Astronomy Observatory is a facility of the National Science Foundation operated under cooperative agreement by Associated Universities, Inc.. The Chandra datasets used to create the upper left panel of Fig. 1 were ObsIds 504, 4954, 4955 and 5310, which were first presented in Sanders & Fabian (2002) and Fabian et al. (2002); Fabian et al. (2005). The archival datasets were reprocessed with ciao 4.3 and caldb 4.4.0 to apply the appropriate gain and charge transfer inefficiency correction, then filtered to remove photons detected with bad grades and cleaned of flare periods. The final cleaned exposure time was 201.6 ks. Each of the final cleaned events files was then reprojected to match the position of the 4954 observation. A combined image was produced by summing images in the (0.5 to 1.0) keV band extracted from the individual reprojected datasets. This image was then corrected for exposure variation by dividing the summed image by summed exposure maps created for each dataset.
The total extent of the [Cii] emission is about (7 kpc) in diameter. The [Cii] image exhibits a northwest-southeast elongation, which in conjunction with the optical and X-ray emission maps of the spiral filaments, is clearly the overall elongation direction associated with NGC 4696. The PACS continuum dust emission shows similar asymmetry about the center of the galaxy (Fig. 3). The bulk of the [Cii] emission appears to be displaced to the west relative to the H core. The centroid of the [Cii] emission is indeed offset to the west of the H core by about (half spaxel size). The reported absolute pointing accuracy of Herschel is for pointed observations and larger for scan map observations. As a check, we analysed the [Cii] line observations with the latest official version of HIPE (6.0.2055) with updated calibration files and found a similar distribution of the [Cii] emission with a similar offset from the H core. While the offset between the [Cii] and H emission may also be real and reflect inhomogeneities in the ISM properties or different excitation mechanisms, given the similarity between [Cii] and H it is more likely that the offset is due to the pointing uncertainty.
3.2 Aperture Photometry
We conducted aperture photometry using a variety of different methods with the aim of attaining robust flux measurements and reliable uncertainties. These methods included routines inbuilt within HIPE, GAIA (Graphical Astronomy and Image Analysis Tool) etc. The spread in the flux estimates was within the random noise associated with the measurements.
For PACS flux densities, small aperture corrections were applied as outlined in the PACS ScanMap release note. Further flux calibration on the derived flux densities was performed to account for the known overestimation introduced by the ground-based flux calibration by factors of 1.05, 1.09 and 1.29 in the BS, BL and R bands respectively. The PACS absolute flux accuracy is within 10 % for BS and BL, and better than 20 % for R. The uncertainties are not believed to be correlated due to the BS and BL bands being taken at different times and the R band using a different detector. Since we used a newer HIPE version to obtain SPIRE images, the known flux calibration offset was accounted for during the data conditioning and hence no multiplicative calibration factors were required. The SPIRE absolute flux accuracy is within 15 % for all three bands. The flux measurements from Herschel and other instruments are given in table 3.
| (m) | Instrument | Aperture | Flux (mJy) |
| 3.6 | IRAC Spitzera | 32817 | |
| 4.5 | IRAC Spitzera | 19110 | |
| 5.8 | IRAC Spitzera | 1628 | |
| 8.0 | IRAC Spitzera | 1005 | |
| 12 | IRASc | ||
| 24 | MIPS Spitzera | 25.63.0 | |
| 24 | MIPS Spitzerb | 244 | |
| 25 | IRASc | ||
| 60 | IRASc | 10023 | |
| 70 | MIPS Spitzera | 16533 | |
| 70 | MIPS Spitzerb | 15619 | |
| 70 | PACS Herscheld | 11411 | |
| 100 | PACS Herscheld | 24424 | |
| 100 | IRASc | 830148 | |
| 160 | PACS Herscheld | 38377 | |
| 160 | MIPS Spitzera | 25651 | |
| 160 | MIPS Spitzerb | 33129 | |
| 250 | SPIRE Herscheld | 20830 | |
| 350 | SPIRE Herscheld | 9815 | |
| 500 | SPIRE Herscheld | 386 | |
| a The Spitzer IRAC/MIPS data are from a sub-sample of the ACCEPT sample of galaxy clusters (Hoffer et al., 2011, in preparation). The errorbars reflect the absolute flux uncertainties. | |||
| b Kaneda et al. (2005); Kaneda et al. (2007). | |||
| c The IRAS data are from NASA/IPAC Extragalactic Database (http://nedwww.ipac.caltech.edu). | |||
| d Herschel PACS/SPIRE data are from this work. The Herschel PACS/SPIRE errorbars reflect the absolute flux uncertainties: 10% at PACS BS and BL and 20% at R, and 15% at all SPIRE wavelengths. | |||
Our Herschel flux estimate disagrees with the Spitzer MIPS 160 m measurement of Hoffer et al. (2011), though it is consistent with the measurement of Kaneda et al. (2005). A systematic error in the performance of either of the two instruments can be ruled out since while at 70 m the Spitzer flux estimate is higher than the Herschel estimate, at 160 m the situation is reversed. In addition, we also ruled out the discrepancy being due to the difference in the spectral response functions of Herschel PACS and Spitzer MIPS photometers. We used the above fitted SED of NGC 4696 as the ‘true’ source model and calculated the predicted flux density for each instrument as the weighted average, where the weights were determined from the spectral response function of each instrument. The Herschel PACS and Spitzer MIPS predicted flux densities at 70 m and 160 m estimated this way are consistent with each other to better than 5 %. Since the Spitzer MIPS 160 m flux shows a spread between the measurements from Kaneda et al. (2005) and Hoffer et al. (2011), we give preference to the Herschel estimates, especially since Herschel is designed to operate at higher sensitivity at FIR wavelengths.
3.3 Dust SED
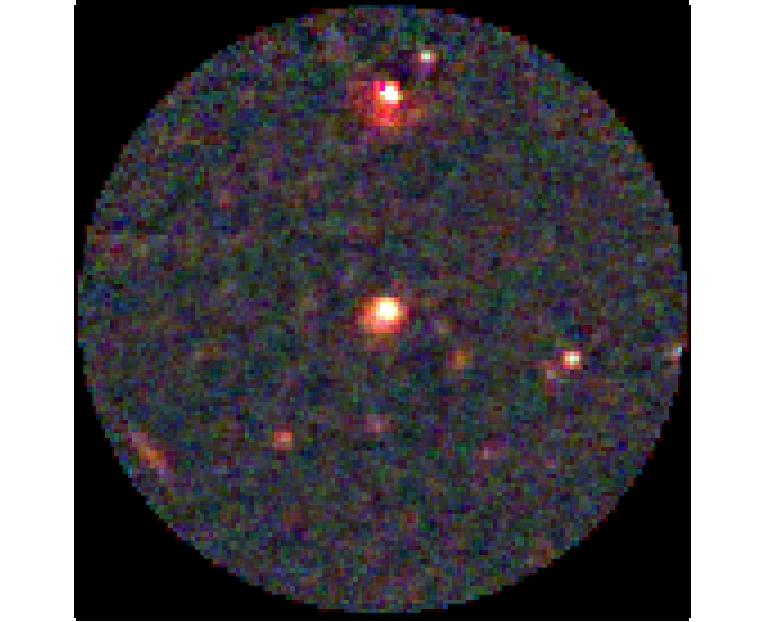
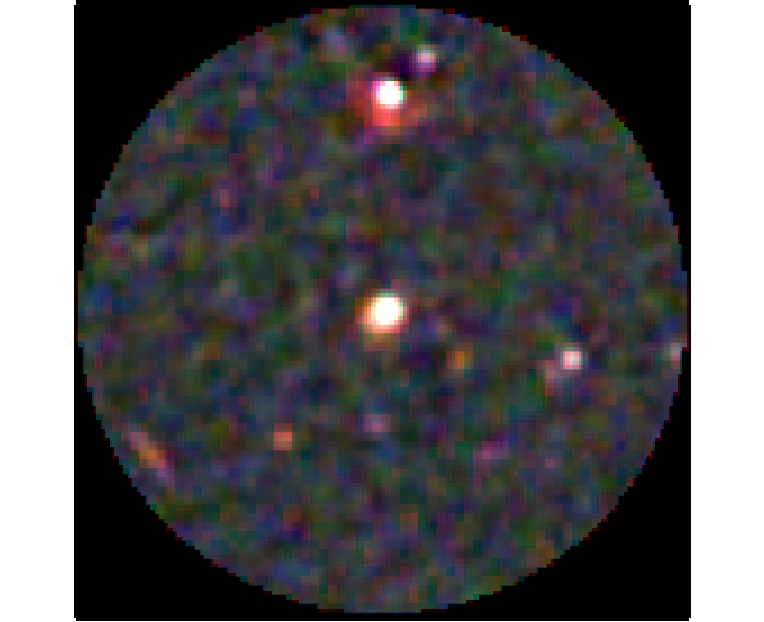
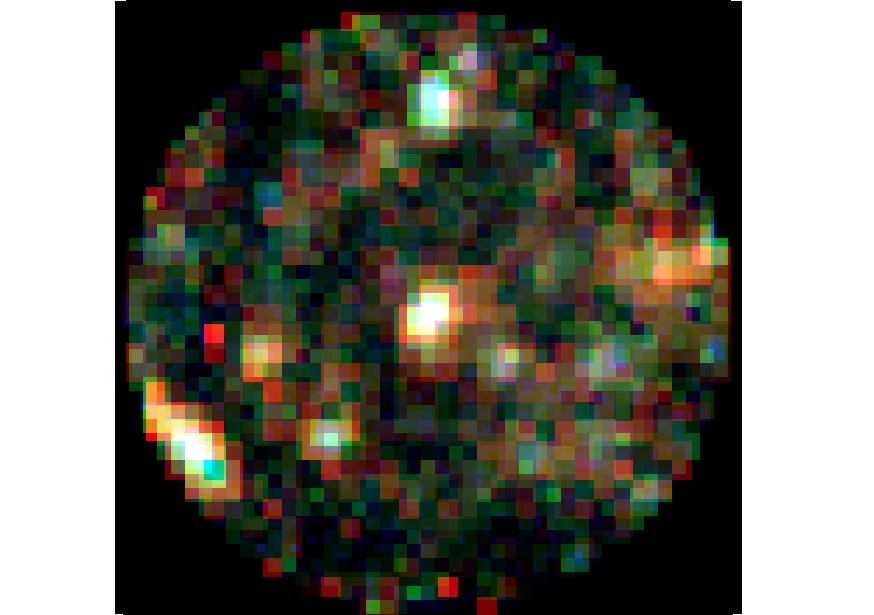
The dust emission from NGC 4696 has been detected in all six PACS and SPIRE bands. In Fig. 3, we show the PACS images at 70 m, 100 m and 160 m and the SPIRE images at 250 m, 350 m and 500 m centered on NGC 4696. The PACS photometry data reduction pipeline described in Sect. 2.2 produces images with units Jy pixel-1. We converted the units from Jy pixel-1 to Jy beam-1 by using the conversion factor pixel beam-1, where is , and and is , and for the 70 m, 100 m and 160 m bands, respectively.
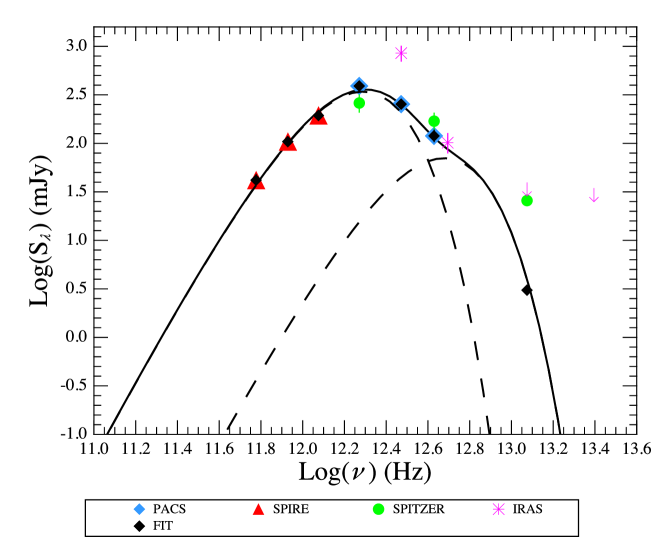
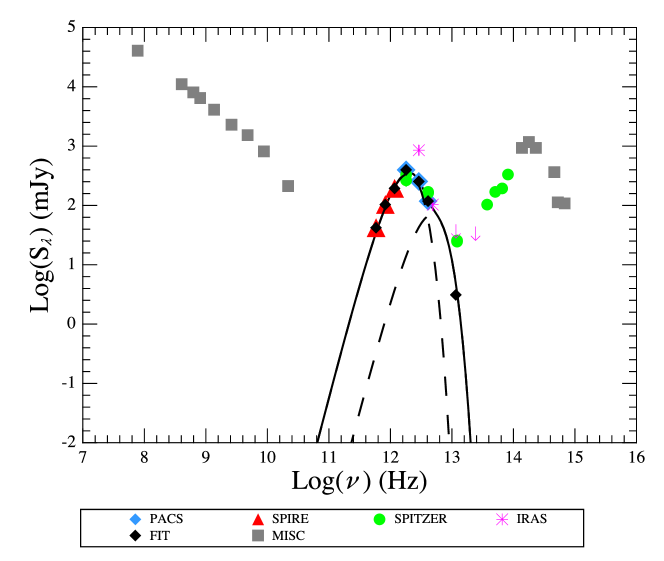
The BCG emission seems to be slightly extended along the northwest-southeast direction. The origin of the infrared continuum emission is the interstellar dust grains in the host galaxy, which are heated by the absorption of photons from an ionizing source. Whether this ionizing source is starbursts (SB) or an AGN embedded in the host galaxy is usually a matter of debate but the AGN/SB diagnostics for NGC 4696 suggest the AGN contribution to be very low (Sect. 4.1). We fitted the dust spectral energy distribution (SED) with a blackbody spectrum modified by a frequency-dependent emissivity. Following Aravena et al. (2008), and references therein, the flux-density at a given frequency, , is :
| (1) |
where is the Planck function at frequency , and temperature . is the contribution from the cosmic microwave background at K. is the solid angle subtended by the source, , where is the source size in radians (here assumed to be the resolution of the PACS photometer at 70 m). The last term in parenthesis is the modification to the blackbody radiation spectrum, where is the dust optical depth,
| (2) |
Here, m2 kg-1 (Dunne et al., 2000) is the dust absorption coefficient and is the dust emissivity index which we fixed to 2 .
Motivated by the findings of Dunne & Eales (2001), we fitted the infrared data with two modified blackbody functions, representing a cold dust component and a warm dust component. This gives four model parameters: the temperature and mass of the cold dust component, , , and the temperature and mass of the warm dust component, , . We used the Levenberg-Marquardt minimization routine from Numerical Recipes to obtain the best fit model parameters. We conducted the fit using seven data points: the six PACS and SPIRE photometer data and the Spitzer MIPS data at 24 m. The Spitzer MIPS flux density at 24 m receives a contribution from the hot dust component as well as the passive stellar population. In order to use the 24 m data for the SED fitting, it is necessary to subtract the contribution from the passive stellar population. For this we fitted a powerlaw to the IRAC data, since the IRAC wavelengths are sensitive to emission from the old stellar population, and extrapolated the fit to 24 m. The net flux-density after subtracting the contribution from the passive stellar population is mJy, which is significantly lower than the total observed value. It is this net flux-density that we assigned to the hot dust component for the SED fitting.
The SED fitting yields a massive cold dust component with K and and a low-mass warmer dust component with K and . As also seen in other studies, the cold component dominates the mass budget. The far-infrared and the total SEDs, the latter extending from radio to X-ray frequencies, are shown in Fig. 4. We used the fit parameters to estimate the total far-infrared luminosity of the dust between 8 m and 1000 m, , and found it to be (7.51.6). For the analysis of the photodissociation regions described in Sect. 5, we used the FIR luminosity in the range 40 m to 500 m, which from here on is denoted by and is equal to (6.20.8).
To assess the robustness of the derived parameters and the quantities derived from them, such as the FIR luminosity, we also fitted the above model using the average of the two MIPS and one PACS flux estimates at each 70 m and 160 m. The fit results lead to a cold dust component with K and and a warm dust component with K and . The inferred FIR luminosities are and . Hence, a 20% variation in the PACS flux densities results in about a 5% to 10% variation in the total cold dust mass and the FIR luminosities. This is well within the formal errorbars obtained from either of the two fitting methods.
3.4 Gas-to-Dust Mass Ratio
O’Dea et al. (1994) searched for CO in a sample of five radio galaxies, including NGC 4696, using the Swedish-ESO submillimeter telescope. They reported nondetection in NGC 4696 and used the result to put limits on the gas mass. From these observations, the 3 upper limit on the mass in the molecular gas is estimated to be . Using the dust mass calculated in Sect. 3.3, the (molecular) gas-to-dust mass ratio has an upper limit of . Note that the upper limit on the total gas-to-dust mass ratio is likely larger since the total-to-molecular gas mass ratio is greater than unity and may be as high as 5 (or more) depending upon parameters such as the ionization radiation intensity and the total hydrogen column density.
We also used the formalism laid out by Wolfire et al. (1990), which uses the observed [Cii] emission to obtain the atomic gas mass, assuming that the [Cii] emission is optically thin:
where is the luminosity distance, is the [Cii] line flux, (Cii) is the cooling rate of ionized carbon and (Cii) is the abundance of ionized carbon relative to hydrogen. Most of the [Cii] emission originates from the surface layers of the photodissociation regions with the visual extinction, , depleting steadily with increasing , and is the dominant of the three most important carbon-bearing species, C, Cii and CO (Hollenbach et al., 1991). Hence the Cii abundance can be equated to the elemental abundance of carbon, which, for the simulations of the photodissociation regions described in Sect. 5, equals 2.5 times the interstellar value, (Cii) = . For gas temperatures higher than 100 Kelvin (the excitation temperature of Cii is 92 K) and gas densities between 100 cm-3 and 1000 cm-3, is in the range (10-21 – 10-22) . Substituting these values into Eqn. 3.4 gives a gas mass in the range (0.5 to 5) . This is consistent with the upper limit derived from the non-detection of CO by O’Dea et al. (1994).
The gas-to-dust mass ratio based on the above estimate of the gas mass is between 1 and 70. In comparison with the gas-to-dust mass ratios derived for other BCGs (Edge, 2001; Edge et al., 2010a), which have typical values of a few hundred, the ratio in NGC 4696 is significantly lower. Note that the above method of determining the gas mass is not very robust for low and , which is the case of NGC 4696 (see Sect. 5), and the dust mass is very sensitive to the assumed dust temperature, so the derived range of the gas-to-dust mass ratio should only be treated as a crude estimate.
3.5 Star Formation Rates
Assuming the dust heating to be due to the young stellar population and high dust opacity in the star forming regions, the Kennicutt relation (Kennicutt, 1998) can be used to convert the (derived in Sect. 3.3) into a star formation rate (SFR). Using the conversion, (erg s-1), and the derived , we obtained a star formation rate of . However, we expect a non-negligible contribution also from the general stellar radiation field, including the old stellar population in the host galaxy, which will lower the estimated SFR. Hence, the above value is an upper limit.
We also retrieved far ultraviolet (FUV) data from the HST archive. The data (proposal ID 11681) were taken with the Advanced Camera of Surveys Solar Blind Channel (ACS/SBC) providing a field of view of . These observations were made with two long-pass filters, F150LP and F165LP, and we chose the F150LP filter over F165LP to estimate the star formation rate (described below) due to its higher system throughput.
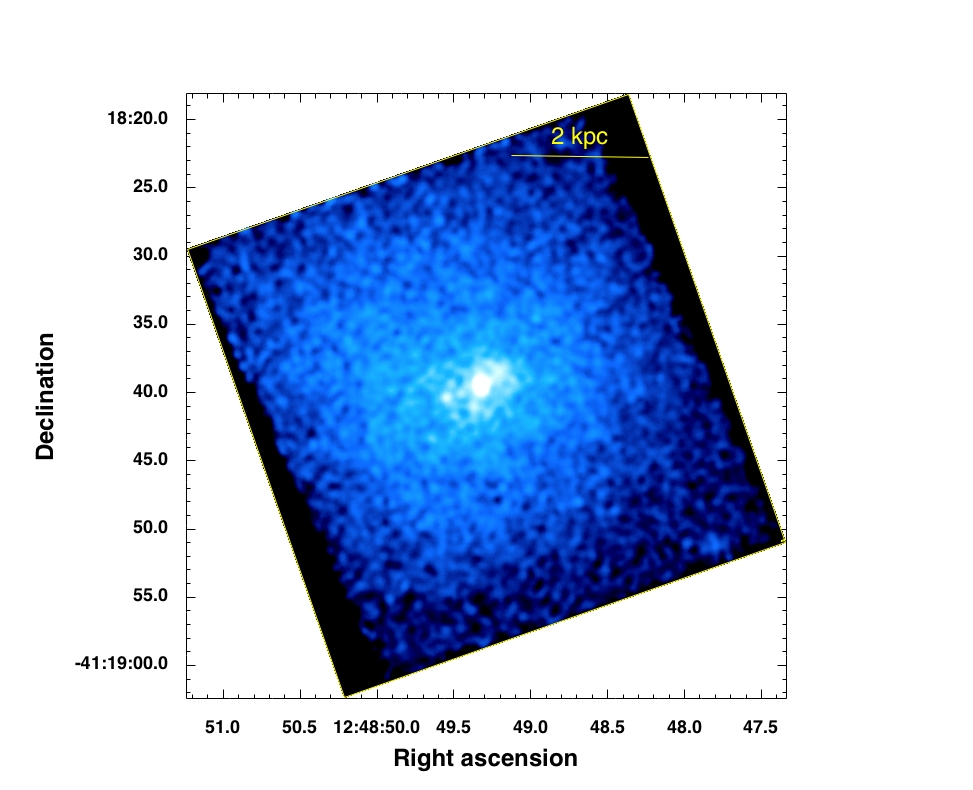
We used a Starburst99 stellar library (Leitherer et al., 1999) to model a spectrum of a young stellar population (whose oldest stars are yr old) with a continuous star formation rate of . We fed the output spectrum into the synphot synthetic photometry package to determine the expected flux in the F150LP band. The ratio of the extinction-corrected observed flux to the expected flux from synphot multiplied by the assumed SFR in Starburst99 gives a measure of the actual star formation rate. The FUV emission in the F150LP band, shown in Fig. 5, contains a bright core surrounded by low brightness emission. The low surface-brightness extended emission is most probably dominated by the passive stellar population. Hence, we derived an upper limit to the SFR based on the assumption that the entire observed FUV emission arises due to a young stellar population and a lower limit based on the assumption that only the bright core is associated with an ongoing star formation. The measured flux using aperture photometry is ergs s-1 cm if a region of radius kpc in considered, which encompasses the bright core as well as the diffuse emission surrounding it, and ergs s-1 cm if only the bright core of radius kpc is considered. These values were corrected for Galactic extinction based on the measured from NED and the extinction law, (Cardelli et al., 1989). The extinction was calculated using the mean dependent extinction law from Cardelli et al. (1989) in the UV and FUV regime at the pivot wavelength, . The extinction corrected fluxes are ergs s-1 cm and ergs s-1 cm. Note that there is likely to be internal extinction within NGC 4696 and the SFR limits derived below may increase once this additional extinction is taken into account. Comparing the expected flux from the Starburst99 model to the observed corrected flux gives an upper limit of the FUV derived star formation rate of and a lower limit of . The upper value is in agreement with the upper limit derived from the far-infrared analysis. This is also consistent with the GALEX near-ultraviolet (NUV) observations indicative of a SFR consistent with zero and a 3 upper limit of 0.17 . The GALEX analysis takes into account the UV-upturn from an evolved stellar population. The UV excess is calculated by comparing the GALEX NUV emission to the 2MASS444http://irsa.ipac.caltech.edu/Missions/2mass.html -band emission within an aperture of and attributed to the ongoing star formation.
The classical X-ray mass deposition rate at a radius of about from the X-ray peak in the Centaurus galaxy cluster (the projected separation between the X-ray peak and the BCG is , Mittal et al., 2009) is about (5 to 9) (e.g. Sanders & Fabian, 2008; Hudson et al., 2010). The cooling rates observed in the form of star formation rate derived from FIR and UV are smaller by about two orders of magnitude. Similarly, Sanders & Fabian (2008) used XMM-Newton RGS observations to study the X- ray emission from the core of the Centaurus galaxy cluster. They carried out detailed spectral fitting to measure the amount of gas cooling at the center and deduced an upper limit of below 0.4 keV. This is the standard “cooling-flow” discrepancy, which is resolved when we consider the AGN regulated feedback. The luminosity of the gas cooling in the center can be estimated using a cooling flow model in which the gas cools from the virial temperature to a minimum possible lower temperature (0.08 keV). The cooling luminosity is given by:
| (4) |
where is the classical mass deposition rate inferred from X-ray observations, is the mass of the proton, is the mean molecular weight () and is the cluster virial temperature which for Centaurus is about 4 keV. Inserting the estimated and gives a cooling luminosity in the range (4.5 to 8.0) 1042 erg s-1. On the heating front, Rafferty et al. (2006) found the mechanical power associated with the AGN-excavated cavities to be 7.4 erg s-1. Merloni & Heinz (2007) estimated a similar value for the mechanical power erg s-1. Hence there is enough energy in the radio source to balance cooling of the hot gas and maintain equilibrium.
4 Analysis
4.1 AGN contamination
The interstellar dust is believed to be heated by two principle mechanisms, by young stars and AGN. Hence it may be that some of the infrared emission detected is related to the AGN activity. In order to gauge the AGN contribution, diagnostics such as those used by O’Dea et al. (2008); Quillen et al. (2008), such as the Spitzer IRAC 4.5m/3.6m colour and , may be used to discriminate between the presence of an AGN and star formation.
We compiled the optical line emission ratio, , for NGC 4696 available from Lewis et al. (2003) () and Farage et al. (2010) (). The two estimates are not necessarily contradictory since these are calculated over different apertures. Neither of the ratios indicates a presence of a dominant AGN contribution to the far-infrared emission. In addition to the low , the IRAC 4.5m/3.6m colour ratio () is consistent with a passive stellar population. The absence of the IR [Oiii] 88 m spectral feature is another indication of negligible AGN photoionization (Spinoglio, 2009).
4.2 Gas Kinematics
Observations of NGC 4696 reveal interesting velocity structures and several studies have used data from different wavebands to study them (e.g. Sparks et al., 1989, 1997; de Jong et al., 1990). The most recent independent investigations by Farage et al. (2010) and Canning et al. (2011) [in prep.] use observations of H at sub-arcsecond resolution to map the kinematics of the gas.
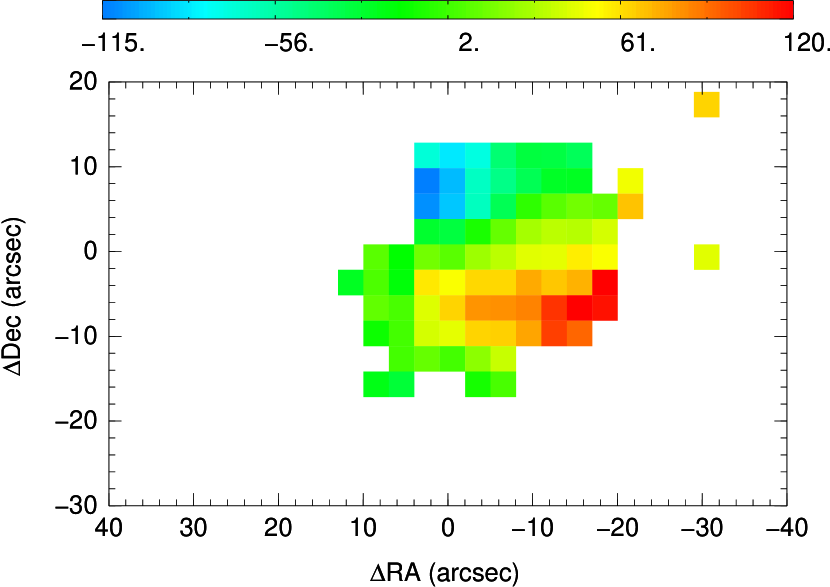
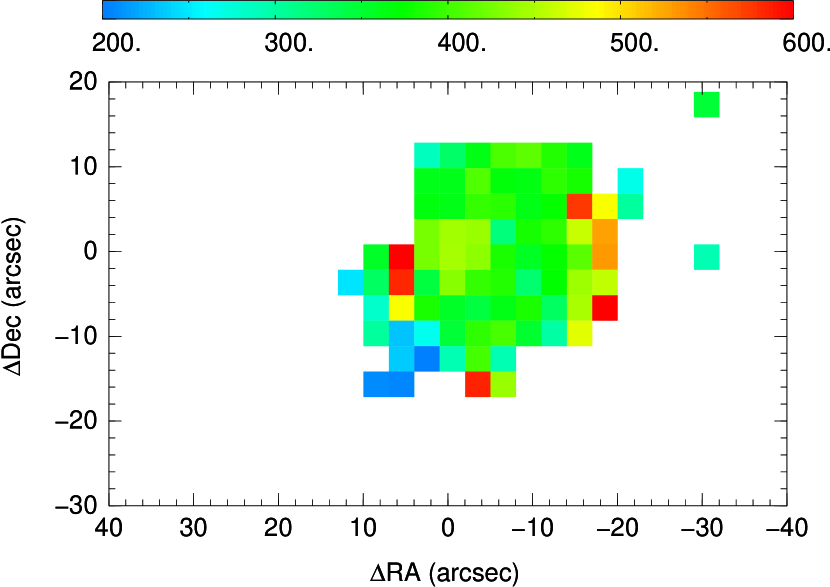
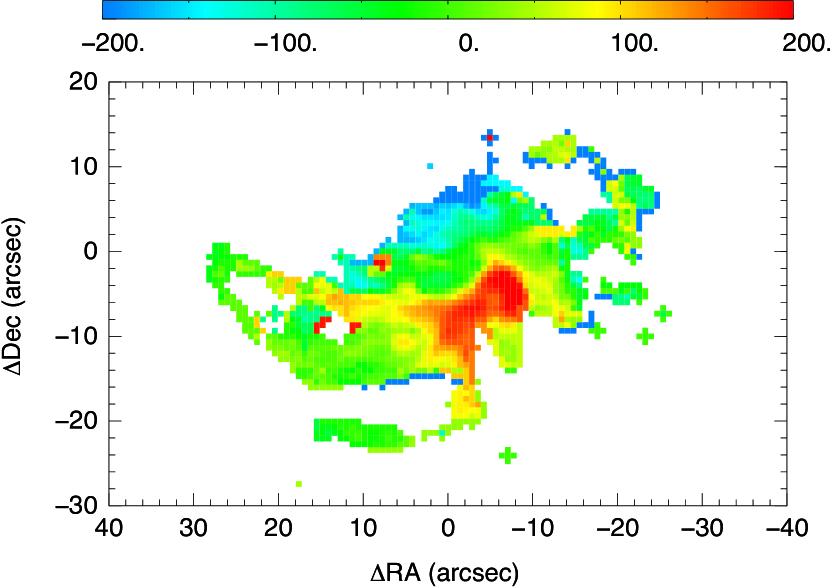
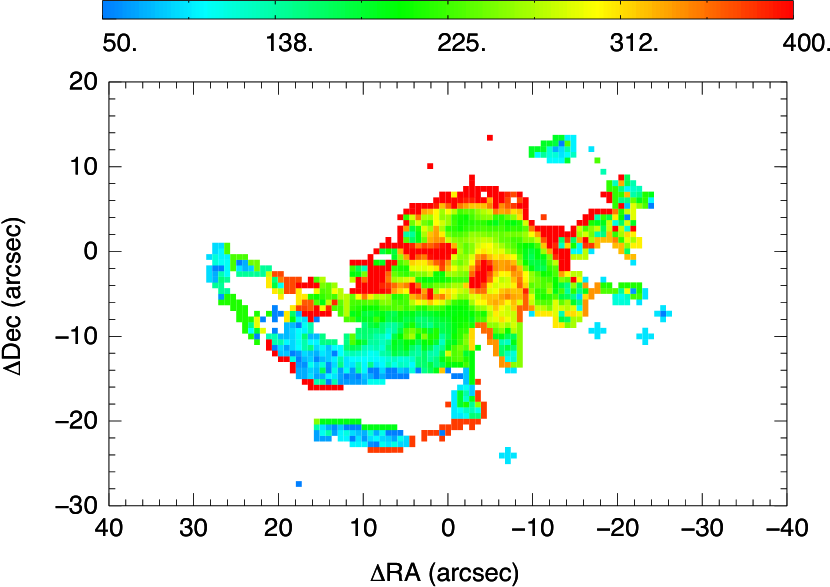
We used the projected map made using ‘specProject’ (Sect. 2.1.2) and obtained a line fit for each individual spaxel separately. The upper panel of Fig. 6 shows the line-of-sight velocity (left) and the line FWHM (right) the [Cii] emission line gas as inferred with Herschel. The X- and Y-axis are the offsets along right ascension and declination relative to the radio core position corresponding to the 5 GHz VLBA (very large baseline array) core maximum (Taylor et al., 2006). These maps have a nominal scale of per spaxel. The lower panel of Fig. 6 shows the line-of-sight velocity (left) and the line FWHM (right) of the H+[Nii] emission (Canning et al., 2011). The H+[Nii] IFU (integral field unit) observations were performed with the VIMOS (VIsible MultiObject Spectrograph) instrument mounted on Melipal, a 8 m telescope at Paranal Observatory.
The line-of-sight velocity of the [Cii] emission varies from km s-1 to km s-1. The gas is blueshifted north of the center (represented by the radio core), and redshifted south of the center. This is consistent with the velocity map derived from H+[Nii] emission which shows a similar range in the gas velocity and shows that there is gas receding in the south and approaching in the north. These results are also in agreement with the velocity maps presented by Farage et al. (2010) using the Wide Field Spectrograph (WiFeS) instrument that operates on the ANU (Australian National University) 2.3 m telescope at Siding Spring Observatory. Fig. 2 shows that the spatial morphology of the [Cii] emission closely follows that of the X-ray and optical spiral filaments. Additionally, the velocity maps show very similar gas kinematics in the infrared and the optical. The velocity and emission maps from [Cii] and H suggest a geometry with gas infalling on a spiral trajectory starting east of the galaxy center. The trajectory loops around the galaxy in an anti-clockwise direction, such that the infalling gas in the south appears to be receding in the rest frame of the galaxy; hence redshifted. The trajectory continues and loops around the galaxy towards the center, such that the gas in the north appears to be approaching in the rest frame of the galaxy; hence blueshifted.
The velocity dispersion of the [Cii] gas ranges from km s-1 to km s-1. This is slightly larger than the velocity dispersion in the H+[Nii] gas from the VLT/VIMOS observations [50 km s-1 to 400 km s-1] and also from the WiFeS observations [60 km s-1 to 525 km s-1]. The larger values for the FIR [Cii] data than the optical H data is very likely due to beam smearing, since the resolution of the Herschel spectral data () is a lot coarser than that of the optical data ( pix for the VLT and pix for WiFeS)
The morphological and kinematical correlation between the far-infrared forbidden line coolant, [Cii], and the optical line filaments is a key result of this work. This correlation has a profound implication, namely that the optical hydrogen recombination line, H (Fabian et al., 1982; Crawford et al., 2005; Farage et al., 2010; Canning et al., 2011), the optical forbidden lines, [Nii] (Dopita et al., 2010; Farage et al., 2010), the soft X-ray filaments (Crawford et al., 2005) and the far-infrared [Cii] line all have the same energy source.
5 Modeling the interstellar medium of NGC 4696
To understand the complete picture giving rise to emission in NGC 4696 at different wavebands ranging from X-ray to radio, we performed a detailed investigation of the physical parameters of the interstellar medium of the BCG.
The close spatial correspondence between the [Cii] maps, along with the NW-SE elongated dust emission, and the optical H maps strongly favours a common heating mechanism for the gas. The excitation source that leads to the optical line-emission and far-infrared coolants remains to be investigated. The Herschel observations presented in this paper shed light on a key ingredient of this developing picture. The positive detection of the most luminous far-infrared coolant of the ISM, [Cii], along with [Oi] and [Nii], dictates the presence of photodissociation regions. In this section we study the source(s) responsible for heating the photodissociation regions (PDRs).
PDRs form a sharp interface with adjoining Hii/Hi and Hii regions. Photons from nearby young stars (O- and B-type) with energies eV ionize the hydrogen in the molecular gas giving rise to an Hii region. This is followed by a PDR where FUV photons with energies eV eV are absorbed by dust grains which re-radiate energy in the form of FIR continuum. About 0.1 % to 1 % of the incident energy of the FUV photons is converted into photoelectrons with energies eV which heat the gas via elastic collisions. With CLOUDY we attempted to model an integrated Hii/PDR cloud, where the output emission originating from the cloud also contains contribution from layers beneath the PDR surface.
5.1 Setting up the CLOUDY simulations
| Quantity | Value (erg s-1 cm-2) | F()/ |
|---|---|---|
| [Cii]c 157 m | 174.73.1 | 1 |
| (1.1050.119) | 63.3 | |
| [Oi]c 63 m | 57.6 | 0.33 |
| [Nii]c 122 m | 24.9 | 0.13 |
| Hb | 79.0 | 0.45 |
| [Sii]c | ||
| [Oiii]c | ||
| [Oib]c | ||
| a Integrated FIR flux in the range (40–500) m | ||
| b Extinction corrected H from Farage et al. (2010) | ||
| c This work. [Sii], [Oiii] and [Oib] are non-detections. | ||
A detailed modeling of the various observed continuum and line emission in NGC 4696 was conducted using the spectral synthesis code for modeling the photodissociation regions, CLOUDY (version 08.00 described by Ferland et al., 1998). CLOUDY models the clouds based on conservation of energy through balancing the cooling and heating rates. The simulations are self-consistent and include chemistry, radiative-transfer and thermal balance. The basic ingredients of each simulation comprised an old stellar population (OSP) and a young stellar population (YSP), wherein the Starburst99 synthetic library (Leitherer et al., 1999; Vázquez & Leitherer, 2005) was used to model the spectra of both the stellar populations. In addition, a background radiation was included comprising the UVX cosmic background from radio to X-ray (e.g. Ikeuchi & Ostriker, 1986; Vedel et al., 1994), which also included the cosmic microwave background radiation.
For the YSP, we used the same spectrum as used to derive the FUV star formation rate in Sect. 3.5, where the oldest stellar age was set to yr and the star formation rate was considered to be continuous and equal to . For the OSP, the oldest stellar age was set to Gyr and the mass was fixed to . Among the specified model parameters were the normalizations for the OSP, , and the YSP, , in units of the Habing (1968) field, where one Habing is the interstellar radiation field of erg s-1 cm-2 in the energy range 6 eV and 13.6 eV. Another parameter was the total hydrogen density (atomic, molecular, ionized and other hydrogen-bearing molecules) in units of cm-3.
| Parameter | Symbol | Input Range | Likely Values |
|---|---|---|---|
| Total Hydrogen Density (cm-3) | 10 to 106 | 50 to 100 | |
| FUV Intensity Field (Habing∗) | 1 to 106 | 10 to 80 | |
| Extra Heating (erg s-1 cm-3) | to | ||
| Normalization for the OSP∗ (10-16 erg s-1 cm-2 Hz-1) | 2.4 to 156.7 | 2.4 | |
| Hydrogen Column Density (cm-2) | NH | 1019 to 1023 | 1021 |
| Metallicity | 1 4 | 2.5 | |
| Nitrogen abundance (relative to ) | (N) | 2 2.5 | 2 |
| a 1 Habing erg s-1 cm-2, OSP: Old Stellar Population | |||
This study and several other studies of NGC 4696 provide observational constraints, which may be exploited to constrain the physical properties of the ISM of the galaxy. The data explicitly used to determine the most likely scenario are listed in Table 4. The errorbars on [Cii]/ were estimated based on the minimum and maximum of the possible values derived from calculated with the 6 Herschel + MIPS 24 m data points and calculated with the averaged data points in case of duplicate measurements (see Sect. 3.3). The lower errorbar on [Oi]/[Cii] was derived by integrating the flux over all the spaxels with a SNR for the [Cii] line and a SNR for the [Oi] line (because of the lower instrument sensitivity at the wavelength of the [Oi] line emission and a generally weaker emission relative to [Cii]). The upper errorbar on [Oi]/[Cii] was derived by assigning the spaxels with no [Oi] detection but a positive [Cii] detection a bare minimum flux equal to the sensitivity of the PACS spectrometer in the third order times the chosen SNR, and likewise for the [Cii] line. The errorbars on [Nii]/[Cii] and H/[Cii] reflect the statistical uncertainties in the measurements.
In addition, Kaneda et al. (2005) found the IRS (Spitzer Infrared Spectrograph) spectrum of NGC 4696 to show only one significant polycyclic aromatic hydrocarbon (PAH) feature at 12.7 m with a flux estimate of erg s-1 cm-2. PAH features are very prominent in the vicinity of young massive stars and so are considered as good tracers of star-forming sites. Absence of any strong PAH features is in concert with the fact that both the FIR- and FUV-derived star formation rates are low. Also, even though the dust-to-gas ratio in NGC 4696 is higher than the nominal range (Sect. 3.4), PAHs owing to their small size are susceptible to grain destruction via physical sputtering or thermal evaporation (Dwek & Arendt, 1992). While PAHs have an important effect on the chemistry of PDRs Bakes & Tielens (1998), due to the lack of any strong PAH features in the IRS spectrum we did not consider PAH grains in our simulations.
The geometry was chosen to be plane-parallel by making the inner radius much larger than the thickness of the cloud. The incident radiation from the different stellar populations was input in units of flux (erg s-1 cm-2). The simulated output fluxes were determined relative to the [Cii] flux and compared to the observations. As a check on the absolute flux levels, we determined the luminosity of the simulated [Cii] 157.74 m line by multiplying the flux with the surface area of the emitting cloud and scaling it to the distance of the Earth. Although the radius of the cloud can be judged from the size of the sphere encompassing the [Cii] emission shown in Fig. 6 as (kpc) (also see Sect.3.1), the [Cii] flux is not expected to fill up this whole sphere. The volume filling factor can be determined by equating the simulated and observed fluxes. Note that the PDR model thus constructed is oversimplified in that a single uniform PDR cloud has been assumed. In reality, one expects a distribution of PDR clouds with different and inhomogeneous incident and emergent radiations. However, as shown below, a simple model such as described here is sufficient to study some of the basic physical properties of the ISM in NGC 4696.
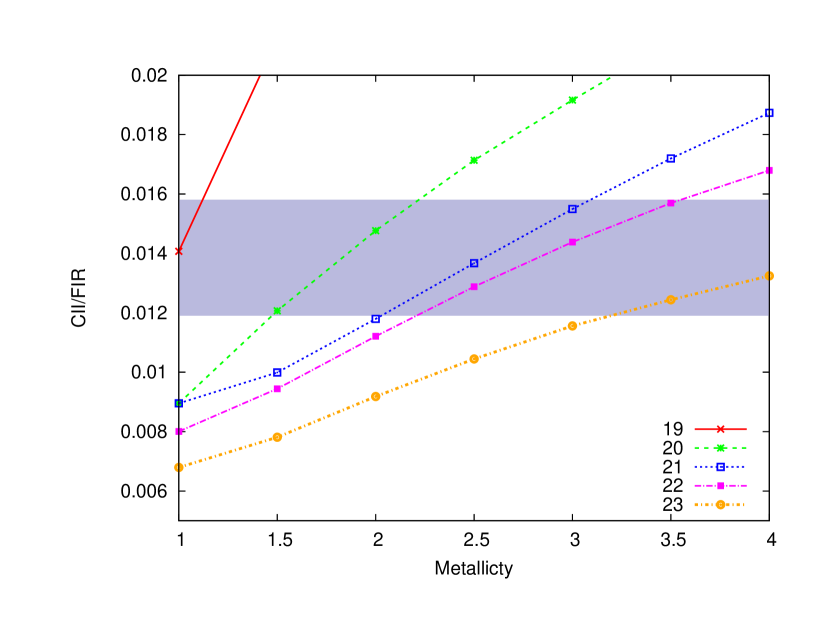
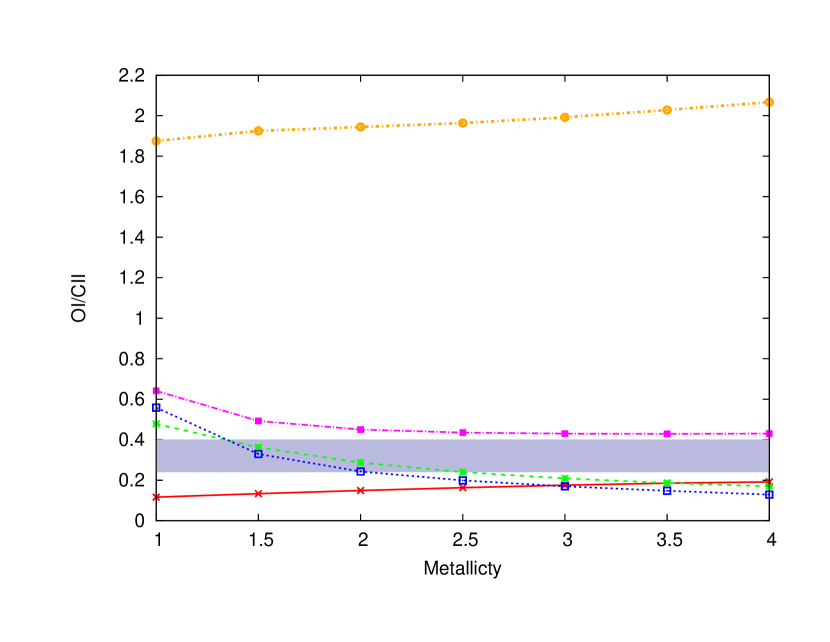
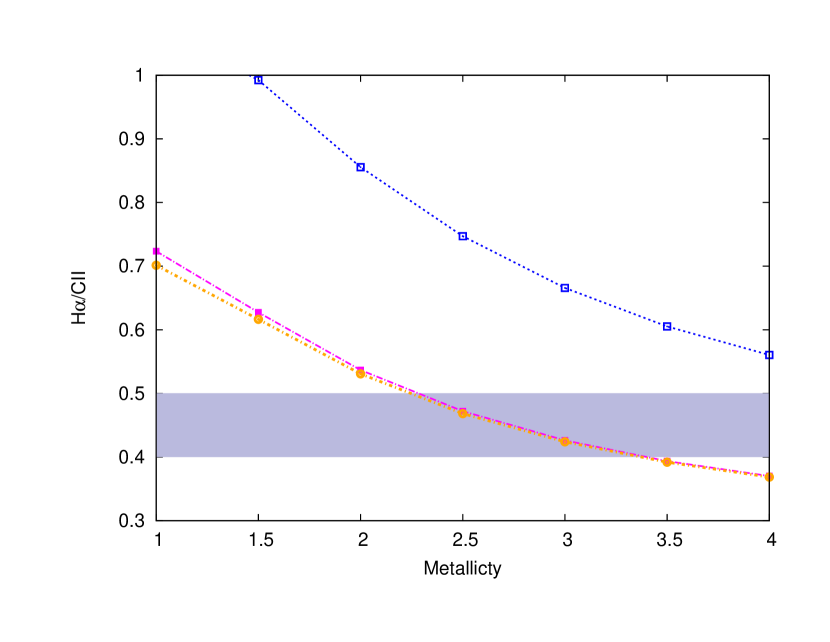
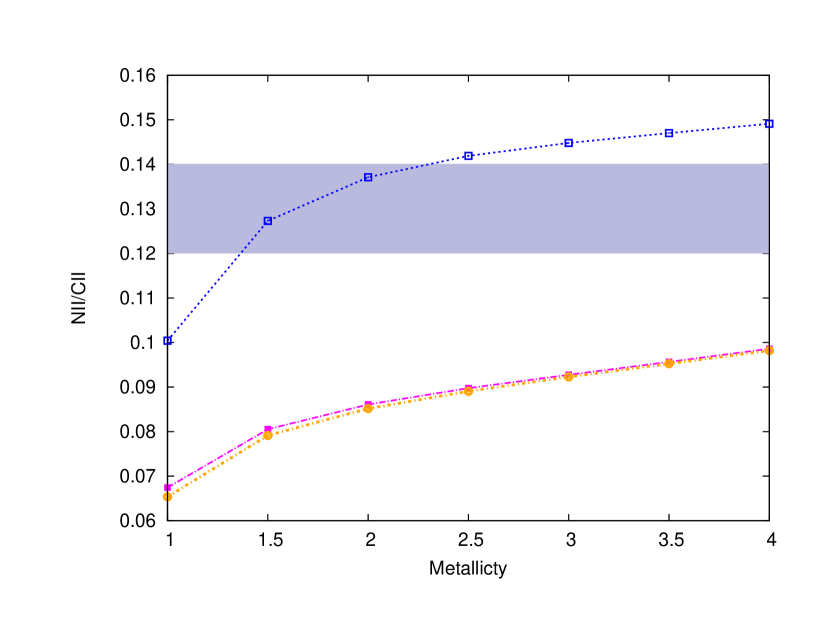
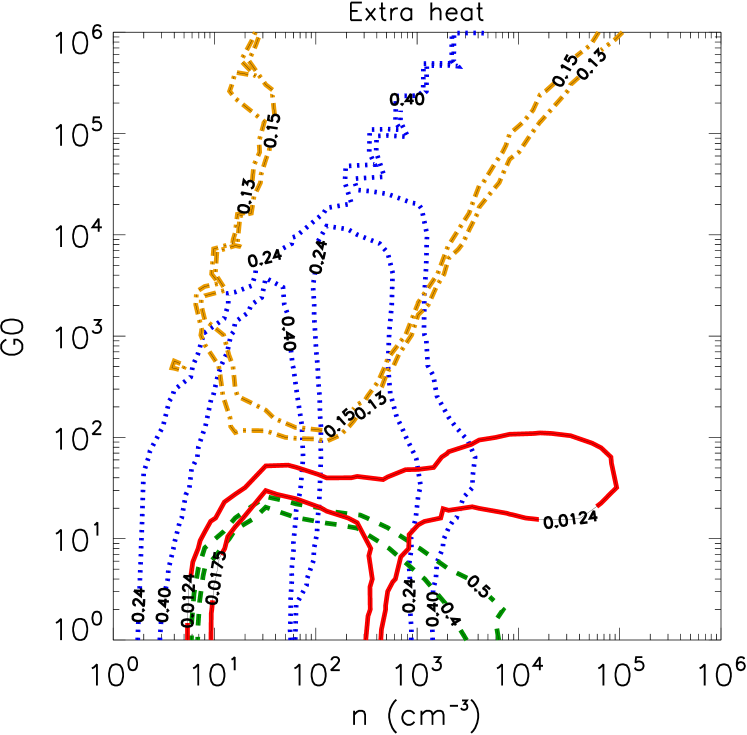
X-ray observations of the Centaurus cluster show supersolar abundances in the inner 25 kpc, where the metallicity is (Graham et al., 2006). Hence we increased the elemental abundances, , to two to three times the default ISM values. Furthermore, owing to a small gas-to-dust mass ratio derived in Sect. 3.4, we increased the dust abundance to 1.2 times the default ISM value leading to a commensurate decrease in the gas-to-dust mass ratio from to . Another important parameter is the penetration depth of the incident radiation into the PDR cloud. The outer radius of the cloud was specified in terms of the total hydrogen column density, NH, at the edge of the cloud (the PDR surface). While the observed ratio of [Nii] to [Cii] demands relatively low NH, the observed ratio of H to [Cii] demands high NH. We investigated a range of NH and for the most likely values to explain the observed ratios. The dependency of the ratios on NH and is shown in Fig. 7. Based on the results of this investigation, we fixed to 2.5 and NH to cm-2. The various model parameters and their input values can be found in Table 5.
5.2 Photoionization by stars
The aim of conducting these simulations was to understand the key physical ingredients behind the extended [Cii] and H filaments. Is a young stellar population important? Can the old and young stellar populations alone reproduce the observed ratios listed in Table 4? Do the observational constraints require an additional source of heating? In the AGN-heating regulated feedback framework, the AGN outflows return a fraction of the accreted energy back to the intracluster gas. The radio source can heat the gas either via energetic cosmic ray particles or inflating cavities. The other scenario entailing additional heating revolves around merger-induced shocks in the ISM of the BCG (see Sect. 6).
The young stellar population is important in terms of providing FUV photons capable of ionizing carbon to produce the observed [Cii] emission. Without any young stars, the [Cii]/ ratio can not be reproduced. This is shown in Fig. 8, where different curves represent different values of . The old stellar population produces optical and UV photons which heat up the dust but does not affect the gas much. Hence increasing has an effect of increasing but not the intensity of the gas line emissions, which decreases the [Cii]/ ratio. Though elementary, this simple exercise underlines the importance of having both the stellar populations. Furthermore, the observed [Cii] to ratio ranges from 0.1 % in normal and starburst galaxies to 1 % in dwarf irregular galaxies (Kaufman et al., 1999; Luhman et al., 2003). Edge et al. (2010b, a) studied the [Cii]/ ratio in two cool-core BCGs and found it to be equal to for Abell 1068 and for Abell 2597. In comparison, the observed ratio for NGC 4696 is %. Thus the ratio is higher than normal and requires minimum amount of dust heating. While such a large ratio may be reconciled with the PDRs in low-metallicity galaxies with low dust-to-gas mass ratios, NGC 4696 has a very high dust-to-gas mass ratio. In order to reproduce the observed [Cii] to ratio, we fixed the to have a bare minimum value of erg s-1 cm-2 Hz-1. A lower value of does not produce any discernible effects on the output ratios.
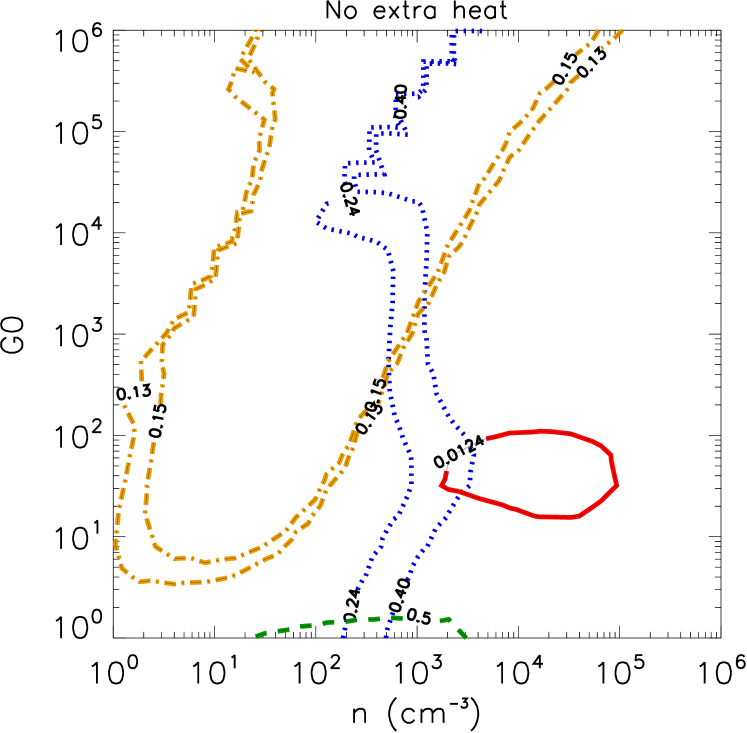
Following this, we did simulations based on a model containing both the old and young stellar populations, and probed and space ranging from (10 to ) cm-3 and (10 to ) Habing. The left panel of Fig. 9 shows the contours of the simulated ratios [Oi]/[Cii] and [Cii]/ corresponding to the lower and upper limit given in Table 4 (where reproducible). We find that the [Cii]/ ratio (dotted blue line) saturates at an upper limit of about 0.014, where as the observed ratio is 0.0147. Also, with this model the H/[Cii] ratio is greater than 1 for all values of and , where as the observed ratio is close to 0.45. Since neither the observed [Cii]/ nor the H/[Cii] can be reproduced, we conclude the model containing only old and young stellar populations as the source of heating the PDRs is insufficient to explain the observations of NGC 4696.
5.3 Extra heating
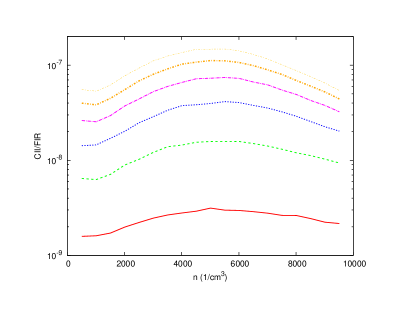
The gas in PDRs is mostly heated via the dust through photoelectric heating. In order to boost the [Cii] flux independent of the FIR dust emission, a source of heating is required that may directly input energy to the gas. Thus we included an extra heating term in CLOUDY using the parameter “hextra”, which specifies a volume-heating rate (erg s-1 cm-3). The source of this extra heating is unspecified and so may be attributed to either shock heating or cosmic ray heating due to the radio source. We investigated models containing the OSP and YSP and additional heating ranging from erg s-1 cm-3 to erg s-1 cm-3. The term “hextra” acts to raise the temperature of both the gas and the dust independent of each other. The standard behaviour of [Cii] is such that for a given the [Cii] intensity increases linearly up to the critical density ( cm-3 for the [Cii] forbidden line) beyond which collisional de-excitation occurs as often as radiation. Hence the line intensity above the critical density is not very sensitive to the density and increases with it only very slowly. The extra heating acts to boost the [Cii] intensity at low densities all the way up to cm-3 after which it decreases due to overly suppressed radiative de-excitation. The extra heating also increases the dust emission; however the increase is roughly independent of the density. The over all effect of the heating term on the [Cii]/ ratio is such that the ratio increases for low densities, where the increase in [Cii] is larger than the increase in .
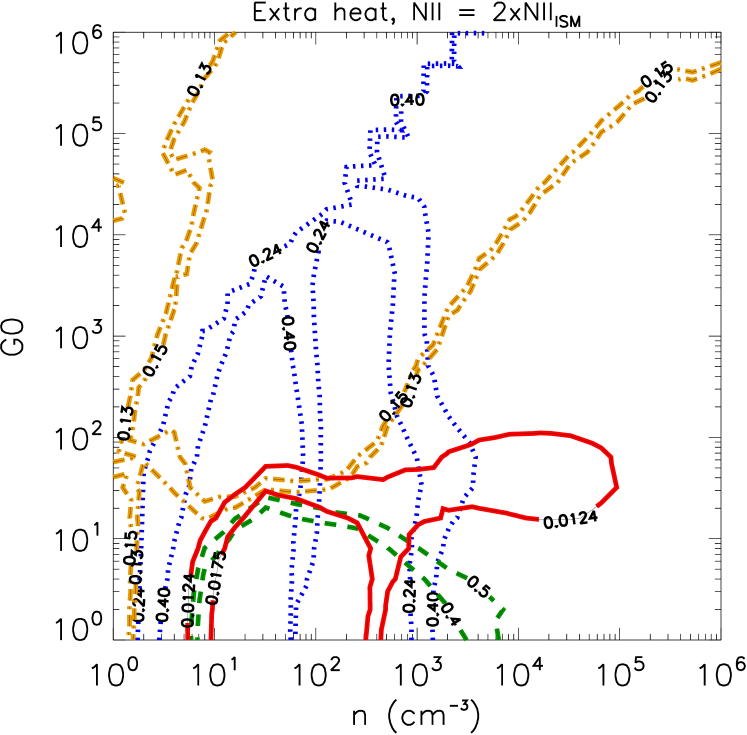
The middle panel of Fig. 9 shows the contours of [Cii]/ (solid red), [Oi]/[Cii] (dotted blue) and H/[Cii] (dashed green) for erg s-1 cm-3. Of the different levels of investigated, this was the optimal value leading to most coherent results. For example, erg s-1 cm-3 fails to reproduce the observed [Oi]/[Cii] ratio and erg s-1 cm-3 just barely touches the observed [Cii]/ ratio. We found that while could reproduce the right levels of [Cii]/, H/[Cii] and [Oi]/[Cii], the [Nii]/[Cii] ratio was too low compared to the observations. The FIR [Nii] line emission (the first ionization potential of nitrogen is 14.5 eV) arises from warm ionized medium only, where as [Cii] emission can arise from both neutral (PDRs) and ionized media. The fraction of [Cii] emission arising from ionized media is highly uncertain, ranging from 25 % up to more than 50 % (e.g. Heiles, 1994; Oberst et al., 2006; Aannestad & Emery, 2003). However, since our model includes a PDR adjacent to an Hii region, the total [Cii] emission includes contributions from both, neutral as well as ionized media, and no correction factor is needed to estimate the fraction of [Cii] emission arising from the PDR alone. The right panel of Fig. 9 corresponds to the same setting as for the middle panel, only the nitrogen abundance, (N), has been increased by a factor of two over the ISM value. The contours corresponding to the [Nii]/[Cii] ratio (dotted-dashed mustard) now overlap with the contours of the [Cii]/, [Oi]/[Cii] and H/[Cii] ratios. A nitrogen overabundance from the PDR analysis is consistent with the enhancement in nitrogen abundance required based on the optical line ratios (Farage et al., 2010) and X-ray spectral fitting (Sanders et al., 2008). The fact that the analyses of the NGC 4696 observations in X-ray, optical and far infrared wavebands, all require a nitrogen overabundance and by roughly the same factor is reassuring and lends support to the above PDR model.
The emanating [Cii] flux from the cloud is about erg s-1 cm2. The size of the cloud that results in the observed [Cii] flux is such that, , where is the observed [Cii] line flux and is the modelled [Cii] line flux, is the “effective radius” of the cloud and is the luminosity distance to NGC 4696. The radius of the cloud thus calculated is kpc. Considering that the [Cii] flux extends over a kpc large region implies a volume filling factor of .
These PDR simulations help us to narrow down the most probable heating scenario such that it simultaneously reproduces all the observed line and continuum ratios. The most likely parameter values are given in the last column of Table 5. The right panel of Fig. 9 is based on a model that contains photoionization from old and young stellar populations, and an additional source of heating. Note that photoionization from young stars is still of paramount importance. A model containing only extra heating and no young stars produces very little [Cii] because of severe lack on FUV photons. The model containing stars and “extra-heating” best explains the observations yielding a density, , in the range of about a few tens to hundred per cm3 and a radiation field, , in the range ten Habing to Habing. This range of corresponds to a star formation rate of (0.02 to 0.13) for a cloud of an effective radius of kpc. The SFR thus estimated agrees very well with the limits derived from the FIR and NUV/FUV observations (Sect. 3.5).
6 Discussion
The Centaurus cluster of galaxies can be classified as a strong cool-core cluster based on its short gas cooling time (Gyr) and a peaked X-ray surface brightness profile. The mass condensation rate derived from the far-infrared and UV observations is small () as compared to that predicted based on the cooling-flow model (). The X-ray core luminosity at 2.5 % corresponding to a region of radius 30 kpc is about erg s-1 (Sanders et al., 2008). This is the amount of power (radiative losses) that needs to be fed back to the ICM over that scale for the system to remain in equilibrium. One of the potential feedback mechanisms is through the expanding radio plasma that has dug out multiple cavities in the intracluster medium of NGC 4696 at radii kpc. The power in these radio bubbles assuming a buoyancy timescale is estimated to be about erg s-1 (Rafferty et al., 2006). Repetitive inflation of such radio bubbles also creates sound waves which generate a sound-wave power of about erg s-1 (Sanders et al., 2008). These two mechanisms together suffice to balance the X-ray radiative losses and can keep the central region of Abell 3526 in quasi-equilibrium.
The optical and far-infrared line emissions clearly show an infalling gas flow of spiral pattern. There are two possibilities for the origin of the gas and dust. The first possibility is that this material represents the cooling intracluster medium flowing toward the center of the dark matter potential well (which in the case of Centaurus coincides with the BCG). The fact that the soft X-ray emission (0.5-1) keV traces the spiral structure seen in H and [Cii] does indeed suggest a link to the gas cooling out of the ICM. The relative increase in the X-ray surface brightness along the filaments is a natural outcome of this scenario. Fabian et al. (2011) examined the Chandra X-ray emission from the Northern filament in the Perseus cluster and provided another outlook on the excitation mechanism of the filaments. Their results indicate that some of the soft X-ray emission may be due to charge exchange as the hot ionized gas penetrates and mixes with cold gas. Although the cooling flow model does not dictate a coherent directional gas flow to the center, such as that seen in NGC 4696, the spiral morphology may be a natural consequence of the global velocity field of the gas surrounding in NGC 4696. This may be the first direct mapping of a cooling flow in a galaxy cluster.
The second possibility is that the filaments and the dust lane in NGC 4696 have a galaxy infall origin. This is based on a merger hypothesis proposed by Sparks et al. (1989) and more recently by Farage et al. (2010). Under this hypothesis, the BCG is undergoing a minor merger with an infalling neighbouring dust-rich galaxy. The presence of two nuclei in HST imaging of the center of NGC 4696 (Laine et al., 2003) lends some support to the merger hypothesis, although the nature of the second nucleus is not well established. A merger hypothesis also explains the prominent dust lane seen with the HST. While Sparks et al. (1989) favour heat transfer via conduction from the hot X-ray emitting ICM to the cool dust-rich infalling gas, Farage et al. (2010) favour shock heating generated through the dissipation of the orbital energy of the infalling cloud. Assuming a shock luminosity of erg s-1 (Farage et al., 2010), the shock volume luminosity over a region of radius 0.5 kpc is erg s-1 cm-3. This is in good agreement with the level of the extra heating input to the simulations above.
Irrespective of the origin of the cold gas and dust, the detailed PDR modeling of the observed quantities arising from this flow (described in Sect. 5) shows photoionization from stars is an important requisite. However, there is an additional source of energy input required to reproduce the observables. This additional source of heating could either represent the energy deposited by the AGN through the methods described above or shock heating due to a minor-merger. The additional heating amounts to of the X-ray core luminosity and could be another contributing factor to the total heating budget.
The non-radiative energy sources, in principle, could be input into the simulations either in the form of extra heating (shock heating or reconnection diffusion, see Fabian et al., 2011, for latter), such as that considered in these CLOUDY simulations, or cosmic rays. Ferland et al. (2008) and Ferland et al. (2009) have shown that while it is difficult to differentiate between the two processes, certain optical lines could help discriminate between the two. The extra heating case in those studies has primarily been associated with magneto-hydrodynamic (MHD) waves such as those observed in the ISM of our galaxy. The dissipation of MHD wave energy can heat the gas; however, the heating simply adds to the thermal energy of the gas so that the velocity distribution remains Maxwellian. On the other hand, the cosmic ray heating by high-energy particles can both heat and ionize the gas. Both the processes heat the gas but the cosmic ray (ionizing-particle) case produces a population of first and second ions by non-thermal collisional ionization. In the extra-heating case these ions only occur when the gas is warm enough for collisional ionization equilibrium to occur. This is the main distinction between the two cases, extra heating and cosmic ray heating.
Ferland et al. (2009) studied the Horseshoe region of the Perseus galaxy cluster and used the infrared and optical line intensities to distinguish between extra heating and cosmic ray heating. They found that both the heating cases match the observations to within a factor of two for the majority of the lines. There are a few discriminant lines, such as the optical emissions [Hei] and [Ne iii] and the infrared emission [Ne ii] m which show a few orders of magnitude difference and indicate that the cosmic ray may be a better agent for heating and ionizing the gas (also see Donahue et al., 2011). The mid-infrared Spitzer IRS spectrum of the off-center regions of NGC 4696, in fact, contains the [Ne ii] m line (Johnstone et al., 2007). This along with the detections of ro-vibrational H2 lines in off-nuclear regions in NGC 4696 and NGC 1275 provided some of the motivation for the heating models investigated by Ferland et al. (2009). However, previous studies did not consider the lines observed with Herschel, which provide a crucially important perspective on the physical model of the ISM.
Though our model contains additional energy explicitly in the form of extra heating, we speculate the ionizing-particle model would also have fitted the available data, as has been shown for Perseus. In order to discern the two heating sources, deep optical observations are needed to complement the Herschel data.
7 Summary
We made far-infrared (FIR) observations of the brightest galaxy, NGC 4696, of the Centaurus galaxy cluster with the Herschel telescope to better understand the cooling and heating of the intracluster medium.
-
•
We have detected FIR coolants in NGC 4696, which include extended [Cii] 157.74 m, marginally extended [Oi] 63.18 m and unresolved [Nii] 121.90 m line emissions.
-
•
We have detected far-infrared dust emission from the BCG at 70 m, 100 m, 160 m, 250 m, 350 m and 500 m. A spectral energy distribution (SED) fitting of the dust emission reveals a high-mass cold component around K and a low-mass warm component around K.
-
•
Using the dust mass calculated from the SED fitting and the non-detection of CO (O’Dea et al., 1994), we derived an upper limit on the gas-to-dust mass ratio of 125. This makes NGC 4696 a galaxy with one of the lowest gas-to-dust mass ratios.
-
•
The star formation rate derived from the integrated FIR luminosity is about 0.13 . We derived similar upper limits from HST far-ultraviolet and GALEX near-ultraviolet observations.
-
•
The extended [Cii] emitting gas shows remarkably similar spatial morphology and kinematics as the optical H emitting and X-ray gas. This implies a common heating mechanism of the gas.
-
•
We envisage the FIR and optical emissions as arising from photo-dissociation regions (PDRs) adjacent to ionized regions. From a detailed modeling of such an integrated PDR, we conclude that in addition to heating via stellar photoionization, an additional non-radiative heating is required. The most likely model yields a total hydrogen density in the range (50 to 100) cm-3 and a FUV intensity field in the range (10 to 80) Habing.
Acknowledgments
This work is based (in part) on observations made with Herschel, a European Space Agency Cornerstone Mission with significant participation by NASA. Support for this work was provided by NASA through an award issued by JPL/Caltech. We would like to thank the HSC and NHSC consortium for support with data reduction pipelines. R. Mittal is grateful to P. Appleton for repeated help with the Herschel analysis and thanks J. T. Whelan and D. Merritt for comments and discussions. B. McNamara and H. Russell acknowledge generous financial support from the Canadian Space Agency Space Science Enhancement Program. N. Hatch thanks STFC and the University of Nottingham Anne McLaren Fellowship for support. G. Tremblay acknowledges support from the New York Space Grant Consortium. This research has made use of the NASA/IPAC Extragalactic Database (NED) which is operated by the JPL/Caltech, under contract with NASA. STSDAS is a product of the Space Telescope Science Institute, which is operated by AURA for NASA.
References
- Aannestad & Emery (2003) Aannestad P. A., Emery R. J., 2003, A&A, 406, 155
- Allen (1995) Allen S. W., 1995, MNRAS, 276, 947
- Allen & Fabian (1994) Allen S. W., Fabian A. C., 1994, MNRAS, 269, 409
- Aravena et al. (2008) Aravena M., Bertoldi F., Schinnerer E., Weiss A., Jahnke K., Carilli C. L., Frayer D., Henkel C., Brusa M., Menten K. M., Salvato M., Smolcic V., 2008, A&A, 491, 173
- Bakes & Tielens (1998) Bakes E. L. O., Tielens A. G. G. M., 1998, ApJ, 499, 258
- Binney & Tabor (1995) Binney J., Tabor G., 1995, MNRAS, 276, 663
- Bîrzan et al. (2004) Bîrzan L., et al., 2004, ApJ, 607, 800
- Bregman et al. (2006) Bregman J. N., Fabian A. C., Miller E. D., Irwin J. A., 2006, ApJ, 642, 746
- Burns (1990) Burns J. O., 1990, AJ, 99, 14
- Canning et al. (2011) Canning R. E. A., et al., 2011, MNRAS, submitted
- Canning et al. (2010) Canning R. E. A., Fabian A. C., Johnstone R. M., Sanders J. S., Crawford C. S., Hatch N. A., Ferland G. J., 2010, MNRAS, p. 1800
- Cardelli et al. (1989) Cardelli J. A., Clayton G. C., Mathis J. S., 1989, ApJ, 345, 245
- Churazov et al. (2002) Churazov E., Sunyaev R., Forman W., Böhringer H., 2002, MNRAS, 332, 729
- Conselice et al. (2001) Conselice C. J., et al., 2001, AJ, 122, 2281
- Crawford et al. (1999) Crawford C. S., et al., 1999, MNRAS, 306, 857
- Crawford et al. (2005) Crawford C. S., Hatch N. A., Fabian A. C., Sanders J. S., 2005, MNRAS, 363, 216
- Crawford et al. (2005) Crawford C. S., Sanders J. S., Fabian A. C., 2005, MNRAS, 361, 17
- de Jong et al. (1990) de Jong T., Norgaard-Nielsen H. U., Jorgensen H. E., Hansen L., 1990, A&A, 232, 317
- Donahue et al. (2011) Donahue M., de Messières G. E., O’Connell R. W., Voit G. M., Hoffer A., McNamara B. R., Nulsen P. E. J., 2011, ApJ, 732, 40
- Donahue et al. (2000) Donahue M., Mack J., Voit G. M., Sparks W., Elston R., Maloney P. R., 2000, ApJ, 545, 670
- Dopita et al. (2010) Dopita M., Rhee J., Farage C., McGregor P., Bloxham G., Green A., Roberts B., Neilson J., Wilson G., Young P., Firth P., Busarello G., Merluzzi P., 2010, Ap&SS, 327, 245
- Dunn & Fabian (2006) Dunn R. J. H., Fabian A. C., 2006, MNRAS, 373, 959
- Dunne et al. (2000) Dunne L., Eales S., Edmunds M., Ivison R., Alexander P., Clements D. L., 2000, MNRAS, 315, 115
- Dunne & Eales (2001) Dunne L., Eales S. A., 2001, MNRAS, 327, 697
- Dwek & Arendt (1992) Dwek E., Arendt R. G., 1992, ARA&A, 30, 11
- Edge (2001) Edge A. C., 2001, MNRAS, 328, 762
- Edge et al. (2002) Edge A. C., et al., 2002, MNRAS, 337, 49
- Edge & Frayer (2003) Edge A. C., Frayer D. T., 2003, ApJ, 594, L13
- Edge et al. (2010a) Edge A. C., Oonk J. B. R., Mittal R., et al., 2010a, A&A, 518, L46
- Edge et al. (2010b) Edge A. C., Oonk J. B. R., Mittal R., et al., 2010b, A&A, 518, L47
- Edwards et al. (2007) Edwards L. O. V., Hudson M. J., Balogh M. L., Smith R. J., 2007, MNRAS, 379, 100
- Fabian (1994) Fabian A. C., 1994, ARA&A, 32, 277
- Fabian et al. (2002) Fabian A. C., et al., 2002, MNRAS, 331, 369
- Fabian et al. (1982) Fabian A. C., Nulsen P. E. J., Atherton P. D., Taylor K., 1982, MNRAS, 201, 17P
- Fabian et al. (2005) Fabian A. C., Sanders J. S., Taylor G. B., Allen S. W., 2005, MNRAS, 360, L20
- Fabian et al. (2011) Fabian A. C., Sanders J. S., Williams R. J. R., Lazarian A., Ferland G. J., Johnstone R. M., 2011, ArXiv e-prints
- Farage et al. (2010) Farage C. L., McGregor P. J., Dopita M. A., Bicknell G. V., 2010, ApJ, 724, 267
- Ferland et al. (2008) Ferland G. J., Fabian A. C., Hatch N. A., Johnstone R. M., Porter R. L., van Hoof P. A. M., Williams R. J. R., 2008, MNRAS, 386, L72
- Ferland et al. (2009) Ferland G. J., Fabian A. C., Hatch N. A., Johnstone R. M., Porter R. L., van Hoof P. A. M., Williams R. J. R., 2009, MNRAS, 392, 1475
- Ferland et al. (1998) Ferland G. J., Korista K. T., Verner D. A., Ferguson J. W., Kingdon J. B., Verner E. M., 1998, PASP, 110, 761
- Graham et al. (2006) Graham J., Fabian A. C., Sanders J. S., Morris R. G., 2006, MNRAS, 368, 1369
- Griffin et al. (2010) Griffin M. J., Abergel A., Abreu A., Ade P. A. R., André P., Augueres J., Babbedge T., et al., 2010, A&A, 518, L3+
- Habing (1968) Habing H. J., 1968, Bull. Astron. Inst. Netherlands, 19, 421
- Hatch et al. (2005) Hatch N. A., Crawford C. S., Fabian A. C., Johnstone R. M., 2005, MNRAS, 358, 765
- Heckman et al. (1989) Heckman T. M., Baum S. A., van Breugel W. J. M., McCarthy P., 1989, ApJ, 338, 48
- Heiles (1994) Heiles C., 1994, ApJ, 436, 720
- Hicks & Mushotzky (2005) Hicks A. K., Mushotzky R., 2005, ApJ, 635, L9
- Hoffer et al. (2011) Hoffer H., et al., 2011, in preparation
- Hollenbach et al. (1991) Hollenbach D. J., Takahashi T., Tielens A. G. G. M., 1991, ApJ, 377, 192
- Hollenbach & Tielens (1999) Hollenbach D. J., Tielens A. G. G. M., 1999, Reviews of Modern Physics, 71, 173
- Hu et al. (1985) Hu E. M., Cowie L. L., Wang Z., 1985, ApJS, 59, 447
- Hudson et al. (2010) Hudson D. S., Mittal R., Reiprich T. H., Nulsen P. E. J., Andernach H., Sarazin C. L., 2010, A&A, 513, A37+
- Ikebe et al. (1999) Ikebe Y., Makishima K., Fukazawa Y., Tamura T., Xu H., Ohashi T., Matsushita K., 1999, ApJ, 525, 58
- Ikeuchi & Ostriker (1986) Ikeuchi S., Ostriker J. P., 1986, ApJ, 301, 522
- Jaffe & Bremer (1997) Jaffe W., Bremer M. N., 1997, MNRAS, 284, L1
- Johnstone et al. (1987) Johnstone R. M., Fabian A. C., Nulsen P. E. J., 1987, MNRAS, 224, 75
- Johnstone et al. (2007) Johnstone R. M., Hatch N. A., Ferland G. J., Fabian A. C., Crawford C. S., Wilman R. J., 2007, MNRAS, 382, 1246
- Kaastra et al. (2001) Kaastra J. S., et al., 2001, A&A, 365, L99
- Kaneda et al. (2007) Kaneda H., Onaka T., Kitayama T., Okada Y., Sakon I., 2007, PASJ, 59, 107
- Kaneda et al. (2005) Kaneda H., Onaka T., Sakon I., 2005, ApJ, 632, L83
- Kaufman et al. (1999) Kaufman M. J., Wolfire M. G., Hollenbach D. J., Luhman M. L., 1999, ApJ, 527, 795
- Kennicutt (1998) Kennicutt Jr. R. C., 1998, ARA&A, 36, 189
- Laine et al. (2003) Laine S., van der Marel R. P., Lauer T. R., Postman M., O’Dea C. P., Owen F. N., 2003, AJ, 125, 478
- Leitherer et al. (1999) Leitherer C., Schaerer D., Goldader J. D., González Delgado R. M., Robert C., Kune D. F., de Mello D. F., Devost D., Heckman T. M., 1999, ApJS, 123, 3
- Levenberg (1944) Levenberg K., 1944, The Quarterly of Applied Mathematics, 2, 164
- Lewis et al. (2003) Lewis K. T., Eracleous M., Sambruna R. M., 2003, ApJ, 593, 115
- Lucey et al. (1986) Lucey J. R., Currie M. J., Dickens R. J., 1986, MNRAS, 221, 453
- Luhman et al. (2003) Luhman M. L., Satyapal S., Fischer J., Wolfire M. G., Sturm E., Dudley C. C., Lutz D., Genzel R., 2003, ApJ, 594, 758
- Marquardt (1963) Marquardt D., 1963, SIAM Journal on Applied Mathematics, 11, 431
- McNamara et al. (1989) McNamara B. R., et al., 1989, AJ, 98, 2018
- McNamara & Nulsen (2007) McNamara B. R., Nulsen P. E. J., 2007, ARA&A, 45, 117
- Merloni & Heinz (2007) Merloni A., Heinz S., 2007, MNRAS, 381, 589
- Mittal et al. (2009) Mittal R., et al., 2009, A&A, 501, 835
- Mittaz et al. (2001) Mittaz J. P. D., et al., 2001, A&A, 365, L93
- Oberst et al. (2006) Oberst T. E., Parshley S. C., Stacey G. J., Nikola T., Löhr A., Harnett J. I., Tothill N. F. H., Lane A. P., Stark A. A., Tucker C. E., 2006, ApJ, 652, L125
- O’Dea et al. (1994) O’Dea C. P., Baum S. A., Maloney P. R., Tacconi L. J., Sparks W. B., 1994, ApJ, 422, 467
- O’Dea et al. (2008) O’Dea C. P., Baum S. A., Privon G., Noel-Storr J., Quillen A. C., Zufelt N., Park J., Edge A., Russell H., Fabian A. C., Donahue M., Sarazin C. L., McNamara B., Bregman J. N., Egami E., 2008, ApJ, 681, 1035
- O’Dea et al. (2004) O’Dea C. P., et al., 2004, ApJ, 612, 131
- O’Dea et al. (2010) O’Dea K. P., Quillen A. C., O’Dea C. P., Tremblay G. R., Snios B. T., Baum S. A., Christiansen K., Noel-Storr J., Edge A. C., Donahue M., Voit G. M., 2010, ApJ, 719, 1619
- Oegerle et al. (2001) Oegerle W. R., Cowie L., Davidsen A., Hu E., Hutchings J., Murphy E., Sembach K., Woodgate B., 2001, ApJ, 560, 187
- Ott (2010) Ott S., 2010, in Y. Mizumoto, K.-I. Morita, & M. Ohishi ed., Astronomical Data Analysis Software and Systems XIX Vol. 434 of Astronomical Society of the Pacific Conference Series, The Herschel Data Processing System – HIPE and Pipelines – Up and Running Since the Start of the Mission. p. 139
- Peterson et al. (2001) Peterson J. R., et al., 2001, A&A, 365, L104
- Peterson & Fabian (2006) Peterson J. R., Fabian A. C., 2006, Phys. Rep., 427, 1
- Peterson et al. (2003) Peterson J. R., Kahn S. M., Paerels F. B. S., Kaastra J. S., Tamura T., Bleeker J. A. M., Ferrigno C., Jernigan J. G., 2003, ApJ, 590, 207
- Pilbratt et al. (2010) Pilbratt G. L., Riedinger J. R., Passvogel T., Crone G., Doyle D., Gageur U., Heras A. M., Jewell C., Metcalfe L., Ott S., Schmidt M., 2010, A&A, 518, L1+
- Poglitsch et al. (2010) Poglitsch A., Waelkens C., Geis N., et al., 2010, A&A, 518, L2+
- Postman & Lauer (1995) Postman M., Lauer T. R., 1995, ApJ, 440, 28
- Quillen et al. (2008) Quillen A. C., et al., 2008, ApJS, 176, 39
- Rafferty et al. (2006) Rafferty D. A., et al., 2006, ApJ, 652, 216
- Röllig et al. (2007) Röllig M., Abel N. P., Bell T., et al., 2007, A&A, 467, 187
- Roychowdhury et al. (2004) Roychowdhury S., Ruszkowski M., Nath B. B., Begelman M. C., 2004, ApJ, 615, 681
- Sakelliou et al. (2002) Sakelliou I., et al., 2002, A&A, 391, 903
- Salomé & Combes (2003) Salomé P., Combes F., 2003, A&A, 412, 657
- Salomé et al. (2008) Salomé P., Combes F., Revaz Y., Edge A. C., Hatch N. A., Fabian A. C., Johnstone R. M., 2008, A&A, 484, 317
- Sanders et al. (2008) Sanders J. S., et al., 2008, MNRAS, 385, 1186
- Sanders & Fabian (2002) Sanders J. S., Fabian A. C., 2002, MNRAS, 331, 273
- Sanders & Fabian (2008) Sanders J. S., Fabian A. C., 2008, MNRAS, 390, L93
- Sparks et al. (1997) Sparks W. B., Carollo C. M., Macchetto F., 1997, ApJ, 486, 253
- Sparks et al. (1989) Sparks W. B., Macchetto F., Golombek D., 1989, ApJ, 345, 153
- Spinoglio (2009) Spinoglio L., 2009, in L. Pagani & M. Gerin ed., EAS Publications Series Vol. 34 of EAS Publications Series, Infrared spectroscopic diagnostics for Active Galactic Nuclei. pp 237–246
- Tamura et al. (2001) Tamura T., et al., 2001, A&A, 365, L87
- Taylor et al. (2006) Taylor G. B., Sanders J. S., Fabian A. C., Allen S. W., 2006, MNRAS, 365, 705
- Vázquez & Leitherer (2005) Vázquez G. A., Leitherer C., 2005, ApJ, 621, 695
- Vedel et al. (1994) Vedel H., Hellsten U., Sommer-Larsen J., 1994, MNRAS, 271, 743
- Voit & Donahue (2005) Voit G. M., Donahue M., 2005, ApJ, 634, 955
- Wolfire et al. (1990) Wolfire M. G., Tielens A. G. G. M., Hollenbach D., 1990, ApJ, 358, 116
- Xu et al. (2002) Xu H., et al., 2002, ApJ, 579, 600