Spectroscopy of mechanical dissipation in micro-mechanical membranes
Abstract
We measure the frequency dependence of the mechanical quality factor () of SiN membrane oscillators and observe a resonant variation of by more than two orders of magnitude. The frequency of the fundamental mechanical mode is tuned reversibly by up to 40% through local heating with a laser. Several distinct resonances in are observed that can be explained by coupling to membrane frame modes. Away from the resonances, the background is independent of frequency and temperature in the measured range.
pacs:
62.25.-g, 85.85.+j, 42.79.-e, 42.50.wkMicro-mechanical membrane oscillators are currently investigated in many optomechanics experiments, where lasers and optical cavities are used for cooling, control, and readout of their mechanical vibrations.Wilson09 ; Thompson08 ; Zwickl08 ; Camerer11 ; Friedrich11 Applications lie in the area of precision force sensing and in fundamental experiments on quantum physics at macroscopic scales.Kippenberg08 The quality factor of the mechanical modes of the membranes is a key figure of merit in such experiments. However, the origin of mechanical dissipation limiting the attainable is not completely understood and a subject of intense research.Verbridge07 ; Wilson-Rae08 ; Southworth09 ; Unterreithmeier10 ; Rae11 ; Cole11
Here we report an experiment in which we observe a variation of by more than two orders of magnitude as a function of the fundamental mode frequency of a SiN membrane. Several distinct resonances in are observed that can be explained by coupling to mechanical modes of the membrane frame.Wilson-Rae08 ; Rae11 The frequency of the membrane modes is tuned reversibly by up to 40% through local heating of the membrane with a laser. This method of frequency tuning has the advantage that the frequency dependence of can be studied with a single membrane in situ, resulting in a detailed spectrum of the coupling to the environment of this particular mode. Other methods that compare between various structures of different sizes have to rely on the assumption that the environment of these structures is comparable.Cole11
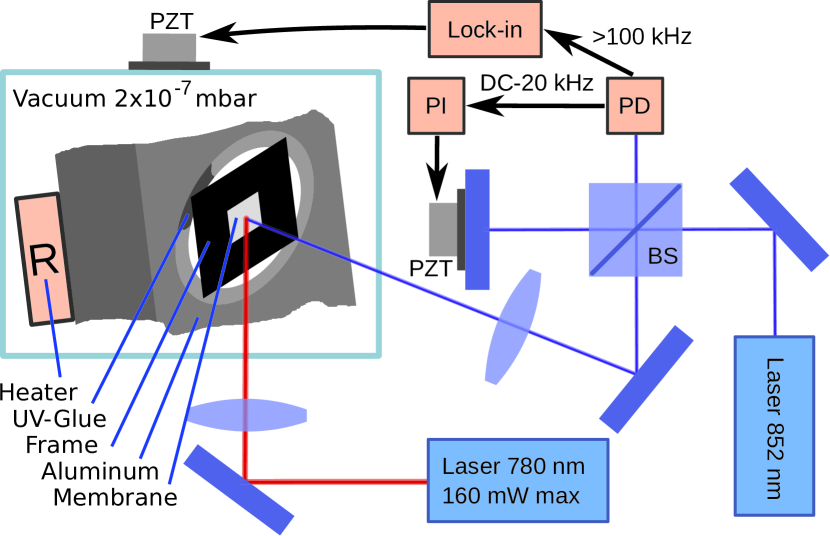
We investigate “low-stress” SiN membranes that are supported by a Si frame.cite:membrane The frame is glued at one edge to a holder inside a vacuum chamber, see Fig. 1. The eigenfrequencies of a square membrane under tension are
where is the side length, the density,Zink04 and the tensile stress in the membrane. The modes are labeled by the number of anti-nodes and along the two dimensions. The stress , where is Young’s modulus, arises in the fabrication process. The SiN membrane is stretched from its equilibrium length to the length of the Si frame.
To read out the membrane vibrations, a Michelson interferometer operating at nm is used, where one end mirror consists of the membrane. The interferometer is stabilized by the DC to kHz part of the photodiode (PD) signal. The incident power on the membrane is W in a diameter of m and the position sensitivity is . The kHz frequency components of the signal are fed into a lock-in amplifier with integrated phase locked loop, which measures the membrane amplitude and drives its motion via a piezo mounted outside of the vacuum chamber.
To tune the membrane frequency, a power stabilized nm laser is focused onto the membrane to a diameter of m. This laser heats the membrane locally in its center. A second method of heating the whole membrane and frame is by a resistive heater (R) in the chamber.
In a first experiment, we demonstrate the tunability of the membrane eigenfrequencies through laser heating. Fig. 2 shows the recorded mode spectrum as a function of heating laser power . The spectra are recorded by Fourier transforming the PD signal. One can see a reversible decrease of all mode frequencies with .
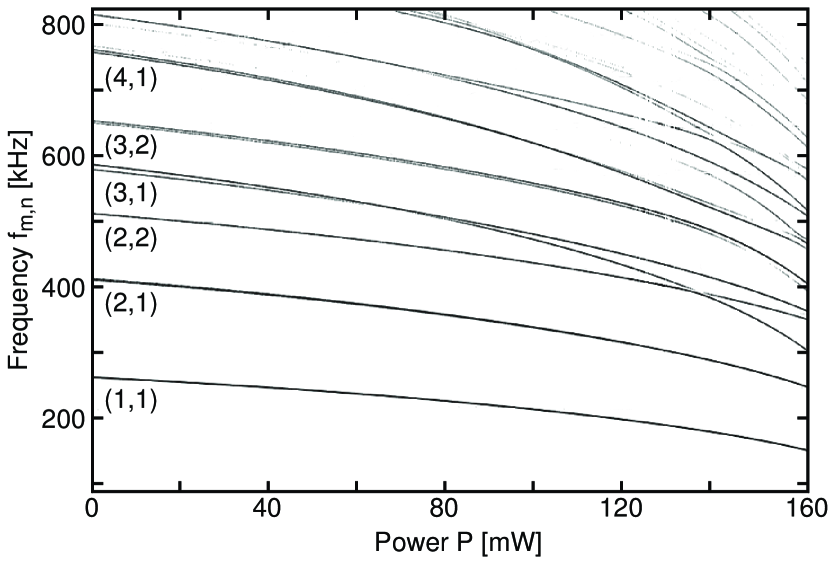
The decrease in frequency can be attributed to a thermal expansion of the membrane , where is the equilibrium length change and () the first (second) order expansion coefficient for a temperature change . This reduces the tensile stress by . In a simple model assuming a spatially homogeneous and linear temperature change with power , one can describe the power-dependence of the stress as
A fit of to the data describes the observed dependence within kHz. For low we observe a linear shift of . We neglect the dependence of on because it is small.Chuang04 ; Rouxel02 As shown in Tab. 1, the tunability of depends strongly on the geometry.
In order to extract from the fit, one has to measure . This is done by heating up the whole sample holder with the resistive heater. In this case both and change and the difference in the expansion coefficients of the frame and the membrane determines . Heating the setup by K and usingChuang04 GPa andLyon77 ppm/K, one gets ppm/K, and . This yields an average membrane temperature of C for mW.
To model laser absorption in the membrane, we perform a finite element (FEM) simulation of laser heatingWallquist10 using a Gaussian beam profile and a heat conductivityZink04 W/K m. From the resulting temperature distribution we calculate the average membrane temperature for a given absorbed laser power. By comparing with , we find that a fraction of of the nm laser power is absorbed, an order of magnitude larger than the absorption in low-stress membranes at nm.Thompson08 ; Zwickl08
| [m] | 250 | 500 | 1000 | 1500 | 500 | 500 |
|---|---|---|---|---|---|---|
| [nm] | 50 | 50 | 50 | 50 | 75 | 100 |
| [MPa] | 66.4 | 98.0 | 120 | 78.8 | 114 | 217 |
| [kHz] | 428 | 260 | 144 | 77.7 | 281 | 387 |
| [Hz/mW] | -259 | -363 | -68.9 | -49.5 | -89.6 | -10.5 |
| [] |
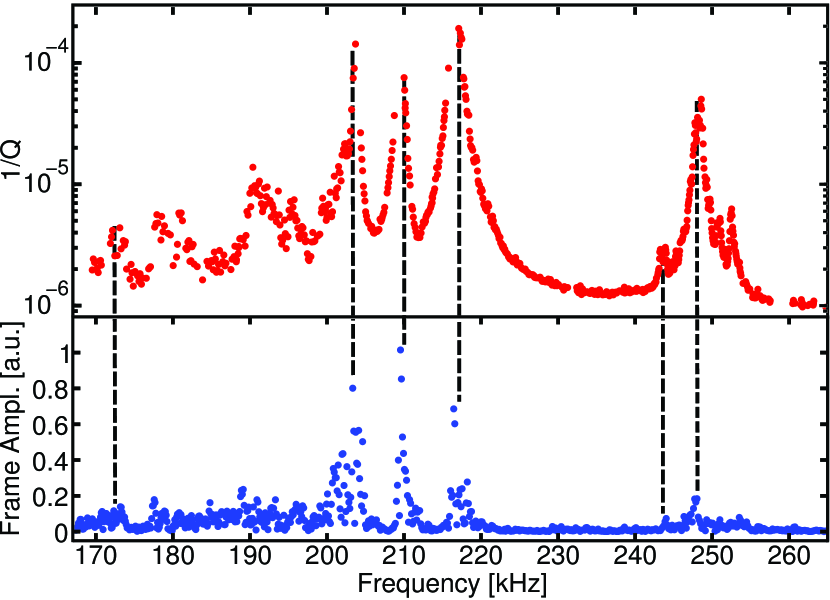
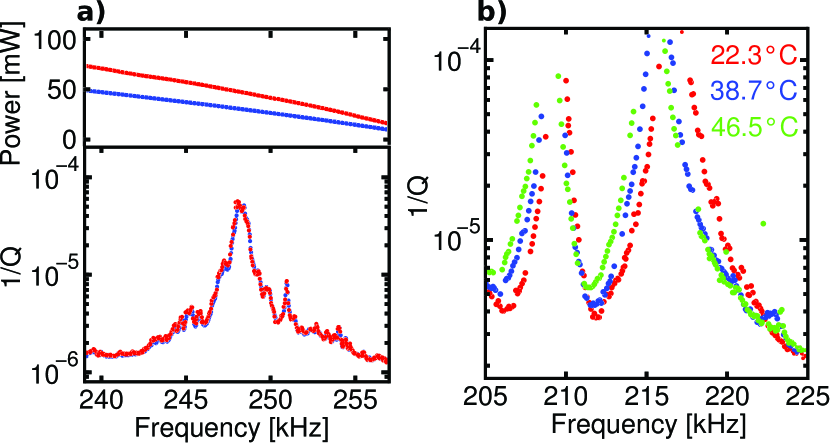
In a second experiment, we use laser tuning to record a spectrum of the quality factor of the fundamental mode as a function of . We measure the decay time of the membrane amplitude in ring-down measurements after driving it to nm. The upper plot in Fig. 3 shows the dissipation . We observe distinct resonances, changing by more than two orders of magnitude. To show that the spectrum directly depends on , the heating laser is pointed off center such that a different dependence results, see Fig. 4a. The dependence is unchanged, showing that only indirectly depends on . The resonances in can be attributed to coupling of the membrane mode to modes of the frame. To prove this, the interferometer is pointed onto the frame next to the membrane and the amplitude response to a driving with the piezo is recorded, as shown in the lower plot in Fig. 3. The observed frame modes clearly overlap with the resonances in . If the frame is heated with the resistive heater, we observe a shift in the resonances in , as shown in Fig. 4b. We attribute this to a shift of the frame modes due to thermal expansion and decreasing Young’s modulus.
All these measurements prove that the coupling to frame modes is responsible for the observed behavior of . A FEM simulation of the frame modes shows roughly the right density of modes in the frequency range of interest. As the eigenfrequencies depend strongly on the exact mounting, dimensions, and Young’s modulus of the frame, it is difficult to model them quantitatively.
For stoichiometric “high-stress” membranes ( MPa) we observe a much weaker dependence of the mode frequencies on . The measurements indicate that absorption of nm light is lower by two orders of magnitude compared to the “low-stress” membranes. This is of importance for experiments coupling such membranes to atomic systems.Camerer11 Using the limited tuning range of the resistive heater, we also observe a change of with frequency in high-stress membranes. This shows that coupling to frame modes is also important in this case. The highest measured is for a high-stress membrane with mm and nm.
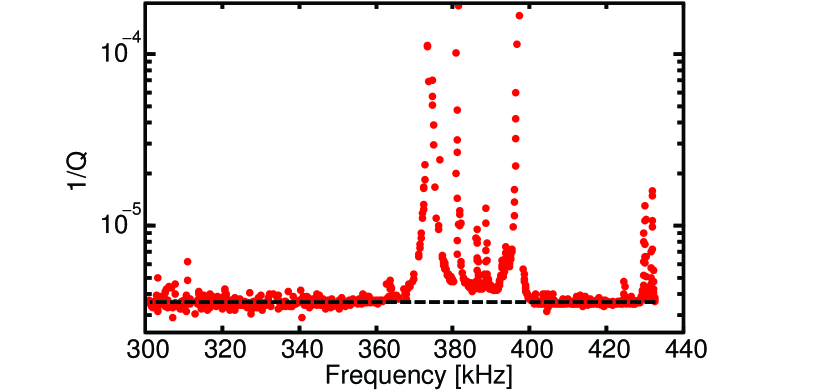
Besides coupling to frame modes, the frequency dependence of other dissipation mechanisms is of interest. Fig. 5 shows the dissipation spectrum of another low-stress membrane. Away from the resonances, we observe a constant baseline , indicating that other dissipation mechanisms are independent of and within our tuning range. This is in contrast to what has been observed in SiN strings.Verbridge07 ; Unterreithmeier10 We observe that increases with , see Tab. 1. We also studied higher order modes up to and find approximately the same , in contrast to other membrane experiments.Rae11 This could be due to the different frame geometry and mounting. In our case, the frame is a relatively small resonant structure with eigenmodes at distinct frequencies. This can be exploited to reduce clamping loss by tuning the membrane frequency to a gap between frame modes, analogous to the recently demonstrated phononic bandgap shielding.Alegre11
In conclusion, we presented a precise method for laser-tuning of micro-mechanical membrane oscillators and used it for spectroscopy of mechanical dissipation. Resonances in the dissipation were observed and explained as coupling to localized frame modes. Other dissipation mechanisms were found to be independent of membrane frequency and temperature in the measured range.
Our laser tuning technique could be extended to stoichiometric membranes by using a laser with smaller wavelength and thus higher absorption.Tan09 This would allow further investigation of the differences between low-stress and stoichiometric membranes. Moreover, it could be useful in finding optimal frame geometry and mounting conditions to circumvent clamping loss.
We acknowledge helpful discussions with I. Wilson-Rae, M. Aspelmeyer, K. Hammerer, and T. W. Hänsch. Work supported by the EU project AQUTE and the NCCR Nanoscale Science.
References
- (1) J. D. Thompson et al., Nature 452, 72 (2008).
- (2) B. M. Zwickl et al., Appl. Phys. Lett. 92, 103125 (2008).
- (3) D. J. Wilson, C. A. Regal, S. B. Papp, and H. J. Kimble, Phys. Rev. Lett. 103, 207204 (2009).
- (4) S. Camerer et al., arXiv:1107.3650 (2011).
- (5) D. Friedrich et al., arXiv:1104.3251 (2011).
- (6) T. J. Kippenberg and K. J. Vahala, Science 321, 1172 (2008), F. Marquardt and S. M. Girvin, Physics 2, 40 (2009), I. Favero and K. Karrai, Nat. Photonics 3, 201 (2009), D. Hunger et al., arXiv:1103.1820 (2011)
- (7) S. S. Verbridge, D. F. Shapiro, H. G. Craighead, and J. M. Parpia, Nano Letters 7, 1728 (2007).
- (8) I. Wilson-Rae, Phys. Rev. B 77, 245418 (2008).
- (9) D. R. Southworth et al., Phys. Rev. Lett. 102, 225503 (2009).
- (10) Q. P. Unterreithmeier, T. Faust, and J. P. Kotthaus, Phys. Rev. Lett. 105, 027205 (2010).
- (11) I. Wilson-Rae et al., Phys. Rev. Lett. 106, 047205 (2011).
- (12) G. D. Cole et al., Nature Communications 2 231 (2011).
- (13) www.norcada.com
- (14) B. Zink and F. Hellman, Solid State Commun. 129, 199 (2004).
- (15) W.-H. Chuang, T. Luger, R. Fettig, and R. Ghodssi, J. Microelectromech. S. 13, 870 (2004).
- (16) T. Rouxel et al., Acta Mater. 50, 1669 (2002).
- (17) K. G. Lyon et al., J. Appl. Phys. 48, 865 (1977).
- (18) M. Wallquist et al., Phys. Rev. A 81, 023816 (2010).
- (19) T. P. M. Alegre, A. Safavi-Naeini, M. Winger, and O. Painter, Opt. Express 19, 5658 (2011).
- (20) W. C. Tan, S. Kobayashi, T. Aoki, R. E. Johanson, and S. O. Kasap, J Mater. Sci.: Mater. Electron. 20, S15 (2009).