30
About the nature of Mercer 14
Abstract
We used UKIRT near infrared (NIR) broad band JHK photometry, narrow band imaging of the 1-0 S(1) molecular hydrogen emission line and mid infrared Spitzer IRAC data to investigate the nature of the young cluster Mercer 14. Foreground star counts in decontaminated NIR photometry and a comparison with the Besancon Galaxy Model are performed to estimate the cluster distance. This method yields a distance of 2.5 kpc with an uncertainty of about 10 % and can be applied to other young and embedded clusters. Mercer 14 shows clear signs of ongoing star formation with several detected molecular hydrogen outflows, a high fraction of infrared excess sources and an association to a small gas and dust cloud. Hence, the cluster is less than 4 Myrs old and has a line of sight extinction of AK = 0.8 mag. Based on the most massive cluster members we find that Mercer 14 is an intermediate mass cluster with about 500 M⊙.
keywords:
Galaxy: open clusters, individual; ISM: jets and outflows; stars: formation1 Introduction
Understanding the formation of stars is one of the key topics of current astrophysical research. It occurs in embedded clusters within giant molecular clouds. A large fraction of all young stars are formed in such clusters (e.g. Lada & Lada (2003)). Low star formation efficiency, as well as feedback (radiation, winds, outflows) from young and massive stars leads to the disruption of many of those clusters in the first 10 Myrs of their life and generates the field star population. Thus, in order to understand the formation of stellar clusters one has to investigate the youngest (up to a few Myrs old) objects. Preferably a large number of objects should be investigated to account for environmental influences, but detailed investigations of individual objects are vital to accurately determine their physical parameters such as age, distance and line of sight reddening.
Investigations of these young embedded clusters are hampered by the high column density material in their vicinity. Recent years have seen advances of large scale near and mid-infrared surveys (2 Micron All Sky Survey (2MASS, Skrutskie et al. (2006)); UK Infrared Deep Sky Survey (UKIDSS, Lawrence et al. (2007)) Galactic Plane Survey (GPS, Lucas et al. (2008)); GLIMPSE, Benjamin et al. (2003)) which allow us to discover and characterise the properties of a variety of these young embedded clusters at wavelengths less influenced by interstellar extinction. A large number of so far unknown stellar clusters in the Galaxy have been found in those surveys (e.g. Bica et al. (2003). Mercer et al. (2005), Froebrich et al. (2007), to name just a few).
In particular the list by Mercer et al. (2005), based on mid-infrared Spitzer data, contains a number of embedded young clusters hidden from view in shorter wavelengths surveys. One of these, Mercer 14, has so far not attracted any attention besides the discovery paper. We aim to determined the nature of this cluster mainly by means of near infrared JHK photometry obtained from the UKIDSS GPS and the UK Infrared Telescope (UKIRT) Widefield Infrared Survey for H2 (UWISH2, Froebrich et al. (2011)) which is using a narrow band filter centred on the 1-0 S(1) emission line of molecular hydrogen at 2.122 m.
We briefly discuss the data used in our paper in Sect. 2. Our analysis, in particular the results of the decontamination of the photometry, the cluster distance determination and the identification of molecular outflows from young stars in the cluster are discussed in Sect. 3. We then put forward our conclusions in Sect. 4.
2 Data and Analysis
2.1 Near infrared UKIRT WFCAM data
We obtained near infrared imaging data in the 1-0 S(1) line of molecular hydrogen using the Wide Field Camera (WFCAM, Casali et al. (2007)) at UKIRT. The data are part of the UWISH2 survey (Froebrich et al. (2011)) and the H2 images are taken with a per pixel integration time of 720 s and under very good seeing conditions. The full width half maximum of the stellar point spread function is 0.7″and the 5 point source detection limit is about 18 mag. Our narrow band data were taken on the 30th of July in 2009.
In order to perform the continuum subtraction of our narrow band images we further utilised the UKIDSS data in the near infrared JHK bands taken with the same telescope and instrumental setup as part of the GPS. This broad band data was taken on the 1st of June in 2006 in all three filters. All GPS data used was taken from data release 7.
All NIR (UWISH2 and GPS) data reduction and photometry are performed by the Cambridge Astronomical Survey Unit. Reduced images and photometry tables are available via the Wide Field Astronomy Unit and are downloaded from the WFCAM Science Archive (Hambly et al. (2008)). The basic data reduction procedures applied are described in Dye et al. (2006). Calibration (photometric as well astrometric) is performed using 2MASS (Skrutskie et al. (2006)) and the details are described in Hodgkin et al. (2009). All NIR magnitudes used in this paper are quoted for AperMag3, i.e. a 2″ aperture, the standard for GPS point sources (see Lucas et al. (2008) for details).
2.2 Mid infrared Spitzer IRAC data
We also downloaded IRAC images for all filters and point source photometric catalogues of the region that have been obtained by Spitzer as part of the GLIMPSE Survey (Benjamin et al. (2003)). All data is part of the final release of enhanced data products for GLIMPSE. Except two, all of the potential outflow driving sources for which we require photometry are extended. Hence, they are not part of the GLIMPSE point source catalogue. We thus performed aperture photometry on the IRAC images.
We defined apertures encompassing all the flux from the extended sources, as well as apertures around some bright point sources (e.g. obj. C, see Table 1). Since the cluster is embedded in partly dense material, the background flux for each source has been determined in an aperture as close to the source as possible. Fluxes above the background were then converted into magnitudes and calibrated using the bright source obj. C, whose magnitudes are taken from the GLIMPSE point source catalogue. Uncertainties introduced due to background estimation and the choise of aperture are about 0.1 mag for the two short wavelengths filter. For the longer wavelengths we estimate a larger error of about 0.2 mag, since the background emission is stronger (in particular in the 8 m filter) and spatially variable on small scales. In conjunction with the GLIMPSE calibration uncertainty of 0.1 mag to 0.2 mag our photometric uncertainties are 0.2 – 0.3 mag with the larger value valid for the longer wavelengths filters.
3 Analysis and discussion of Mercer 14
3.1 General
The cluster Mercer 14 has been discovered by Mercer et al. (2005) during their search for embedded star clusters utilising GLIMPSE data. The cluster is embedded in a small, mid-infrared bright molecular cloud. It has, except in the discovery paper, not attracted any attention nor have its parameters be determined. The near infrared JHK images give the impression of a spherically symmetric accumulation of stars, clearly visible at near infrared wavelengths. The central coordinates, determined visually are at 18:58:05.8 01:36:34, in perfect agreement with the coordinates given in Mercer at al. (2005). Visually the radius of the cluster is about half an arcminute.
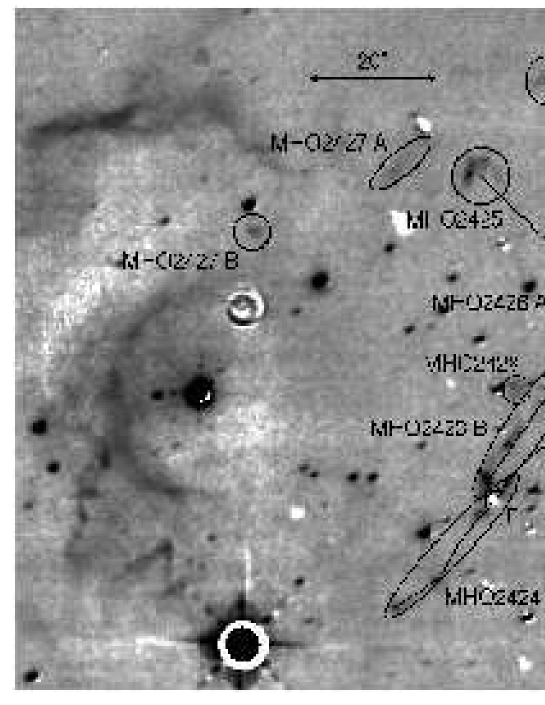
Our continuum subtracted molecular hydrogen images of the cluster vicinity show that there are a number of H2 flows and features, mostly just to the North-North-East of the cluster (see Fig. 1). If they are associated with the cluster itself, then this would indicate that Mercer 14 is a young stellar cluster, with partly still ongoing star formation. At the northern edge of the cluster there is a very red, fuzzy nebulosity visible in the JHK colour images. It coincides with one of the IRAC detected Extended Green Objects (EGOs; EGO G035.13-0.74; Cyganowski et al. (2008); Obj. A in Table 1). Only 4″ to the north-east of this, we find a smaller red reflection nebula, a fainer EGO not included in the list by Cyganowski et al. (2008) (Obj. B). About 75” to the North-East-East of the cluster centre we detect a bright star (K = 9.5 mag in 2MASS) in the centre of a small HII region. This object is actually listed as a Planetary Nebula (PN G035.1-00.7) in the SIMBAD database. The NIR images, however, clearly suggest that this object is an HII region (see a more detailed discussion in Sect. 3.6).
3.2 NIR cluster decontamination
In order to analyse the cluster properly, we need to decontaminate the NIR photometry from fore and background objects. The decontamination is based on the method established by Bonatto & Bica (2007). But we use the improvements introduced by Froebrich et al. (2010). We download the near infrared photometry from the GPS within 3′ around the cluster centre. Only stars with a detection above the local completeness limit (J = 18.5 mag, H = 17.5 mag, K = 17.0 mag) in each filter, photometric uncertainties of less than 0.1 mag, and with a pstar value of more than 0.9 are considered (i.e. only star like objects, see Lucas et al. (2008)).
We define as ’cluster area’ everything within 0.9′ from the cluster centre. As ’control region’ we use all stars between 2′ and 3′ from the central coordinates. The calculation of the membership probabilities for the individual stars in the cluster area is based on the 15th nearest neighbour in the colour-colour-magnitude space (see Froebrich et al. (2010) for details).
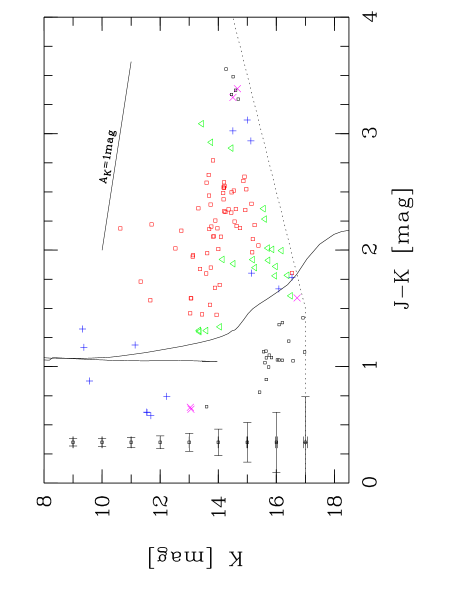
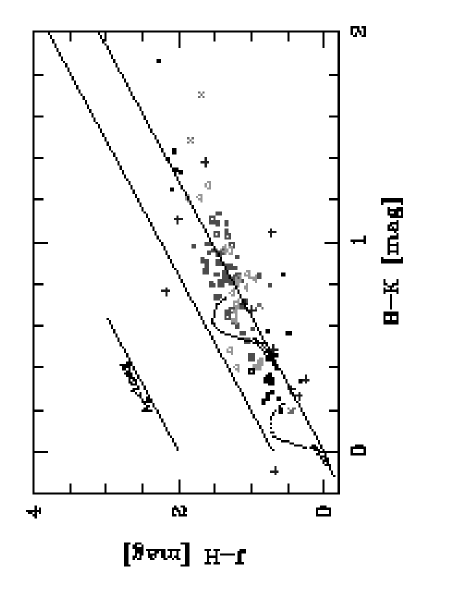
The result of the procedure is shown in the decontaminated colour-magnitude (CMD) and colour-colour (CCD) diagrams in Fig. 2 together with a cluster isochrone as a guide to the cluster sequence (see Sect. 3.5). There is a large fraction of stars with membership probabilities of more than 60 %, as well as possible fore or background objects not related to the cluster.
3.3 Distance determination
There are a variety of ways to determine the distance to Mercer 14 using the available data set. These are: i) Using an object associated to the cluster or its parental molecular cloud which has a known distance; ii) Perform isochrone fitting to the cluster’s decontaminated CMD and CCD; iii) Estimate the number of foreground stars to the cluster or its parental molecular cloud and compare this to the Besancon Galaxy model by Robin et al. (2003).
i) A search in the vicinity of Mercer 14 for objects of known distance did not reveal any usable object. The object nearest to the cluster with a reliable distance estimate is the massive star forming object G35.2N. Uruquart et al. (2011) place it at a distance of 2.3 kpc. Considering the projected separation of about 4.3′ (or about 3 pc at this distance), it is not entirely clear if the cluster and G35.2N are physically related. The 8 m GLIMPSE image of the region also reveals that Mercer 14 is just surrounded by a small cloud with no obvious connection to G35.2N.
ii) Given the low age and large number of pre-main sequence stars in the cluster (indicated by the presence of molecular outflows, as well as the isochrone fit, see below) it is extremely difficult to simultaneously fit the distance and age of the cluster to satisfactory accuracy. Rather the distance needs to be known in order to determine the approximate age and reddening to the cluster from photometry alone. Thus, an estimate of the number of stars foreground to the cluster or the parental molecular cloud can be determined and compared to the Besancon Galaxy model (Robin et al. (2003)) in order to estimate the distance. It has been shown e.g. by Scholz et al. (2010) that such an approach can give a reasonably accurate distance estimate.
iii) As a first possibility we count the number of blue (J - K 2.0 mag) stars per unit area across the parental molecular cloud of the cluster. We used six fields near the cluster to count foreground stars based on their colours. They are spread at different distances from the cluster (2′ – 4′). Fields too close to the cluster might contain cluster members, contaminating the analysis. On the other hand, fields too far away might show a too low extinction to successfully distinguish stars foreground or background to the cloud. One might even measure the distance to a cloud not related to the cluster at all, given its position in the Galactic Plane and the possibility of overlapping clouds along the line of sight. The area where foreground stars are counted should be as large as possible to minimise statistical errors. We choose one square arcminute sized fields. The number of foreground stars in them varies between 13 and 22, with an average of 18 stars per square arcminute.
We then estimated the photometric properties of the near infrared data set obtained from the GPS (completeness limit and photometric errors as a function of magnitude). A model photometric catalogue for 10 square arcminutes (we chose a larger area to improve the accuracy of the model) towards the cluster position and with the above determined restrictions for the JHK photometry was downloaded from the Besancon galaxy model webpage111http://model.obs-besancon.fr/. A comparison of the measured number of foreground stars with the model predictions leads to a distance estimate. The model stars are sorted by distance. We find the star in the list for which all stars closer than it would give a model star density equal to our measured foreground star density. The distance to this model star is then used as the distance to the cloud. By considering the variations of the forground star density we obtain a range of distances for the cloud of 2.1 kpc to 2.8 kpc with an average of 2.5 kpc.
The second possibility is to determine the number of stars per unit area that are foreground to the cluster itself. This is based on the decontaminated CMD of the cluster (see Sect. 3.2). The colour of most of the high probability cluster members is 2 mag or redder. Hence all stars bluer than this are potentially foreground stars. The total number of stars bluer than 2 mag is 71 within a radius of 0.9′ around the cluster centre. If we weight the contribution of each star by the probability that it is not a cluster member () then there are 17 stars per square arcminute foreground to the cluster. This corresponds to a distance of 2.5 kpc, in perfect agreement to the star counting estimates using the fields in the parental molecular cloud. This distance has been determined using the nearest 15 neighbours in colour-colour-magnitude space for the decontamination. When using the nearest 10 neighbours the distance estimate is about 2.0 kpc, for the 20th nearest neighbours we obtain 2.8 kpc. Thus, including the uncertainties, the value also agrees with the distance of G35.2N. Hence, Mercer 14 could indeed be part of the same star forming complex as the massive YSOs in G35.2N.
We use 2.5 kpc as distance to Mercer 14 throughout the paper.
3.4 Outflows and driving sources
As can be seen in Fig. 1, there are a number of molecular hydrogen outflow features just to the North-East of the cluster (labeled MHO 2423 – MHO 2428). In the following we will describe their properties and discuss possible driving sources. This discussion will be focused on the most obvious driving source candidates listed in Table 1 and labeled by letters A – E in Fig. 1. There are a larger number of other objects in the cluster region that show near infrared excess. About one in three of the high probability cluster members show K-band excess emission (objects to the right of the reddening band, see right panel of Fig. 2). Each of these could in principle drive an outflow and some of them might be the source for H2 emission features. Due to their large numbers and without further information such as proper motions of the emission knots we cannot include them into our considerations.
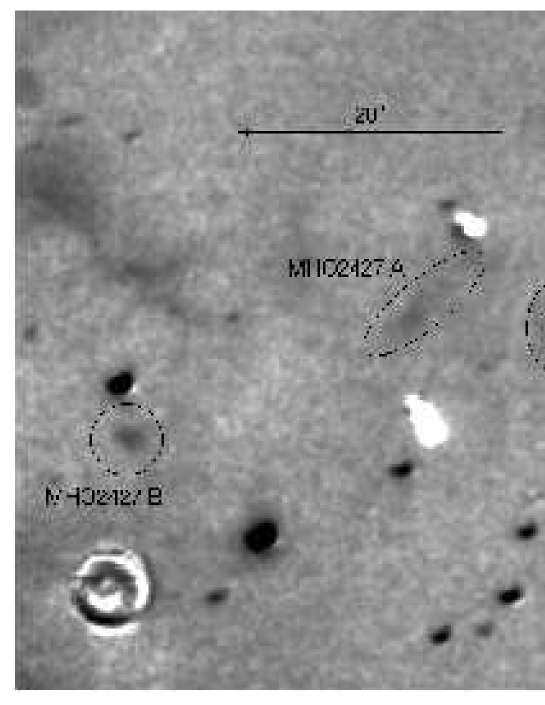
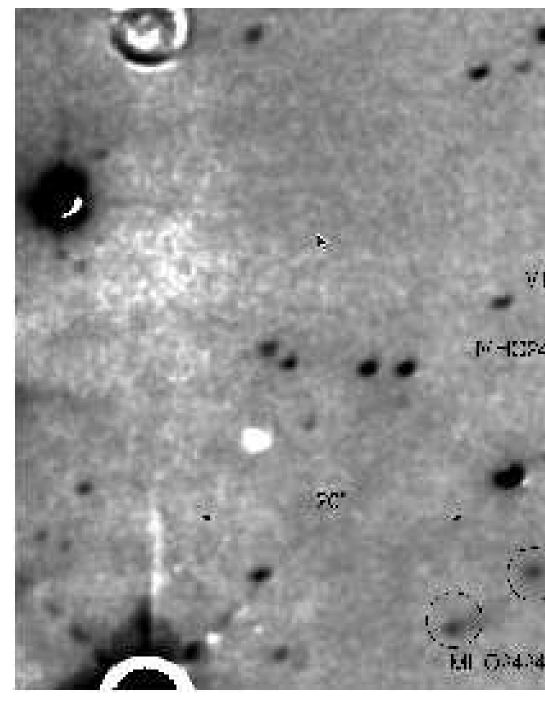
The numbering and naming of the molecular hydrogen emission line objects (MHOs) has been done in accordance with the convention set out by Davis et al. (2010). In the Appendix (online version only) we present two higher resolution continuum subtracted H2-K images (Figs. A1 and A2) with detailed labels for each identified MHO. None of the outflow features is visible in the H images taken by the IPHAS survey (Drew et al. (2005)). This is most likely caused by the high optical extinction towards the cluster (see below).
A summary of the MHO positions, fluxes and possible driving sources is given in Table 2.
MHO 2423
Objects MHO 2423 A and MHO 2423 B seem to form two sides of a symmetric bipolar outflow with a position angle of about 150∘. It has a length of 1′, which corresponds to about 0.75 pc at the adopted distance. Given the symmetry of the flow, the driving source should be situated on the axis defined by the two features and be located roughly half way between the two ends. There is no obvious bright source detectable in the NIR data. One of the two red and extended sources (obj. B in Table 1 – the faint EGO) is situated just off-axis. There is, however, a relatively bright and red Spitzer source (obj. D, undetected in the NIR images) closer to the axis. Based on its position and red ([3.6-4.5] = 3.1 mag) colour it is the most likely source for the flow.
MHO 2424
The identification of the source(s) of MHO 2424 A and MHO 2424 B is not so straight forward. Both could be driven by the bright EGO (obj. A). However, the small chain of three knots seems not to be aligned with this extended source. It also could be driven by the bright IRAC source (obj. C) which is completely invisible in the NIR images. In this case the flow would be one-sided and 23″ (0.3 pc) long. Given that we do not detect any counter flow and that there is plenty of material in the vicinity of the cluster, this does not seem a likely explanation.
Another possibility is that MHO 2424 A and MHO 2424 B form one flow which is driven by the red source obj. E. This object is faint in JHK but clearly detected in IRAC. If this is the driving source then the flow would have an s-shape, indicating the source is a binary. In particular the two knots which are symmetric and very close (4″) to source, seem to favour this explanation. The total length of the flow would then be about 0.8′ (0.6 pc). However, we cannot rule out that some of the H2 emission, in particular from MHO 2424 A, is driven by the bright EGO (obj. A).
MHO 2425
MHO 2425 is the a bright bow-shaped emission line object. It appears to form an open bow pointing towards the NE. As there is no chain of H2 emission (or other indications such as a counter flow), it is not possible to trace its source. It could be any of the young sources (obj. A – D). In each case the flow length between the shock and the source is about 0.5 pc.
MHO 2426
The object MHO 2426 A consists of two faint knots pointing away from the main region of outflow driving candidates. In particular the faint EGO (obj. B) seems to be aligned with the flow axis. Furthermore, MHO 2426 B could be part of this flow, as it is aligned with the axis (but see below in the next subsection). In any case, we would just detect one side of the flow, which would have a length of 0.5 pc (0.25 pc without MHO 2426 B).
MHOs 2426 B and MHO 2427
These three H2 knots are all situated about half a parsec to the north-north-east of the cluster. If MHO 2426 B is not part of a flow with MHO 2426 A, then these three objects could form an independent outflow, as they are aligned on a common axis with a length of 0.6 pc. However, there is no obvious source candidate (red GPS or Spitzer source) along this axis. Furthermore, for each H2 object individually, there is no source candidate. There are other H2 emission features to the West of the cluster. These are all associated with the HII region and apparent cloud edges in the 8 m Spitzer image. Hence all these features are very likely to be fluorescently excited by either the more massive young stars in the cluster, the central star of the HII region, or the general UV radiation field.
MHO 2428
MHO 2428 is a single H2 emission knot near MHO 2423 B. Based on the position and the clear flow structure of MHO 2423, this object seems unrelated. The most likely source might be the faint EGO (obj. B), which is 0.15 pc away. However, obj. B is also the best candidate source for MHO 2426 A (and MHO 2426 B).
| obj. | RA | DEC | I1 | I2 | I3 | I4 | Notes |
| (J2000) | (J2000) | [mag] | [mag] | [mag] | [mag] | ||
| A | 18:58:06.5 | +01:36:52 | 9.5 | 8.4 | 8.0 | 10.3 | bright EGO G035.13-0.74 |
| B | 18:58:06.4 | +01:37:02 | 10.6 | 9.7 | 9.0 | 11.3 | faint EGO |
| C | 18:58:05.6 | +01:37:01 | 12.1 | 9.0 | 7.4 | 6.8 | bright IRAC source, no GPS |
| D | 18:58:06.4 | +01:37:07 | 13.2 | 10.1 | 8.7 | 9.2 | faint IRAC source, no GPS |
| E | 18:58:07.5 | +01:36:41 | 11.2 | 9.8 | 8.9 | 8.4 | IRAC and GPS detection |
| MHO | RA | DEC | F[1-0 S(1)] | L[H2] | Possible sources |
| (J2000) | (J2000) | [W/m2] | [L⊙] | and length | |
| 2423 A | 18:58:05.9 | +01:37:20 | 3510-18 | 0.14 | obj. D, 0.75 pc |
| 2423 B | 18:58:07.2 | +01:36:52 | 3610-18 | 0.15 | obj. D, 0.75 pc |
| 2424 A | 18:58:06.5 | +01:36:52 | 3210-18 | 0.13 | obj. A, 0.15 pc, ?
obj. E, 0.6 pc |
| 2424 B | 18:58:08.0 | +01:36:33 | 1710-18 | 0.070 | obj. E, 0.6 pc |
| 2425 | 18:58:07.6 | +01:37:30 | 1910-18 | 0.078 | obj. C, 0.5 pc, ? |
| 2426 A | 18:58:06.7 | +01:37:15 | 4.510-18 | 0.018 | obj. B, 0.25 pc, ? |
| 2426 B | 18:58:07.0 | +01:37:45 | 6.710-18 | 0.027 | obj. B, 0.5 pc, ? |
| 2427 A | 18:58:08.5 | +01:37:32 | 6.210-18 | 0.026 | ? |
| 2427 B | 18:58:09.9 | +01:37:22 | 4.710-18 | 0.019 | ? |
| 2428 | 18:58:07.3 | +01:36:58 | 5.010-18 | 0.020 | obj. B, 0.15 pc, ? |
3.5 Cluster properties
Using the decontaminated photometry of the cluster region we plot colour-colour and colour-magnitude diagrams for the high probability cluster members (see Fig. 2). We over plot isochrones to determine the cluster parameters. Given the large distance of 2.5 kpc, we expect to detect relatively massive young stars (above about 1 M⊙) and no lower mass stars in our NIR data. We thus use isochrones from Girardi et al. (2002), which provide data for more massive stars.
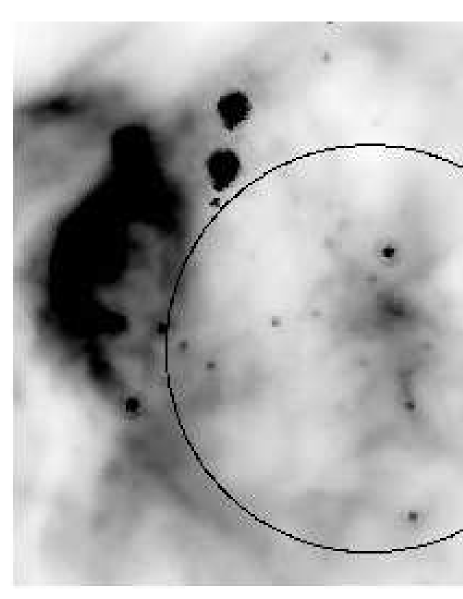
The distribution of high probability members in the CMD and in particular the CCD shows that the cluster suffers from a high amount of extinction, which to a large extent is intrinsic to the cluster. Hence, the differential reddening is very high, caused by the youth of Mercer 14. This is also indicated by the distribution of the 8 m emission as seen by Spitzer (right panel of Fig. 3). There one can clearly see that the cluster coincides with a 8 m emission peak. There is no correlation of a stars colour with distance to the emission peak. This indicates that the feature is not foreground to the cluster.
We use the CCD and an isochrone for 4 Myrs (the lowest age available from Girardi et al. (2002)) to estimate the minimum extinction shown by a high probability cluster member. This minimum is likely to be the foreground extinction. Using an extinction law of AK/AJ = 0.382 and AK/AH = 0.612 (based on Mathis (1990) and Froebrich et al. (2010)) we find a minimum foreground extinction of AK = 0.8 mag, or AV = 7.4 mag. This is in good agreement to the 2MASS based extinction maps by Rowles & Froebrich (2009). Their highest resolution map has 0.9′ resolution at the cluster position and determined an optical extinction of 5.9 mag. The differential reddening, indicated by the scatter of sources along the reddening band is at least of the same order of magnitude (AK = 0.8 mag) as the foreground extinction.
All high probability members appear in the bottom half of the reddening band in the CCD, in agreement with the fact that we only detect early spectral type sources and no low-mass stars in the cluster. A fraction of about one third of cluster members is found below the reddening band, indicating K-band excess emission from a disk. This fraction of objects with disk is likely to be a lower limit and indicates an age of less than 4 Myrs (Lada & Lada (2003)). This is also in agreement with the detected outflow activity and indicates a very low age for the cluster, potentially much less than the 4 Myrs used for the isochrone in Fig. 2.
The three brightest high probability cluster members ( %) have an apparent K-band brightness of about 9.5 mag. This corresponds to roughly a 20 M⊙ mass star. According to Weidner & Kroupa (2006) this maximum stellar mass indicates a total mass of the cluster of about 500 M⊙.
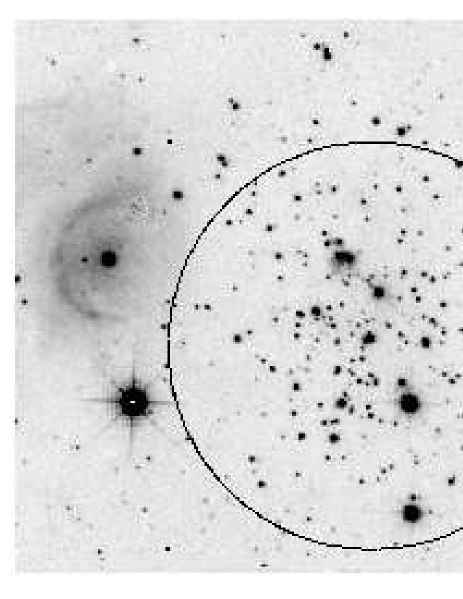
3.6 The nearby HII region
About 1.2′ (0.9 pc) East of the cluster one can identify a bright star (18:58:10.5, +01:36:57 (J2000)) within an almost semi-circularly shaped emission region (see Fig. 1 and left panel of Fig. 3). The object is listed as planetary nebula PN G035.1-00.7 in the SIMBAD database. Judging by the appearance this seems to be a mis-classification and the object appears to be an HII region. With an apparent radius of 14″ (0.17 pc) this corresponds to a compact HII region. The western edge of the region does not show any H2 emission, possibly because there is no material present to be excited by the central star, as it has been cleared to low density by the bright cluster stars in the vicinity.
The central star of the HII region is partly saturated in the UKIDSS GPS data, we hence use the 2MASS fluxes (J = 10.51 mag, H = 9.88 mag, K = 9.50 mag) to investigate its nature. We de-redden the star to place it onto the main sequence in the model isochrones by Girardi et al. (2002). With our applied extinction law we require 0.78 mag of K-band extinction. This agrees well with the minimum reddening found for the cluster stars (AK = 0.8 mag) and thus places the HII region at the same distance as the cluster. Using the cluster distance, reddening and apparent magnitudes, we thus find that the central star of the HII region has about 20 solar masses, similar to the brightest cluster members. Hence its spectral type is about O9 or B0.
Given the properties of the central star, we can clearly infer that the object is miss-classified as planetary nebula and indeed an HII region.
4 Conclusions
We investigate the nature of the young embedded cluster Mercer 14 utilising near infrared JHK photometry from the UKIDSS GPS and narrow-band imaging data obtained as part of the UWISH2 survey. The cluster shows clear signs of currently ongoing star formation, indicated by several detected molecular hydrogen outflows. Mid-infrared Spitzer data reveals that there are still substantial amounts of gas and dust within, or in very close proximity to the cluster. We identify at least five molecular outflows driven by young, partly deeply embedded sources in the northern half of the cluster.
We estimate the distance of Mercer 14 by star counts of blue foreground objects to its parental molecular cloud and a comparison to the Besancon Galaxy model. We furthermore use the cluster photometric decontamination algorithm to determine the number of possible foreground stars per unit area towards the cluster. Both methods result in a distance estimate of 2.5 0.3 kpc. This puts the cluster at about the same distance as the massive star forming G 35.2 N (distance of 2.3 kpc), and hence suggests a physical relation of the two regions. The distance estimation based of the decontaminated cluster photometry hence has an uncertainty of about 10 %. Potentially this method can be used to determine the distance for a range of young, embedded clusters.
We perform isochrone fitting in the decontaminated colour-colour and colour-magnitude diagrams to estimate the cluster parameter. The minimum extinction to the cluster stars is AK = 0.8 mag, with a differential extinction of the same order of magnitude. The colours and magnitudes of the brightest cluster members correspond to 20 solar mass stars. The nearby compact HII region also contains a star of this mass. This suggests a total cluster mass of around 500 M⊙. The content of young massive stars, the detection of currently ongoing star formation indicated by jets and outflows, a large fraction of sources with disks, as well as the high differential reddening caused by remaining gas and dust within the cluster suggests that Mercer 14 is a young (less that 4 Myrs) intermediate mass cluster.
acknowledgments
The United Kingdom Infrared Telescope is operated by the Joint Astronomy Centre on behalf of the Science and Technology Facilities Council of the U.K. The data reported here were obtained as part of the UKIRT Service Program. This research has made use of the WEBDA database, operated at the Institute for Astronomy of the University of Vienna.
References
- A., (2003) Benjamin, R.A., Churchwell, E., Babler, B.L., Bania, T.M., Clemens, D.P., Cohen, M., Dickey, J.M., et al., 2003, PASP, 115, 953
- A., (2003) Bica, E., Dutra, C.M., Soares, J., Barbuy, B., 2003, A&A, 404, 223
- A., (2007) Bonatto, C.; Bica, E.; 2007, MNRAS, 377, 1301
- A., (2007) Casali, M., Adamson, A., Alves de Oliveira, C., Almaini, O., Burch, K., Chuter, T., Elliot, J., et al., 2007, A&A, 467, 777
- A., (2008) Cyganowski, C.J.; Whitney, B.A.; Holden, E.; Braden, E.; Brogan, C.L.; Churchwell, E.; Indebetouw, R.; Watson, D.F.; et al.; 2008, AJ, 136, 2391
- A., (2010) Davis, C. J.; Gell, R.; Khanzadyan, T.; Smith, M. D.; Jenness, T., 2010, A&A, 511, 24
- A., (2005) Drew, J.E., Greimel, R., Irwin, M.J., Aungwerojwit, A., Barlow, M.J., Corradi, R.L.M., Drake, J.J., et al., 2005, MNRAS, 362, 752
- A., (2006) Dye, S., Warren, S.J., Hambly, N.C., Cross, N.J.G., Hodgkin, S.T., Irwin, M.J., Lawrence, A., et al., 2006, MNRAS, 372, 1227
- A., (2011) Froebrich, D.; Davis, C. J.; Ioannidis, G.; Gledhill, T. M.; Takami, M.; Chrysostomou, A.; Drew, J.; Eislöffel, J.; et al.; 2011, MNRAS, 413, 480
- A., (2010) Froebrich, D.; Schmeja, S.; Samuel, D.; Lucas, P. W.; 2010, MNRAS, 409, 1281
- A., (2007) Froebrich, D., Scholz, A., Raftery, C.L. 2007, MNRAS, 374, 399
- A., (2002) Girardi, L., Bertelli, G., Bressan, A., et al. 2002, A&A, 391, 195
- A., (2008) Hambly, N.C., Collins, R.S., Cross, N.J.G., Mann, R.G., Read, M.A., Sutorius, E.T.W., Bond, I., et al., 2008, MNRAS, 384, 637
- A., (2009) Hodgkin, S.T., Irwin, M.J., Hewett, P.C., Warren, S.J., 2009, MNRAS, 394, 675
- A., (2003) Lada, C.J., Lada, E.A., 2003, ARA&A, 41, 57
- A., (2007) Lawrence A., Warren, S.J., Almaini, O., Edge, A.C., Hambly, N.C., Jameson, R.F., Lucas, P.W., et al., 2007, MNRAS, 379, 1599
- A., (2008) Lucas, P. W.; Hoare, M. G.; Longmore, A.; Schröder, A. C.; Davis, C. J.; Adamson, A.; Bandyopadhyay, R. M.; de Grijs, R.; et al.; 2008, MNRAS, 391, 1281
- A., (1990) Mathis, J.S. 1990, ARA&A, 28, 37
- A., (2005) Mercer, E.P.; Clemens, D.P.; Meade, M.R.; Babler, B.L.; Indebetouw, R.; Whitney, B.A.; Watson, C.; Wolfire, M.G.; et al.; 2005, ApJ, 635, 560
- A., (2003) Robin, A.C.; Reylé, C.; Derrière, S.; Picaud, S.; 2003, A&A, 409, 523
- A., (2009) Rowles, J. & Froebrich, D. 2009, MNRAS, 395, 1640
- A., (2010) Scholz, A.; Froebrich, D.; Davis, C.J.; Meusinger, H.; 2010, MNRAS, 406, 505
- A., (2006) Skrutskie, M.F., Cutri, R.M., Stiening, R., Weinberg, M.D., Schneider, S., Carpenter, J.M., Beichman, C., et al., 2006, AJ, 131, 1163
- A., (2011) Urquhart, J. S.; Moore, T. J. T.; Hoare, M. G.; Lumsden, S. L.; Oudmaijer, R. D.; Rathborne, J. M.; Mottram, J. C.; Davies, B.; et al.; 2011, MNRAS, 410, 1237
- A., (2006) Weidner, C.; Kroupa, P.; 2006, MNRAS, 365, 1333
Appendix A Detailed images of H2 flows