![[Uncaptioned image]](/html/1108.2446/assets/x1.png)
Dynamics in Young Star Clusters: From Planets to Massive Stars
C. Olczak1,2,3,
R. Spurzem3,1,
Th. Henning2,
T. Kaczmarek4,
S. Pfalzner4,
S. Harfst5,
and
S. Portegies Zwart6
1
Astronomisches Rechen-Institut (ARI), Zentrum für Astronomie Universität Heidelberg, Mönchhofstrasse 12-14, 69120 Heidelberg, Germany
2 Max-Planck-Institut für Astronomie (MPIA), Königstuhl 17, 69117 Heidelberg, Germany
3 National Astronomical Observatories of China, Chinese Academy of Sciences (NAOC/CAS), 20A Datun Lu, Chaoyang District, Beijing 100012, China
4 Max-Planck-Institut für Radioastronomie, Auf dem Hügel 7, 53121 Bonn, Germany
5 Technische Universität Berlin, Zentrum für Astronomie und Astrophysik, Hardenbergstraße 36, 10623 Berlin, Germany
6 Sterrewacht Leiden, Leiden University, Postbus 9513, 2300 RA Leiden, The Netherlands
Abstract
The young star clusters we observe today are the building blocks of a new generation of stars and planets in our Galaxy and beyond. Despite their fundamental role we still lack knowledge about the conditions under which star clusters form and the impact of these often harsh environments on the evolution of their stellar and substellar members.
We demonstrate the vital role numerical simulations play to uncover both key issues. Using dynamical models of different star cluster environments we show the variety of effects stellar interactions potentially have. Moreover, our significantly improved measure of mass segregation reveals that it can occur rapidly even for star clusters without substructure. This finding is a critical step to resolve the controversial debate on mass segregation in young star clusters and provides strong constraints on their initial conditions.
1 Introduction
According to current knowledge, planetary systems form from the accretion discs around young stars. These young stars are in most cases not isolated, but are part of a cluster (e.g. Lada & Lada, 2003; Evans et al., 2009). Densities in these cluster environments vary considerably, spanning a range of 10 pc-3 (e.g. Chameleontis) to pc-3 (e.g. Arches Cluster). Though it is known that discs disperse on a time-scale of 1-10 Myr (Haisch et al., 2001; Hillenbrand, 2002; Sicilia-Aguilar et al., 2006; Currie et al., 2008) and that in dense clusters ( pc-3) the disc frequency seems to be lower in the core (e.g. Balog et al., 2007), it is an open question as to how far interactions with the surrounding stars influence the planet formation in clusters of different densities. An encounter between a circumstellar disc and a nearby passing star can lead to a significant loss of mass and angular momentum from the disc. While such isolated encounters have been studied in a large variety (Heller, 1993; Clarke & Pringle, 1993; Ostriker, 1994; Heller, 1995; Hall et al., 1996; Hall, 1997; Pfalzner, 2004; Pfalzner et al., 2005; Moeckel & Bally, 2006, 2007; Kley et al., 2008), only a few numerical studies have directly investigated the effect of stellar encounters on circumstellar discs in a dense cluster environment (Scally & Clarke, 2001; Adams et al., 2006).
The dynamical evolution of a star cluster leaves a variety of imprints in the phase space of its stellar population which are good tracers of the dynamical age of the cluster. One of the most widely discussed aspects is that of mass segregation. Due to energy equipartition – hence via two-body encounters – the more massive particles tend to settle towards the cluster centre over time while the lower-mass particles are preferentially pushed to the outer parts (Spitzer, 1969; Farouki et al., 1983; Spurzem & Takahashi, 1995; Khalisi et al., 2007). However, it is a much more challenging task to identify mass segregation observationally in real objects than theoretically from ‘clean’ numerical simulations. The investigation of mass segregation in young stellar systems is of particular interest for a deeper understanding of the star formation process.
2 Star-Disc Encounters in Young Star Clusters
2.1 Method
We follow the idea of Scally & Clarke (2001), combining a simulation of the dynamics of a cluster to determine the interaction parameters of close encounters between stars in the cluster with results from studies of isolated star-disc encounter simulations. Throughout this work we assume that initially all stars are surrounded by protoplanetary discs. This is justified by observations that reveal disc fractions of nearly 100 % in very young star clusters (e.g. Haisch et al., 2000; Lada et al., 2000; Haisch et al., 2001; Hillenbrand, 2005).
The dynamical cluster models contain only single stellar components without considering embedded gas. The simulations were performed with nbody6++, nbody6-gpu (Spurzem, 1999; Aarseth, 2003, 2008), and starlab (McMillan, 1996; Portegies Zwart et al., 2001; Hut, 2003). The details of the numerics can be found in (Olczak et al., 2006, 2011, in prep).
The encounter-induced transport of mass and angular momentum in protoplanetary discs is calculated via fit formulae based on simulations of star-disc encounters (Olczak et al., 2006; Pfalzner et al., 2006; Pfalzner & Olczak, 2007). These quantify upper limits due to the restriction to low-mass discs and co-planar, prograde, and parabolic orbits, which are the most perturbing. A simplified prescription terms stars that have lost more than 90 % of their initial disc mass as “discless”. The results presented here apply to a scenario where all stars have initially a disc size of 150 AU. A lerger range of models has been investigated in the cited publications.
2.2 Results
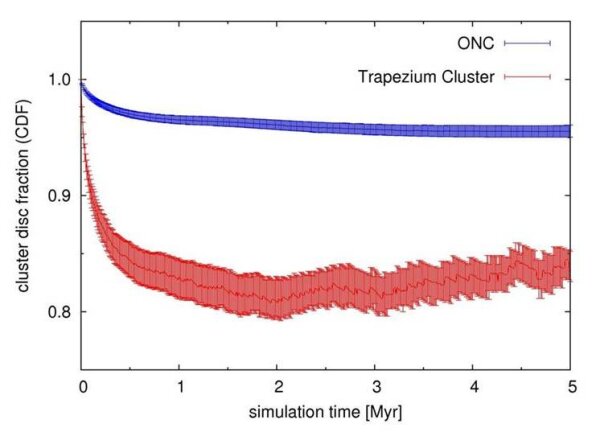
From a numerical model of the Orion Nebula Cluster (ONC) we demonstrate that the encounter-induced disc-mass loss becomes significant in its dense core, known as the “Trapezium Cluster” (Fig. 1, left). Up to 20 % of the discs can be destroyed by gravitational interactions within a radius of 0.3 pc (compared to 5 % in the entire cluster of 2.5 pc radius).
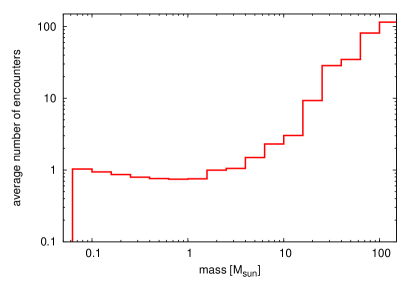
The massive stars in the centre of such a stellar cluster act as gravitational foci for the lower mass stars (Pfalzner et al., 2006). This becomes evident from the average number of encounters as a function of stellar mass (Fig. 1, right): the number of disc-perturbing interactions is nearly constant for low- and intermediate-mass stars but increases largely for high-mass stars. Because discs are most affected when the masses of the interacting stars are unequal (Olczak et al., 2006; Moeckel & Bally, 2007) massive stars dominate the encounter-induced disc-mass loss in star clusters like the ONC. For low-mass stars the mass-loss occurs through few strong encounter events, whereas the disc of high-mass stars is removed via a steady nibbling by many encounters with stars of lower mass.
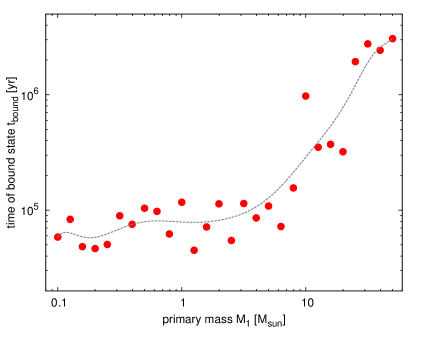
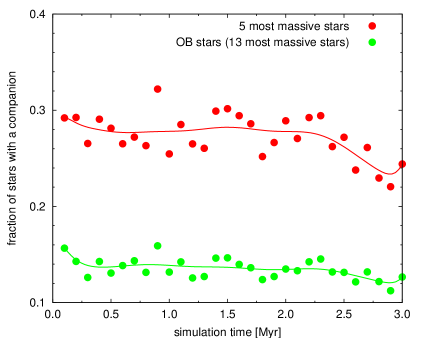
The dynamically outstanding role of high-mass stars does also affect the stellar multiplicity in the ONC. It turns out that the most massive star () has on average of the order of 200 so-called “capturing encounters” – encounter events with an eccentricity 1 – in the first 5 Myr while a star with has less than one. These interactions lead to the formation of relatively stable configurations termed as “transient bound systems” (TBS). The left plot in Fig. 2 shows a striking increase of towards more massive stars by more than one order of magnitude. These TBS translate directly into an observed apparent binarity (Fig. 2, right): of the five most massive stars in the ONC on average 30 % would appear the be in a binary system at the cluster’s current age of 1 Myr. The average for all 13 OB stars in the ONC would be more than 10 %.
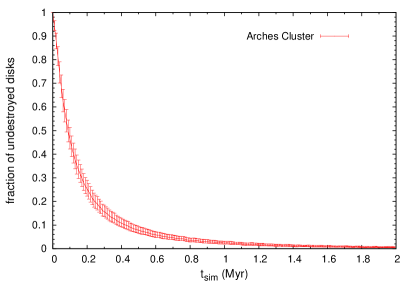
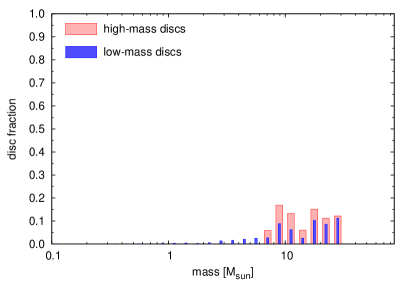
The encounter-induced disc-mass loss becomes much more apparent in more extreme environments. Using a numerical model of the Arches cluster, one of the densest and most massive clusters in our Milky Way (Figer et al., 2002; Stolte et al., 2005), we find that at its current age of 2.5 Myr (Najarro et al., 2004; Martins et al., 2008) nearly all circumstellar discs could have been destroyed just due to gravitational interactions (Fig. 3, left). A striking result is that the low fraction of members that could retain their discs to some degree at an age of 2 Myr is populated by stars with masses between 2 M⊙ and 30 M⊙ (Fig. 3, right).
3 Mass Segregation in Young Star Clusters
3.1 Method
As a proxy for mass segregation we extend the method developed by Allison et al. (2009) (see also Cartwright & Whitworth, 2004; Schmeja & Klessen, 2006). In summary, the authors use the minimum spanning tree (MST), the graph which connects all vertices within a given sample with the lowest possible sum of edges and no closed loops (Gower & Ross, 1969). The length of the MST, , is a measure of the concentration or compactness of a given sample of vertices. Mass segregation of a stellar system of size is quantified by comparing of the most massive stars, , with the average of sets of random cluster stars, , and its standard deviation, .
Our method involves a crucial modification of that boosts its sensitivity: we do not use directly the sum of the edges as a measure yet their geometric mean ,
| (1) |
and its associated geometric standard deviation , where are the MST edges. We obtain the new measure via a proper normalisation:
| (2) |
The geometrical mean acts as an intermediate-pass that damps contributions from extreme edge lengths very effectively, hence significantly reduces the contribution of any “outlier”.
3.2 Results
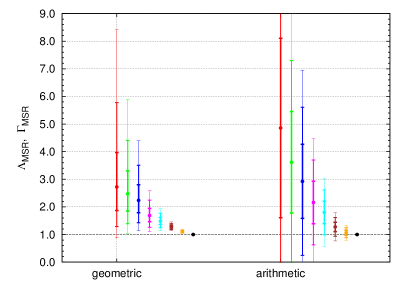
Using the method of Šubr et al. (2008) we have created initially mass-segregated star clusters to verify our algorithm. In the left plot of Fig. 4 we compare our improved measure (“geometric”) with (“arithmetic”). We find that our measure of mass segregation, , detects an intermediate degree of mass segregation, , with at least significance while provides only a very weak significance.
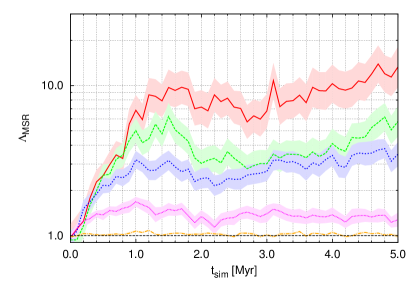
We have used this highly improved sensitivity to follow the dynamical mass segregation of a numerical star cluster model. The initial configuration is based on our ONC model as described in previous publications (e.g. Olczak et al., 2010). Note that we use a spherically symmetric model with a smooth density distribution without any substructure. However, our stellar system is initially collapsing, starting from a virial ratio . The simulations were carried out until a physical age of 5 Myr, corresponding to 13.5 N-body time units. On the right-hand side of Fig. 4 we see that increases rapidly within the first 2 Myr (or 5.5 N-body time units) and then saturates. The different mass groups are clearly separated, inversely correlated with the sample size.
4 Discussion and Conclusions
From numerical simulations of star cluster dynamics and star-disc encounters we find that pure gravitational interactions of disc-surrounded stars can lead to a significant depletion of their circumstellar matter. The disc-mass loss increases with cluster density but remains unaffected by the size of the stellar population. In moderately dense clusters like the ONC it is the massive stars that dominate the encounter-induced disc-mass loss by gravitational focusing of low-mass stars.
Massive stars have a much higher probability to be involved in a capturing encounter in such a cluster environment than solar-mass stars. In the ONC at least 10 % of the OB stars form a (transient) bound state due to dynamical capture that would be observed as a binary. The properties of the these systems strongly depend on the cluster age with a development towards smaller periastra, higher mass ratios and longer duration of the bound states.
In extreme environments like the Arches cluster the pairwise interaction of all stars leads nearly to a complete destruction of the entire disc population. The preferential survivability of discs around B-type stars in the Arches cluster implies that these could be the best candidates for detecting planetary systems in Galactic starburst clusters.
We have developed a significantly improved method to measure mass segregation based on the minimum spanning tree (MST). In general, using only the ten to twenty most massive stars provides a robust and sensitive measure of mass segregation for the entire population of star clusters in our Galaxy. In particular, very low degrees of mass segregation can be detected in massive clusters like NGC 3603 that consist of 10k or more stars.
We note that mass segregation in a collapsing, intermediate-size stellar cluster of 1k stars can occur very quickly, i.e. within only a few crossing times. This finding demonstrates that rapid mass segregation (in terms of dynamical time scale) does not require substructure.
Acknowledgments
CO and RS acknowledge support by NAOC CAS through the Silk Road Project, and by Global Networks and Mobility Program of the University of Heidelberg (ZUK 49/1 TP14.8 Spurzem). CO appreciates funding by the German Research Foundation (DFG), grant OL 350/1-1. RS is funded by the Chinese Academy of Sciences Visiting Professorship for Senior International Scientists, Grant Number 2009S1-5. We have partly used the special supercomputers at the Center of Information and Computing at National Astronomical Observatories, Chinese Academy of Sciences, funded by Ministry of Finance of People’s Republic of China under the grant ZDY Z2008−2.
We thank S. Aarseth for providing the highly sophisticated N-body code nbody6 (and its GPU extension) and greatly appreciate his support.
References
- Aarseth (2003) Aarseth, S. 2003, Gravitational N-body Simulations (Cambridge, Cambridge University Press, 2003, 430 p.)
- Aarseth (2008) Aarseth, S. J. 2008, in Lecture Notes in Physics, Berlin Springer Verlag, Vol. 760, Lecture Notes in Physics, Berlin Springer Verlag, ed. S. J. Aarseth, C. A. Tout, & R. A. Mardling, 1–4020
- Adams et al. (2006) Adams, F. C., Proszkow, E. M., Fatuzzo, M., & Myers, P. C. 2006, apj, 641, 504
- Allison et al. (2009) Allison, R. J., Goodwin, S. P., Parker, R. J., et al. 2009, mnras, 395, 1449
- Balog et al. (2007) Balog, Z., Muzerolle, J., Rieke, G. H., et al. 2007, apj, 660, 1532
- Cartwright & Whitworth (2004) Cartwright, A. & Whitworth, A. P. 2004, mnras, 348, 589
- Clarke & Pringle (1993) Clarke, C. J. & Pringle, J. E. 1993, mnras, 261, 190
- Currie et al. (2008) Currie, T., Kenyon, S. J., Balog, Z., et al. 2008, apj, 672, 558
- Evans et al. (2009) Evans, N. J., Dunham, M. M., Jørgensen, J. K., et al. 2009, apjs, 181, 321
- Farouki et al. (1983) Farouki, R. T., Hoffman, G. L., & Salpeter, E. E. 1983, apj, 271, 11
- Figer et al. (2002) Figer, D. F., Najarro, F., Gilmore, D., et al. 2002, apj, 581, 258
- Gower & Ross (1969) Gower, J. C. & Ross, G. J. S. 1969, Journal of the Royal Statistical Society. Series C (Applied Statistics), 18, pp. 54
- Haisch et al. (2000) Haisch, K. E., Lada, E. A., & Lada, C. J. 2000, aj, 120, 1396
- Haisch et al. (2001) Haisch, Jr., K. E., Lada, E. A., & Lada, C. J. 2001, apjl, 553, L153
- Hall (1997) Hall, S. M. 1997, mnras, 287, 148
- Hall et al. (1996) Hall, S. M., Clarke, C. J., & Pringle, J. E. 1996, mnras, 278, 303
- Heller (1993) Heller, C. H. 1993, apj, 408, 337
- Heller (1995) Heller, C. H. 1995, apj, 455, 252
- Hillenbrand (2002) Hillenbrand, L. A. 2002, ArXiv Astrophysics e-prints
- Hillenbrand (2005) Hillenbrand, L. A. 2005, ArXiv Astrophysics e-prints
- Hut (2003) Hut, P. 2003, in IAU Symposium, Vol. 208, Astrophysical Supercomputing using Particle Simulations, ed. J. Makino & P. Hut, 331–+
- Khalisi et al. (2007) Khalisi, E., Amaro-Seoane, P., & Spurzem, R. 2007, mnras, 374, 703
- Kley et al. (2008) Kley, W., Papaloizou, J. C. B., & Ogilvie, G. I. 2008, aap, 487, 671
- Lada & Lada (2003) Lada, C. J. & Lada, E. A. 2003, araa, 41, 57
- Lada et al. (2000) Lada, C. J., Muench, A. A., Haisch, Jr., K. E., et al. 2000, aj, 120, 3162
- Martins et al. (2008) Martins, F., Hillier, D. J., Paumard, T., et al. 2008, aap, 478, 219
- McMillan (1996) McMillan, S. L. W. 1996, in Astronomical Society of the Pacific Conference Series, Vol. 90, The Origins, Evolution, and Destinies of Binary Stars in Clusters, ed. E. F. Milone & J.-C. Mermilliod, 413–+
- Moeckel & Bally (2006) Moeckel, N. & Bally, J. 2006, apj, 653, 437
- Moeckel & Bally (2007) Moeckel, N. & Bally, J. 2007, apj, 656, 275
- Najarro et al. (2004) Najarro, F., Figer, D. F., Hillier, D. J., & Kudritzki, R. P. 2004, apjl, 611, L105
- Olczak et al. (2010) Olczak, C., Pfalzner, S., & Eckart, A. 2010, aap, 509, A260000+
- Olczak et al. (2006) Olczak, C., Pfalzner, S., & Spurzem, R. 2006, apj, 642, 1140
- Ostriker (1994) Ostriker, E. C. 1994, apj, 424, 292
- Pfalzner (2004) Pfalzner, S. 2004, apj, 602, 356
- Pfalzner & Olczak (2007) Pfalzner, S. & Olczak, C. 2007, aap, 462, 193
- Pfalzner et al. (2006) Pfalzner, S., Olczak, C., & Eckart, A. 2006, aap, 454, 811
- Pfalzner et al. (2005) Pfalzner, S., Umbreit, S., & Henning, T. 2005, apj, 629, 526
- Portegies Zwart et al. (2001) Portegies Zwart, S. F., McMillan, S. L. W., Hut, P., & Makino, J. 2001, mnras, 321, 199
- Scally & Clarke (2001) Scally, A. & Clarke, C. 2001, mnras, 325, 449
- Schmeja & Klessen (2006) Schmeja, S. & Klessen, R. S. 2006, aap, 449, 151
- Sicilia-Aguilar et al. (2006) Sicilia-Aguilar, A., Hartmann, L., Calvet, N., et al. 2006, apj, 638, 897
- Spitzer (1969) Spitzer, L. J. 1969, apjl, 158, L139+
- Spurzem (1999) Spurzem, R. 1999, Journal of Computational and Applied Mathematics, 109, 407
- Spurzem & Takahashi (1995) Spurzem, R. & Takahashi, K. 1995, mnras, 272, 772
- Stolte et al. (2005) Stolte, A., Brandner, W., Grebel, E. K., Lenzen, R., & Lagrange, A.-M. 2005, apjl, 628, L113
- Šubr et al. (2008) Šubr, L., Kroupa, P., & Baumgardt, H. 2008, mnras, 385, 1673