A Comparison of Stripe Modulations in La1.875Ba0.125CuO4 and La1.48Nd0.4Sr0.12CuO4
Abstract
We report combined soft and hard x-ray scattering studies of the electronic and lattice modulations associated with stripe order in La1.875Ba0.125CuO4 and La1.48Nd0.4Sr0.12CuO4. We find that the amplitude of both the electronic modulation of the hole density and the strain modulation of the lattice is significantly larger in La1.875Ba0.125CuO4 than in La1.48Nd0.4Sr0.12CuO4 and is also better correlated. The in-plane correlation lengths are isotropic in each case; for La1.875Ba0.125CuO4, Å whereas for La1.48Nd0.4Sr0.12CuO4, Å. We find that the modulations are temperature independent in La1.875Ba0.125CuO4 in the low temperature tetragonal phase. In contrast, in La1.48Nd0.4Sr0.12CuO4, the amplitude grows smoothly from zero, beginning 13 K below the LTT phase transition. We speculate that the reduced average tilt angle in La1.875Ba0.125CuO4 results in reduced charge localization and incoherent pinning, leading to the longer correlation length and enhanced periodic modulation amplitude.
pacs:
71.30.+h, 61.10.Nz, 71.27.+aOne dimensional modulations of the lattice and of the charge and spin density appear to be both ubiquitous in the cuprates and intimately tied up with the physics of these materials. For example, superconducting phase coherence is suppressed in systems in which charge and spin stripes are staticTranquada et al. (1997); Moodenbaugh et al. (1988); Fujita et al. (2004) while dynamic stripes may promote pairingKivelson et al. (1998); Emery et al. (1997). Further, stripe order coexists with 2D superconducting correlations above the bulk superconducting phaseLi et al. (2007); Tranquada et al. (2008) and indeed it has been argued that broken rotational symmetry may be a defining feature of the pseudogap phase - so-called “nematic” electronic order, a viewpoint for which there is some evidenceLawler et al. (2010); Daou et al. (2010) . Understanding these modulations is therefore a prerequisite to gaining a detailed knowledge of the physics of the cuprates.
In their full incarnation, these density waves - “stripes” - consist of three concomitant modulations; of the spin density, of the charge density and of the lattice itself. In a few cases, namely La2-xBaxCuO4Fujita et al. (2004); Abbamonte et al. (2005); Kim et al. (2008); Tranquada et al. (2008); Hücker et al. (2011) and (La,R)2-xSrxCuO4, where R=NdTranquada et al. (1995), or Eu Fink et al. (2009, 2011) , these modulations are stabilized by the symmetry of the low temperature crystal structure to form static structures. It is here, where the respective order parameters are well developed, that one can best characterize them. The basics of the static structures are known: they are comprised of hole-rich anti-phase antiferromagnetic domain walls running along the Cu-O bond direction. In real space the spin density then has twice the wavelength of the charge and lattice modulations, and in a scattering experiment, these give rise to satellites at (,,0) and (,0,0.5), and symmetry related positions, respectively. However, basic questions such as the relative amplitudes in the different compounds and the coupling between these modulations remain unanswered.
Here we report a combined soft and hard x-ray scattering study of the low temperature stripe order in La1.875Ba0.125CuO4 (LBCO) and La1.48Nd0.4Sr0.12CuO4 (LNSCO). In particular, soft x-ray scattering at the pre-edge of the O K-edge (529.3 eV) probes the spatial variation of the oxygen partial density of states at the Fermi level, which is related to the mobile charge carrier densityChen et al. (1991); Romberg et al. (1990); Abbamonte et al. (2005), while hard x-ray (11.3 keV) scattering probes the associated lattice distortion. We find that the stripe correlation lengths are isotropic in the Cu-O plane in both systems, but LBCO is a factor of two better correlated. Further, by careful normalization to structural Bragg peaks we are able to quantify the relative size of the electronic modulation and the lattice distortion in these two cases. We find that the amplitude of the electronic modulation is times larger in LBCO than in LNSCO, while the lattice distortion is only times larger. We further find that the modulations are temperature independent in LBCO once the LTT phase is entered, suggesting that perhaps the intrinsic ordering temperature is significantly higher. In contrast, in LNSCO, the amplitude grows smoothly from zero, beginning 13 K below the LTT phase transition.
Samples of both LBCO and LNSCO were grown using the floating zone method, at Brookhaven National Laboratory, USA and the University of Tokyo, Japan respectively. Both samples proved to be of high crystal quality, with mosaic spreads of measured at 11.3 keV. Throughout this paper both systems are indexed with the high temperature tetragonal (HTT) (I4/mmm) unit cell.
Soft x-ray diffraction experiments were carried out on the X1A2 beamline at the NSLS, Brookhaven National Laboratory, USA using a six-circle in-vacuum diffractometer. The samples were cleaved ex-situ to reveal surfaces with a surface normal and mounted such that the and directions lay in the scattering plane. Experiments were performed in a vertical scattering geometry with -incident x-rays, i.e. the electric field of the incident x-ray photons was always along the HTT -axis, within the CuO2 planes. The samples were cooled in a He flow cryostat to a base temperature of 12 K. Scattered x-rays were detected with an in-vacuum CCD. During the measurements the beam footprint was smaller than the sample. Data were collected by performing a scan, collecting a single CCD image at each datum. Each CCD image was then converted to reciprocal space coordinates and binned onto a regular grid Partzsch and Wilkins . Part of the soft x-ray experiments were performed at BESSY with a diffractometer described in Ref. Fink et al., 2009.
Hard x-ray diffraction experiments on the same samples were conducted on beamline X22C at the NSLS. The incident photon energy was 11.3 keV and scattered x-rays were detected by means of a point-detector, with the resolution defined by slits. Experiments were conducted in a vertical scattering geometry, with the and directions lying in the scattering plane. For both LBCO and LNSCO the instrumental resolution was identical.
We first discuss the characterization of the electronic modulation, beginning with LBCO. In Fig. 1 we show cuts through reciprocal space in the HK- (bottom) and HL- planes (top) for LBCO. These data were taken with Ei=529.3 eV, an energy corresponding to the Mobile Carrier Peak (MCP) in the oxygen K-edge absorptionChen et al. (1991). At this energy the scattering from the charge stripes is maximizedAbbamonte et al. (2005). We extract a correlation length from these data by taking line cuts through the three dimensional grid and fitting to Lorentzian-squared lineshapes. We find that the stripe correlations within the - plane are isotropic with Å, where . Measurements at the Cu L3 edge revealed a similar correlation length. We note that because of the superior resolution of the present set up, this represents the highest precision measurement to date of this correlation length. It is consistent with previous work which found Å at this energyAbbamonte et al. (2005). As has been previously observed, the stripes are weakly correlated in the -axis direction, giving rise to the uniform streak of intensity along in Fig. 1.
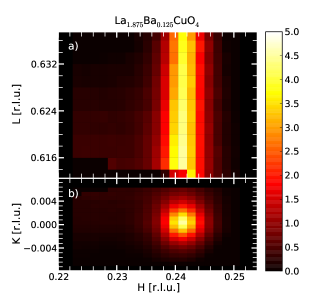
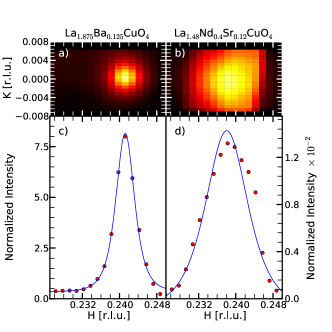
Figure 2 shows a comparison in the HK- plane, along with line cuts along the H direction, between LBCO and LNSCO. Immediately apparent is the far poorer correlation length in LNSCO, where we find that the correlation length is again isotropic but in this case Å.
In both cases, the wavevector in the H direction, is 0.24 r.l.u. and is therefore incommensurate. These measurements were performed using an orientation matrix defined in-situ by the and Bragg reflections, and as such their values are reported with high confidence. Previous studies have found similar incommensurabilities at these dopings (see e.g. Refs. Abbamonte et al., 2005; Hücker et al., 2011; Tranquada et al., 1996). We return to this point later.
The result that the charge stripes display isotropic correlation lengths is perhaps surprising given that the stripes in a single CuO2 layer are highly anisotropic. While four-fold rotational symmetry is recovered when averaging over the whole crystal, since successive sheets along the c-axis are rotated by 90∘ with respect to each other, these present experiments only observe charge stripes with a propagation wavevector along one direction in reciprocal space - by virtue of the diffraction condition. There is therefore no a priori reason to expect these correlations to be isotropic. One possible explanation is that nearest-neighbor c-axis correlations couple the charge stripe correlations on alternating layers. It has been suggested, for example, that such inter-layer coupling could occur between the 1D metallic behavior of a stripe and the -vector in the neighboring stripeEmery et al. (1997). Unfortunately, from our diffraction measurements it is not possible to say anything about nearest-neighbor c-axis coupling due to the 90∘ rotation of the stripes. A second possibility is that the isotropy is driven by poorly screened (long range) Coulomb interactions, as has been suggested in the context of a ladder compoundRusydi et al. (2006). Finally, and most prosaically, it is possible that the charge stripe correlations are limited by intrinsic crystallographic disorder, for example due to defects arising from randomly distributed dopant ionsRodriguez-Martinez and Attfield (1996). As such order is random, one would expect it to be isotropic, and that it would therefore cause an isotropic correlation length. We will return to the role of crystallographic order again shortly in the discussion of modulation amplitudes.
We are also able to compare the peak intensities in the two systems. To do so, the intensities shown in Fig. 2 have been normalized to the integrated intensity of the respective Bragg reflections (measured at 1 keV) and corrected for their different structure factors. The integrated intensity, , of a superlattice reflection is proportional to the product of the peak intensity and the widths in three orthogonal directions, . As discussed, , and we make the assumption that the correlation lengths along L are equal in the two materials. The ratio of integrated intensities is then . Calculating from the data presented in Table 1 we find that the ratio of integrated intensities, corrected for all experimental factors is , i.e. the electronic charge stripe modulation in LBCO is times larger in amplitude than in LNSCO.
This factor of almost 10 is a surprisingly large number. Taken at face value it implies a very large difference in the value of the charge order parameter in these two systems and appears to contradict expectations based on measurements of the ordered magnetic moments in the two systems. SR measurements, for example, show similar ordered moments of 0.3 with similarly large magnetically-ordered volume fractions in LBCO and LNSCONachumi et al. (1998). Since the magnetic order is constrained by the charge order, it would seem counterintuitive for the charge order parameters to be so different when the magnetic order parameters are so similar. Further, a recent estimate of the hole concentration per Cu site in the charge carrier stripes in La1.675Eu0.2Sr0.125CuO4 (LESCO) resulted in a value considerably larger than 0.2 holesFink et al. (2009). Based on the similarity of LESCO and LNSCO, in terms of correlation length and temperature dependence, once might expect LESCO and LNSCO to have similar hole modulations. Such an expectation is then, at first glance, inconsistent with the present measurement, which suggests LBCO is 10 times larger, which would be an unphysical result. However, the LESCO estimate came from an analysis of the resonant lineshape, which reflects the amplitude of the modulation in the modulated regions and there are a number of reasons why a measurement based on the diffraction signal could lead to a different result. Firstly, the ordered volume of sample could be different for LBCO and LNSCO, with LNSCOhaving an ordered volume up to 100 times smaller than that of LBCO. This seems extremely unlikely. A second possibility is that these diffraction measurements do not fully capture all the intensity of the stripe correlations and that in LNSCO there is significant intensity outside the detected region in reciprocal space - i.e. in diffuse tails. Missing this intensity would result in a much reduced measured hole amplitude in LNSCO compared with LBCO. This effect would not be reflected in resonant lineshape analysis. Such an explanation is perhaps consistent with the fact that the charge stripes are more poorly correlated in LNSCO as compared to LBCO. At this point, it is not possible to know which, if any, of these explanations is the correct one.
| Center | HWHM | Peak | ||
|---|---|---|---|---|
| [r.l.u.] | [r.l.u.] | Intensity | ||
| LBCO | 529.3 eV | 0.241 | ||
| LNSCO | 529.3 eV | 0.238 | ||
| LBCO | 11.3 keV | - | ||
| LNSCO | 11.3 keV | - |
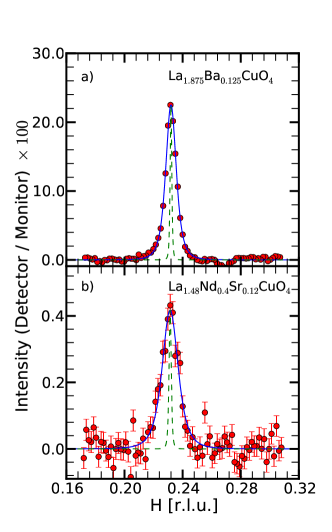
We next discuss the lattice modulation that is concomitant with the electronic modulation, as measured with hard x-rays. In Fig. 3, we show scans performed with Ei=11.3 keV through the (0.24,0,11.5) charge stripe wavevector. We have again normalized the scattered intensity by a nearby Bragg peak, in this case the . Due to the poorer experimental resolution of the hard x-ray measurements, it is necessary to deconvolve the experimental resolution. This latter was determined from the reflection. As an upper bound on the resolution, we took the sharpest of the LBCO and LNSCO reflections. After deconvolving the instrumental resolution we find Å and Å. Comparing the widths of the stripe peaks as measured with soft and hard x-rays, we find that the widths are equal within experimental error for the two x-ray energies in both LBCO and LNSCO.
From the hard x-ray deconvolved width and the peak intensity, we can calculate the ratio of the lattice modulations for the two systems following the same arguments as before. We find that the ratio of the integrated intensities of the lattice modulations is , i.e. the lattice modulation amplitude is times larger in LBCO than in LNSCO.
Before we turn to a discussion of the significance of these results, we present the temperature dependence of the respective modulations, and of the LTT phase, for the two systems (Fig. 4). For soft x-rays, the latter is measured through the forbidden reflection, observable only in the LTT phase at eVFink et al. (2011). For hard x-rays, the reflection, observable only in the LTT phase is used. In the case of the superlattice modulations, the integrated intensity of the reflection is taken to be . This is consistent with two dimensional stripes, where the -axis dependence of the scattering is dominated by the structure factor due to the very short correlation lengthvon Zimmermann et al. (1998).
There are several important things to note from this plot. First, for LBCO it is clear that an observable peak is visible (both the strain modulation and the charge density modulation) only within the LTT phase. In addition, the integrated intensity is constant, within experimental error, for both the electronic and structural modulations. This demonstrates that the amplitudes of both these modulations are constant up to the LTT transition temperature, that is the order parameter is not changing, only the correlation length. This suggests that had the LTT transition occurred at a higher temperature in LBCO then it is likely that both the electronic and structural modulations would also have persisted to higher temperatures.
In contrast, for LNSCO (Fig. 4b) the amplitude decays upon warming and is unobservable above =55 K, well below the LTT transition at =68 K. This behavior is reminiscent of recent results in La1.8Eu0.2-xSrxCuO4 which has an even larger difference between and of KFink et al. (2009, 2011).
Finally, it is worth noting that the temperature dependence of the LTT-peaks are identical in both samples when measured at 11.3 keV and 530 eV, demonstrating that the soft x-rays are probing the same bulk-like behavior as the hard x-rays and that the samples are homogeneous.
The results presented above represent the first time these hole and lattice modulations have been characterized in this detail, and as a result, we are able to draw a number of conclusions. First, we address the incommensurability, that is the deviation from the ideal value of at this doping. In LNSCO this was previously attributed to a mixture of two different commensurate stripe spacings Tranquada et al. (1999). A random ordering of these components gave a good match to the spin and lattice incommensurabilities and correlation lengths determined with neutrons. The considerably longer charge and lattice correlation lengths in LBCO compared to LNSCO together with the same incommensurability in the two systems, is not compatible with this random-ordering model. Within a model of two integral stripe spacings, correlated ordering of the two components would be necessary to explain these results.
We now address the differences between LBCO and LNSCO, searching for hints as to the origin of the differences in stripe amplitude. First, the average structures of LBCO and LNSCO are remarkably similarAxe and Crawford (1994); Katano et al. (1993). Secondly, the electron-phonon coupling for the Cu-O bond stretching mode appears to be the sameReznik et al. (2006). Finally, the average A-site cation radius is again very similar: 1.232 Å and 1.211 Å for LBCO and LNSCO respectively Shannon (1976). What then is the origin of the difference in the two systems? Local pinning of stripe domains (as occurs with Zn doping)Kimura et al. (2003) can cause neighboring stripe domains to be out of phase with one another, and destructive interference may limit correlation lengths and average amplitudes. The orthorhombic strains (associated with the octahedral tilts) at temperatures just above the LTT transition are twice as large in LNSCOTranquada et al. (1999) as in LBCOHücker et al. (2011) and are a candidate for the origin of this pinning. Indeed in the ordered phase the LTT tilt angle is larger in LNSCO than in LBCO (4.4∘ compared to 3.5∘, see Ref. Axe and Crawford, 1994) and it has previously been shown that the electronic properties are sensitive to this degree of tilt, with a critical value of below which the electronic properties were unaffectedBuchner et al. (1994). By analogy with perovskite manganitesRadaelli et al. (1996), we may expect that the larger modulations of the Cu-O-Cu bond angles resulting from this tilt will be associated with a greater tendency to localize charge and perturb the stripe modulations, especially in the vicinity of divalent dopant ions. Thus, the reduced average tilt angle in LBCO might explain the longer correlation lengths and enhanced modulation amplitudes of the periodic stripes.
In summary, our comparison shows that the in-plane correlations of the charge stripes in these two systems are isotropic, and a factor of two larger in LBCO. These two systems show different temperature dependences, with the integrated intensity of the charge modulation in LBCO constant up to the LTT transition, while in LNSCO it decreases on warming, disappearing at K, well below the LTT transition in this material. Comparing the amplitudes of the lattice modulation we find that the lattice modulation in LBCO is 4 times stronger than in LNSCO. Performing the same comparison on the electronic modulation suggests that the electronic modulation, as measured by diffraction is 10 times stronger in LBCO when compared with LNSCO. This result, based on measurement of the integrated intensity of the stripe modulation, appears at odds with measurements performed by resonant lineshape analysis. It is clear that further work is required to solve this puzzle, and we hope that this work encourages such measurements.
We gratefully acknowledge D.S. Coburn, W. Leonhardt, W. Schoenig, and S. Wirick for their technical support. Work performed at BNL was supported by the US Department of Energy, Division of Materials Science, under contract No. DE-AC02-98CH10886. J.G. appreciates the support by the DFG through the Emmy-Noether program.
References
- Tranquada et al. (1997) J. M. Tranquada, J. D. Axe, N. Ichikawa, et al., Phys Rev Lett 78, 338 (1997).
- Moodenbaugh et al. (1988) A. R. Moodenbaugh, Y. Xu, M. Suenaga, et al., Phys. Rev. B 38, 4596 (1988).
- Fujita et al. (2004) M. Fujita, H. Goka, K. Yamada, et al., Phys. Rev. B 70, 104517 (2004).
- Kivelson et al. (1998) S. Kivelson, E. Fradkin, and V. Emery, Nature 393, 550 (1998).
- Emery et al. (1997) V. J. Emery, S. A. Kivelson, and O. Zachar, Phys. Rev. B 56, 6120 (1997).
- Li et al. (2007) Q. Li, M. Hücker, G. D. Gu, et al., Phys Rev Lett 99, 067001 (2007).
- Tranquada et al. (2008) J. M. Tranquada, G. D. Gu, M. Hücker, et al., Phys. Rev. B 78, 174529 (2008).
- Lawler et al. (2010) M. J. Lawler, K. Fujita, J. Lee, et al., Nature 466, 347 (2010).
- Daou et al. (2010) R. Daou, J. Chang, D. Leboeuf, et al., Nature 463, 519 (2010).
- Abbamonte et al. (2005) P. Abbamonte, A. Rusydi, S. Smadici, et al., Nature Phys. 1, 155 (2005).
- Kim et al. (2008) Y.-J. Kim, G. D. Gu, T. Gog, et al., Phys. Rev. B 77, 064520 (2008).
- Hücker et al. (2011) M. Hücker, M. von Zimmermann, G. Gu, et al., Phys. Rev. B 83, 104506 (2011).
- Tranquada et al. (1995) J. Tranquada, B. Sternlieb, J. D. Axe, et al., Nature 375, 561 (1995).
- Fink et al. (2009) J. Fink, E. Schierle, E. Weschke, et al., Phys. Rev. B 79, 100502 (2009).
- Fink et al. (2011) J. Fink, V. Soltwisch, J. Geck, et al., Phys. Rev. B 83, 092503 (2011).
- Chen et al. (1991) C. T. Chen, F. Sette, Y. Ma, et al., Phys Rev Lett 66, 104 (1991).
- Romberg et al. (1990) H. Romberg, M. Alexander, N. Nücker, et al., Phys. Rev. B 42, 8768 (1990).
- (18) S. Partzsch and S. B. Wilkins, Unpublished.
- Tranquada et al. (1996) J. M. Tranquada, J. D. Axe, N. Ichikawa, et al., Phys. Rev. B 54, 7489 (1996).
- Rusydi et al. (2006) A. Rusydi, P. Abbamonte, H. Eisaki, et al., Phys Rev Lett 97, 016403 (2006).
- Rodriguez-Martinez and Attfield (1996) L. M. Rodriguez-Martinez and J. P. Attfield, Phys. Rev. B 54, R15622 (1996).
- Nachumi et al. (1998) B. Nachumi, Y. Fudamoto, A. Keren, et al., Phys. Rev. B 58, 8760 (1998).
- von Zimmermann et al. (1998) M. von Zimmermann, A. Vigliante, T. Niemoller, et al., Europhys. Lett. 41, 629 (1998).
- Tranquada et al. (1999) J. M. Tranquada, N. Ichikawa, and S. Uchida, Phys. Rev. B 59, 14712 (1999).
- Axe and Crawford (1994) J. D. Axe and M. K. Crawford, Journal of Low Temperature Physics 95, 271 (1994).
- Katano et al. (1993) S. Katano, J. Fernandez-Baca, S. Funahashi, et al., Physica C: Superconductivity 214, 64 (1993).
- Reznik et al. (2006) D. Reznik, L. Pintschovius, M. Ito, et al., Nature 440, 1170 (2006).
- Shannon (1976) R. D. Shannon, Acta Crystallographica Section A 32, 751 (1976).
- Kimura et al. (2003) H. Kimura, M. Kofu, Y. Matsumoto, et al., Phys Rev Lett 91, 067002 (2003).
- Buchner et al. (1994) B. Buchner, M. Breuer, A. Freimuth, et al., Phys Rev Lett 73, 1841 (1994).
- Radaelli et al. (1996) P. G. Radaelli, M. Marezio, H. Y. Hwang, et al., Phys. Rev. B 54, 8992 (1996).