Diffusion of hydrogen in graphite: A molecular dynamics simulation
Abstract
Diffusion of atomic and molecular hydrogen in the interstitial space between graphite sheets has been studied by molecular dynamics simulations. Interatomic interactions were modeled by a tight-binding potential fitted to density-functional calculations. Atomic hydrogen is found to be bounded to C atoms, and its diffusion consists in jumping from a C atom to a neighboring one, with an activation energy of about 0.4 eV. Molecular hydrogen is less attached to the host sheets and diffuses faster than isolated H. At temperatures lower than 500 K, H2 diffuses with an activation energy of 89 meV, whereas at higher its diffusion is enhanced by longer jumps of the molecule as well as by correlations between successive hops, yielding an effective activation energy of 190 meV.
pacs:
68.43.Jk, 68.43.Fg, 81.05.UfI Introduction
The past few years have seen extraordinary progress in the knowledge of carbon-based materials, and in particular on those formed by C atoms displaying hybridization. This is the case of materials discovered in last decades, such as carbon nanotubes and fullerenes, or in last years, such as graphene Geim and Novoselov (2007); Katsnelson (2007), apart from the more traditional graphite.
Carbon-based systems, in general, are considered as candidates for hydrogen storage Dillon and Heben (2001); Kowalczyk et al. (2005). Moreover, chemisorption on two-dimensional systems, such as graphene or graphite surfaces, can be important for catalytic processes Sluiter and Kawazoe (2003). The interest on hydrogen as an impurity in solids and on surfaces is not new, and dates back to several decades. This is in principle one of the simplest impurities, but a deep understanding of its physical properties is complex due to its low mass, and requires the combination of advanced experimental and theoretical methods Pearton et al. (1992); Estreicher (1995). In addition to its basic interest as an impurity, a relevant characteristic of hydrogen in solids and surfaces is its ability to form complexes and passivate defects, which has been extensively studied in the last thirty years Pearton et al. (1992); Estreicher (1995); Zeisel et al. (1999).
Experimental investigations on atomic, isolated hydrogen in graphite have been so far scarce, due to the difficulty in detecting this impurity. Moreover, this problem is complicated by the presence of a large amount of hydrogen trapped at the boundaries of graphite crystallites Atsumi (2002); Warrier et al. (2004, 2007). The stable hydrogen configurations in the bulk of graphite have been investigated in various theoretical works Ferro et al. (2002); Diño et al. (2003); Shimizu and Tachikawa (2003), with particular emphasis on atomic and molecular forms of this impurity. Also, the diffusion, trapping, and recombination of hydrogen on a graphite surface have been studied by theoretical techniques Ferro et al. (2003, 2004); Sha et al. (2005); Morisset and Allouche (2008). In connection with this, atomic hydrogen on graphene has been investigated by several authors using ab-initio methods Sluiter and Kawazoe (2003); Yazyev and Helm (2007); Casolo et al. (2009); Boukhvalov et al. (2008); Duplock et al. (2004); de Andres and Vergés (2008). It is generally accepted that chemisorption of a single hydrogen atom leads to the appearance of a defect-induced magnetic moment on the graphene sheet, along with a large structural distortion Yazyev and Helm (2007); Casolo et al. (2009); Boukhvalov et al. (2008). Recently, Ohldag et al. Ohldag et al. have discussed the role of hydrogen in room-temperature ferromagnetism at graphite surfaces from an x-ray dichroism analysis.
For the storage of hydrogen in graphite one should consider, apart from atomic hydrogen, the presence of H2 molecules between the graphite sheets, which are expected to be physisorbed in the interlayer space Diño et al. (2003); Ferro et al. (2002); Atsumi (2002). To study the diffusion of H2 in the bulk of graphite, one has to take into account that most of the experimental measurements detect in fact the molecular diffusion through crystallite boundaries Atsumi (2002), so that it is hard to obtain direct insight into the molecular diffusion in the interlayer space.
In this paper, molecular dynamics (MD) simulations are used to investigate the diffusion of atomic and molecular hydrogen in graphite. Recently, the diffusion of atomic hydrogen on an isolated graphene sheet has been studied by a combination of path-integral molecular dynamics simulations and transition-state theory, with special emphasis upon the appearance of quantum effects Herrero and Ramírez (2009a). Here, we will deal with classical molecular dynamics simulations, at temperatures high enough that such quantum effects become unimportant. This allows us to calculate directly diffusion coefficients, as the time in the classical simulations corresponds to real time, contrary to path-integral simulations, where the simulation time does not strictly correspond to actual time, but appears as a convenient computational way to derive time-independent thermodynamic properties. In the simulations presented here, the interatomic interactions have been modeled by a tight-binding (TB) potential fitted to density-functional calculations. The thermal behavior of hydrogen between graphite layers, as well as its diffusion in porous graphite have been addressed earlier by using MD simulations Shimizu and Tachikawa (2003); Warrier et al. (2004). This computational technique has been also applied to study several properties of hydrogen in various carbon-based materials de Rooij et al. (2009); Haas et al. (2009); Ito et al. (2009); Rai et al. (2009). In general, finite-temperature properties of hydrogen-related defects in solids have been investigated by ab-initio and TB molecular dynamics simulations Buda et al. (1991); Panzarini and Colombo (1994); Bédard and Lewis (2000).
The paper is organized as follows. In Sec. II, we describe the computational method employed in our calculations. Our results are presented in Sec. III, dealing with the diffusion of atomic and molecular hydrogen. In Sec. IV we summarize the main results.
II Computational Method
An important issue of the MD method is the adequate description of interatomic interactions, which should be as realistic as possible. Since effective classical potentials present many limitations to reproduce the many-body energy surface, specially in those situations where interatomic bonds may be either broken or formed, one should resort to self-consistent quantum-mechanical methods. However, density functional or Hartree-Fock based self-consistent potentials require computer resources that would restrict enormously the size of our simulation cell and/or the number of simulation steps. We found a compromise by employing an efficient tight-binding effective Hamiltonian, based on density functional (DF) calculations Porezag et al. (1995). The ability of TB methods to reproduce different properties of solids and molecules has been reviewed by Goringe et al. Goringe et al. (1997) We checked the capability of this DF-TB potential to predict frequencies of C–H vibrations. In particular, for a methane molecule it predicts in a harmonic approximation frequencies of 3100 and 3242 cm-1 for C–H modes with symmetry and , respectively Herrero et al. (2006), to be compared with experimental values of 2917 and 3019 cm-1 Johnson et al. (1993). Considering the usual anharmonic shift (towards lower frequencies) associated to these modes, the agreement is satisfactory. A detailed analysis of vibrational frequencies of hydrocarbon molecules derived with the present DF-TB potential, including anharmonicities, can be found elsewhere López-Ciudad et al. (2003); Böhm et al. (2001). We have employed earlier this TB Hamiltonian to describe hydrogen-carbon interactions in diamond Herrero et al. (2006); Herrero and Ramírez (2007) and graphene Herrero and Ramírez (2009a). The TB energy consists of two parts, the first one is the sum of energies of occupied one-electron states, and the second one is given by a pairwise repulsive interatomic potential Porezag et al. (1995). Since a correct description of the hydrogen molecule is essential for our purposes, special care was taken with the H-H pair potential, which has been taken as in our earlier study of molecular hydrogen in the silicon bulk Herrero and Ramírez (2009b). This pair potential reproduces the main features of known effective interatomic potentials for H2, such as the Morse potential Ramírez and López-Ciudad (2001).
Molecular dynamics simulations were carried out in the ensemble on a graphite supercell containing 64 C atoms and one impurity (H or H2), and periodic boundary conditions were assumed. The simulation cell includes two graphite sheets, each one being a graphene supercell of size = 9.84 Å. We considered an layer stacking, so that both sheets are disposed in such a way that the center of each hexagonal ring of one of them lies over a C atom of the adjacent sheet. To hold this kind of stacking along a simulation run, thus avoiding diffusion of the graphite layers, the center-of-gravity of each layer was not allowed to move on the plane. Note that in the following we will refer to the direction as the one perpendicular to the graphite layers. The average distance between sheets is a half of the supercell parameter along the axis, and was taken to be 3.35 Å. For the reciprocal-space sampling we have employed only the point (), as the main effect of using a larger set is a nearly constant shift in the total energy, with little influence in the calculation of energy differences.
Sampling of the configuration space has been performed at temperatures between 300 and 2000 K. For a given temperature, a typical run consisted of MD steps for system equilibration, followed by steps for the calculation of ensemble average properties. In some cases, specially at low temperatures, we carried out longer simulations to reduce the statistical errors. In particular, for H2 at K the simulations included MD steps. The equations of motion were integrated by using the standard Verlet algorithm Verlet (1967). The time step was taken in the range between 0.2 and 0.5 fs, which was found to be appropriate for the atomic masses and temperatures studied here. Some checks were carried out for smaller values of , yielding within error bars the same diffusion coefficients as those reported below. The diffusion coefficient at different temperatures has been calculated from the long-time behavior of the mean-square displacement of the mobile species (H or H2) in the interlayer space. Although motion along the coordinate (perpendicular to the graphite sheets) is allowed, it does not contribute to the long-time displacements, which are basically two-dimensional. Thus, the diffusion coefficient is given by:
| (1) |
where the mean-square displacement in the coordinate is
| (2) |
and a similar expression holds for . Here means an average over different zero times along a MD trajectory. For molecular hydrogen, the coordinates and correspond to the center-of-mass of the molecule.
III Results
III.1 Atomic hydrogen
We first discuss the lowest-energy configuration for atomic hydrogen in graphite, as derived from calculations at K. The impurity binds to a C atom, which relaxes out of the sheet plane by 0.34 Å, with a bond distance between C and H of 1.17 Å. This result is in line with those reported in the literature, with the breaking of a bond and the creation of an additional bond, changing the hybridization of the involved C atom from to Diño et al. (2003); Ferro et al. (2003); Sluiter and Kawazoe (2003); Boukhvalov et al. (2008); Casolo et al. (2009). This configuration with H attached to a C atom, which strongly relaxes off the sheet plane, is similar to that found for hydrogen adsorbed on an isolated graphene sheet Sluiter and Kawazoe (2003); Boukhvalov et al. (2008); Herrero and Ramírez (2009a).
For its relation with the diffusion process, we have calculated the energy barrier to break a C–H bond and attach the hydrogen to a nearest C atom in the same sheet, and found an energy of 0.40 eV. Note that this value includes contributions of the appreciable relaxations of both carbon atoms involved in the whole process. It is interesting that we find the same energy barrier (within the precision of our method) for hydrogen to detach from a C atom in one sheet and jump to an opposite C atom in the adjacent sheet. This is not strange if one takes into account that a hydrogen atom linked to a C atom in a graphite sheet is at a distance of around 1.51 Å from the sheet plane, a value close to half the distance between graphite layers (1.67 Å). Since H moves towards the middle plane to brake a C–H bond, the barriers for jumping to a C atom in the same or in the adjacent sheet are similar. The energy value found here is close to those obtained in earlier DF calculations: a value of 0.48 eV was reported in Ref. Ferro et al. (2003), and an estimated barrier of 0.4–0.5 eV in Ref. Diño et al. (2003). We note that this barrier is clearly lower than the one found for hydrogen jumps on an isolated graphene layer, for which the interaction potential employed here gives an energy of 0.78 eV.
We now turn to the results of our MD simulations at finite temperatures. From the calculations at = 0 K, one can expect that hydrogen will diffuse between the graphite sheets in a step-like fashion, dissociating from a C atom and attaching to a nearby one, in the same or in the adjacent sheet. This will cause an almost two-dimensional diffusion in the interlayer space. The likelihood of hydrogen jumping from an interlayer region to an adjacent one, crossing a graphite sheet is very low, since H has to climb an energy barrier of about 5 eV through an hexagonal ring of C atoms.

In Fig. 1 we show the evolution of the coordinate of hydrogen (direction perpendicular to the graphite sheets) along a MD simulation consisting of 106 steps (amounting to a time of 300 ps), at a temperature of 600 K. In spite of the large fluctuations in the coordinate , one observes that the hydrogen atom is mainly located on one of two planes at distance of about 1.5 or 1.8 Å from the lower graphite layer. These two distances correspond to H linked to C atoms in the lower and upper sheets, respectively. In fact, from the calculations at zero temperature, we found that the stable sites for hydrogen (bound to C atoms) lie at 1.51 Å from a graphite sheet, and at 3.35 Å - 1.51 Å = 1.84 Å from the adjacent one (see dashed lines in Fig. 1). In general, we observe along the MD simulations that the hydrogen jumps are rather short and direct, breaking a C–H bond and forming another one with a nearby carbon atom in the same or in an adjacent sheet.
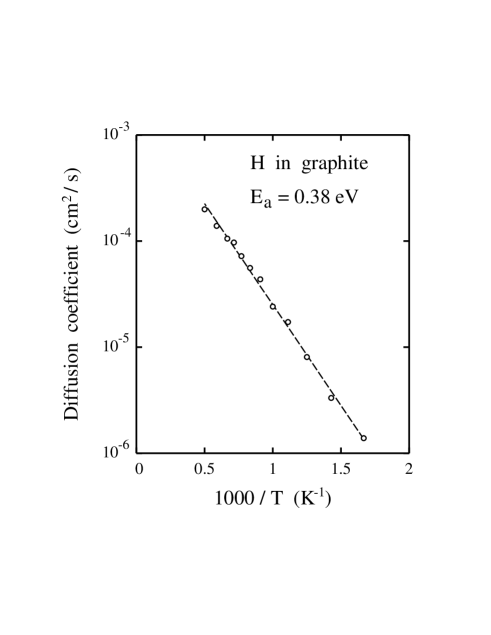
From the mean-square displacement of hydrogen along the MD simulations, we have calculated the diffusion coefficient in the interlayer space by using Eq. (1). The results are presented in Fig. 2 as a function of the inverse temperature in an Arrhenius plot. They can be fitted well to an expression , with an activation energy = 0.38 eV and a preexponential factor cm2/s. This value corresponds to the order of magnitude expected for H diffusion in graphite. In fact, can be expressed by the simple expression: , where is the distance between nearest adsorption sites (C atoms), and is a typical “attempt frequency” (the factor of four in the denominator takes into account the fact that the diffusion is two-dimensional, as in Eq. (1)). Taking = 1.4 Å and an attempt frequency corresponding to a C–H stretching mode (about 3000 cm-1), we find an estimation for the preexponential factor cm2/s. This estimation is of the order of derived from the simulations, but its numerical value is somewhat larger. This is not strange if one considers that hops of hydrogen from one layer to the adjacent one can contribute = 1.4 Å in the plane, but also = 0 (jumping between opposite C atoms in the AB layer stacking), without contributing to the overall diffusion.
At 1000 K we obtain from the MD simulations a relatively high diffusion coefficient cm2/s. In practice, we can determine rather accurately the value of down to temperatures in the order of 600 K, where cm2/s. At lower , the hydrogen diffusion is too slow to allow for a precise determination of from the mean-square displacements. In fact at room temperature ( = 300 K) hydrogen jumps are observed very rarely in the simulations. In any case, an extrapolation of the fit shown in Fig. 2 yields at 300 K a value cm2/s. The activation energy derived from the slope of the dashed line displayed in Fig. 2 ( = 0.38 eV) is very close to the energy barrier calculated for breaking a C–H bond and linking the hydrogen to another C atom. This confirms the diffusion mechanism of atomic hydrogen expected from the calculations at = 0 K.
At lower than room temperature one expects the appearance of appreciable quantum effects in the hydrogen diffusion. Such quantum effects cause an effective renormalization of the diffusion barrier, which is reduced with respect to the high-temperature value. This can be studied by a combination of transition-state theory with quantum path-integral simulations, as has been done for hydrogen on a graphene sheet Herrero and Ramírez (2009a) and in bulk semiconductors Herrero (1997); Herrero and Ramírez (2007), but is out of the scope of the present work.
III.2 Molecular hydrogen

Molecular hydrogen is expected to diffuse in graphite faster than atomic hydrogen, since the former will be less bonded to the host sheets, and therefore more mobile in the interlayer space. For an H2 molecule we find a minimum-energy position at an interstitial site between a carbon atom in a graphite sheet and an hexagonal ring in an adjacent sheet. At this position, the preferred orientation of the molecule is parallel to the graphite planes, in agreement with earlier calculations based on density-functional theory Diño et al. (2003). At finite temperatures the molecule will explore other positions and orientations with respect to the graphite layers. We define the angular probability distribution of the angle between the H–H direction and the sheet plane such that the probability of observing an angle in the interval is given by
| (3) |
(i.e., takes into account the degeneracy of angle ). In Fig. 3 we present the probability distribution , as derived from our molecular dynamics simulations at three different temperatures: 300 K (solid line), 800 K (dashed line), and 1300 K(dotted line). The distribution has a maximum at (H–H parallel to the layers), and reaches its minimum for H–H perpendicular to the sheet plane (). As temperature increases, the probability distribution broadens slightly, but it remains as a peak centered at .
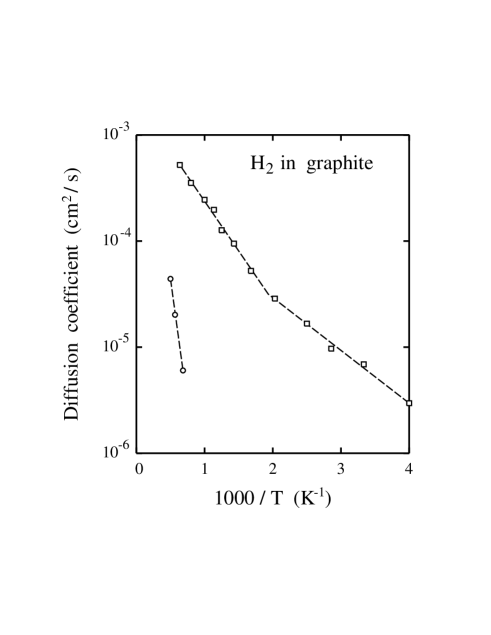
From the mean-square displacement of H2 along the molecular dynamics simulations we have calculated its diffusion coefficient at several temperatures. The results are presented in Fig. 4 as a function of the inverse temperature. One observes first that the diffusion coefficient of H2 is larger than that of atomic hydrogen in graphite, shown in Fig. 2. Thus, at 1000 K we find cm2/s for H2 to be compared with cm2/s for H. This difference is much larger at 300 K, since we find cm2/s for H2 vs the extrapolated value of cm2/s for atomic hydrogen (about four orders of magnitude less).
We note that the results presented for the diffusion coefficient of H2 were derived from MD simulations where the graphite sheets are flexible, i.e. the C atoms are free to move along the simulations, and in particular the sheets can relax and adapt to the presence of the hydrogen molecule. However, due to the lack of direct bonding between molecular hydrogen and graphite, one can ask it relaxation of the sheets does in fact affect the molecular diffusion. To obtain insight into this question we have carried out some MD simulations in which the C atoms were kept fixed at their unrelaxed (ideal) positions, and calculated the diffusion coefficient of H2. The results of these calculations are displayed in Fig. 4 as circles at temperatures higher than 1000 K. One notices that, at a given , the value of derived in this way is clearly lower than that found when the C atoms are allowed to move and relax in the presence of H2. In fact, at 1000 K the diffusion coefficient with fixed C atoms is smaller than cm2/s, the lower limit for a reliable determination of in our simulations. All this indicates that motion and relaxation of the graphite sheets directly affects the diffusion of molecular hydrogen in graphite.
A remarkable aspect of Fig. 4 is that the diffusion coefficient of molecular hydrogen does not follow a single straight line in the Arrhenius plot, i.e. it does not display a dependence of the form in the whole temperature range considered here. It seems rather that one can distinguish two temperature regions with different effective activation energy . In fact, at K those data can be fitted well with = 0.19 eV, whereas at lower temperature seems to be about a factor of two lower ( = 0.098 eV).
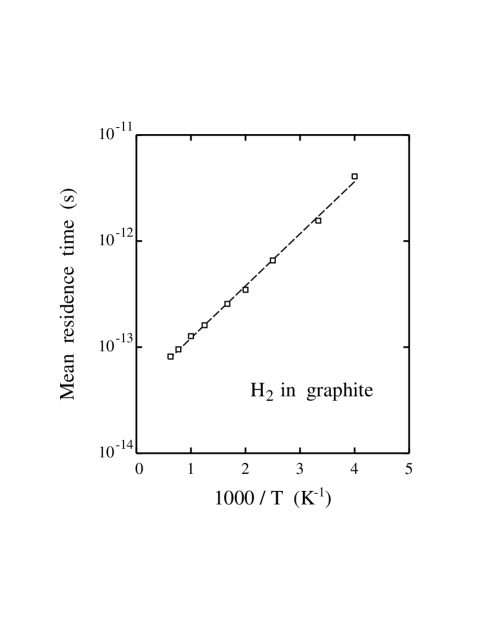
Given the change in slope of the results presented in the Arrhenius plot of Fig. 4 (squares), we wonder whether at high and low temperatures the diffusion mechanism is different, or maybe the molecular jump rate from site to site in the interlayer space suffers some change apart from that predicted by a single activation energy. To clarify this question we have calculated the mean residence time of H2 on the interstitial sites along the MD simulations. To this end we have counted the number of molecular jumps in the molecular dynamics trajectories at different temperatures. The results for the mean residence time are plotted in Fig. 5 vs the inverse temperature. is found to follow a dependence in the whole temperature range under consideration, with an activation energy = 97 meV. This activation energy coincides, within statistical error, with that derived from the diffusion coefficient of molecular hydrogen at temperatures lower than 500 K ( = 98 meV).
The available sites for H2 in the interlayer space of graphite form a honeycomb lattice, in which each site has three nearest neighbors. At low temperature ( K) the molecular diffusion proceeds via jumps between nearest-neighbor adsorption sites in a random walk of the H2 molecule in the interlayer space. At high temperatures, however, we observe two mechanisms that contribute to enhance the molecular diffusion. First, we detected jumps longer than the distance between nearest interstitial adsorption sites. In particular, we found direct jumps to second (next-nearest) and third neighboring interlayer sites, at a distance of 1.7 and 2 times that between nearest neighbors. At 1000 K, the fraction of these longer jumps amounts to about 9% of the total number of molecular jumps, versus around 1% at 500 K, and a negligible quantity of 300 K.
At K we also observed that the molecular jumps between nearest adsorption sites are correlated, in the sense that after a given jump, the probability that the next one occurs in the forward direction (the same direction as the previous one) is larger than in any other direction. This correlation contributes to enhance the diffusion of H2, and at high temperatures the molecular diffusion cannot be considered as a random walk over the available adsorption sites. These two mechanisms (longer and correlated jumps) cause an increase in the diffusion coefficient, as compared with the behavior expected from an extrapolation of the low-temperature results. Such an increase translates into an enhancement of the slope in the Arrhenius plot of the diffusion coefficient, and consequently in the observation of an apparently larger effective activation energy . This behavior illustrates the limitations of the interpretation of diffusion coefficients in Arrhenius plots. In fact, any temperature-dependent effect in the preexponential factor cannot be directly distinguished in an Arrhenius plot from changes in the activation energy. Our results of the mean residence time of H2 in graphite provide evidence that the energy barrier for molecular motion remains constant in the temperature range from 250 to 1600 K.
IV Summary
The main advantage of this kind of MD simulations of hydrogen in graphite is the possibility of calculating diffusion coefficients in a large range of temperatures, using an interatomic potential fitted to ab-initio calculations. Due to the large relaxation of the nearest C atoms, the migration of atomic hydrogen in graphite requires important motion of these atoms. Then, a hydrogen jump has to be viewed as a cooperative process involving a coupled motion of the impurity and the nearest host atoms. This effect is not a requirement for the diffusion of H2, but in practice relaxation of the C atoms in the nearest graphite layers helps to enhance appreciably the molecular diffusion. This has been shown in Fig. 4 by comparing MD simulations with fixed or mobile carbon atoms. In fact, at 1000 K the diffusion coefficient is more than 100 times larger when the C atoms are allowed to relax out of their ideal positions.
At 1000 K we obtained for molecular hydrogen a diffusion coefficient one order of magnitude larger than for atomic hydrogen. In fact, we found cm2/s for H2 versus cm2/s for H. This difference increases to about four orders of magnitude at 300 K: cm2/s for H2, to be compared with an extrapolated value of cm2/s
The diffusion coefficients derived here for atomic and molecular hydrogen in graphite have to be considered as higher limits for the actually measured values. In fact, point or extended defects in the host layers will act as hydrogen traps, causing an appreciable reduction in the diffusion. More important, for a comparison with experimental measurements, one has to take into account that an important part of the hydrogen is concentrated on the crystallite boundaries and in the micro-voids between graphite granules.
An interesting question is the dissociation of molecular hydrogen and its recombination in the interlayer space of graphite. A study of the combination of these processes with atomic and molecular diffusion lies, however, out of the scope of the present paper and remains as a challenge for future research.
Acknowledgements.
This work was supported by Ministerio de Ciencia e Innovación (Spain) through Grants FIS2006-12117-C04-03 and FIS2009-12721-C04-04, and by Comunidad Autónoma de Madrid through Program MODELICO-CM/S2009ESP-1691.References
- Geim and Novoselov (2007) A. K. Geim and K. S. Novoselov, Nat. Mater. 6, 183 (2007).
- Katsnelson (2007) M. I. Katsnelson, Mater. Today 10, 20 (2007).
- Dillon and Heben (2001) A. C. Dillon and M. J. Heben, Appl. Phys. A 72, 133 (2001).
- Kowalczyk et al. (2005) P. Kowalczyk, H. Tanaka, R. Holyst, K. Kaneko, T. Ohmori, and J. Miyamoto, J. Phys. Chem. B 109, 17174 (2005).
- Sluiter and Kawazoe (2003) M. H. F. Sluiter and Y. Kawazoe, Phys. Rev. B 68, 085410 (2003).
- Pearton et al. (1992) S. J. Pearton, J. W. Corbett, and M. Stavola, Hydrogen in Crystalline Semiconductors (Springer, Berlin, 1992).
- Estreicher (1995) S. K. Estreicher, Mater. Sci. Eng. R14, 319 (1995).
- Zeisel et al. (1999) R. Zeisel, C. E. Nebel, and M. Stutzmann, Appl. Phys. Lett. 74, 1875 (1999).
- Atsumi (2002) H. Atsumi, J. Nucl. Mater. 307-311, 1466 (2002).
- Warrier et al. (2004) M. Warrier, R. Schneider, E. Salonen, and K. Nordlund, Physica Scripta T108, 85 (2004).
- Warrier et al. (2007) M. Warrier, R. Schneider, E. Salonen, and K. Nordlund, Nucl. Fusion 47, 1656 (2007).
- Ferro et al. (2002) Y. Ferro, F. Marinelli, and A. Allouche, J. Chem. Phys. 116, 8124 (2002).
- Diño et al. (2003) W. A. Diño, Y. Miura, H. Nakanishi, H. Kasai, and T. Sugimoto, J. Phys. Soc. Japan 72, 1867 (2003).
- Shimizu and Tachikawa (2003) A. Shimizu and H. Tachikawa, J. Phys. Chem. Solids 64, 419 (2003).
- Ferro et al. (2003) Y. Ferro, F. Marinelli, and A. Allouche, Chem. Phys. Lett. 368, 609 (2003).
- Ferro et al. (2004) Y. Ferro, F. Martinelli, A. Jelea, and A. Allouche, J. Chem. Phys. 120, 11882 (2004).
- Sha et al. (2005) X. Sha, B. Jackson, D. Lemoine, and B. Lepetit, J. Chem. Phys. 122, 014709 (2005).
- Morisset and Allouche (2008) S. Morisset and A. Allouche, J. Chem. Phys. 129, 024509 (2008).
- Yazyev and Helm (2007) O. V. Yazyev and L. Helm, Phys. Rev. B 75, 125408 (2007).
- Casolo et al. (2009) S. Casolo, O. M. Lovvik, R. Martinazzo, and G. F. Tantardini, J. Chem. Phys. 130, 054704 (2009).
- Boukhvalov et al. (2008) D. W. Boukhvalov, M. I. Katsnelson, and A. I. Lichtenstein, Phys. Rev. B 77, 035427 (2008).
- Duplock et al. (2004) E. J. Duplock, M. Scheffler, and P. J. D. Lindan, Phys. Rev. Lett. 92, 225502 (2004).
- de Andres and Vergés (2008) P. L. de Andres and J. A. Vergés, Appl. Phys. Lett. 93, 171915 (2008).
- (24) H. Ohldag, P. Esquinazi, E. Arenholz, D. Spemann, M. Rothermel, A. Setzer, and T. Butz, eprint arXiv:0905.4315.
- Herrero and Ramírez (2009a) C. P. Herrero and R. Ramírez, Phys. Rev. B 79, 115429 (2009a).
- de Rooij et al. (2009) E. D. de Rooij, U. von Toussaint, A. W. Kleyn, and W. J. Goedheer, Phys. Chem. Chem. Phys. 11, 9823 (2009).
- Haas et al. (2009) O.-E. Haas, J. M. Simon, and S. Kjelstrup, J. Phys. Chem. C 113, 20281 (2009).
- Ito et al. (2009) A. Ito, Y. Wang, S. Irle, K. Morokuma, and H. Nakamura, J. Nucl. Mater. 390, 183 (2009).
- Rai et al. (2009) A. Rai, M. Warrier, and R. Schneider, Comput. Mater. Sci. 46, 469 (2009).
- Buda et al. (1991) F. Buda, G. L. Chiarotti, R. Car, and M. Parrinello, Phys. Rev. B 44, 5908 (1991).
- Panzarini and Colombo (1994) G. Panzarini and L. Colombo, Phys. Rev. Lett. 73, 1636 (1994).
- Bédard and Lewis (2000) S. Bédard and L. J. Lewis, Phys. Rev. B 61, 9895 (2000).
- Porezag et al. (1995) D. Porezag, T. Frauenheim, T. Köhler, G. Seifert, and R. Kaschner, Phys. Rev. B 51, 12947 (1995).
- Goringe et al. (1997) C. M. Goringe, D. R. Bowler, and E. Hernández, Rep. Prog. Phys. 60, 1447 (1997).
- Herrero et al. (2006) C. P. Herrero, R. Ramírez, and E. R. Hernández, Phys. Rev. B 73, 245211 (2006).
- Johnson et al. (1993) B. G. Johnson, P. M. W. Gill, and J. A. Pople, J. Chem. Phys. 98, 5612 (1993).
- López-Ciudad et al. (2003) T. López-Ciudad, R. Ramírez, J. Schulte, and M. C. Böhm, J. Chem. Phys. 119, 4328 (2003).
- Böhm et al. (2001) M. C. Böhm, J. Schulte, E. Hernández, and R. Ramírez, Chem. Phys. 264, 371 (2001).
- Herrero and Ramírez (2007) C. P. Herrero and R. Ramírez, Phys. Rev. Lett. 99, 205504 (2007).
- Herrero and Ramírez (2009b) C. P. Herrero and R. Ramírez, Phys. Rev. B 80, 035207 (2009b).
- Ramírez and López-Ciudad (2001) R. Ramírez and T. López-Ciudad, J. Chem. Phys. 115, 103 (2001).
- Verlet (1967) L. Verlet, Phys. Rev. 159, 98 (1967).
- Herrero (1997) C. P. Herrero, Phys. Rev. B 55, 9235 (1997).