2011 Vol. 9 No. 00, 000–000
22institutetext: Key Laboratory of Optical Astronomy, National Astronomical Observatories, Chinese Academy of Sciences \vs\noReceived [year] [month] [day]; accepted [year] [month] [day]
Spectroscopic Study of Globular Clusters in the Halo of M31 with Xinglong 2.16m Telescope
Abstract
We present the spectroscopic observations for 11 confirmed globular clusters of M31 with the OMR spectrograph on 2.16m telescope at Xinglong site of National Astronomical Observatories, Chinese Academy of Sciences. Nine of our sample clusters are located in the halo of M31 and the most remote one is out to a projected radius of 78.75 kpc from the galactic center. For all our sample clusters, we measured the Lick absorption-line indices and the radial velocities. It is noted that most GCs of our sample are distinct from the HI rotation curve of M31 galaxy, especially for B514, MCGC5, H12 and B517, suggesting that most of our sample clusters do not have kinematic association with the star forming young disk of the galaxy. We fitted the absorption line indices with the updated stellar population model Thomas et al. (2010) with two different tracks of Cassisi and Padova, separately, by applying the minimization method. The fitting results show that all our sample clusters are older than 10 Gyr, and metal-poor ( [Fe/H] dex). After merging the spectroscopic metallicity of our work with the previously published ones, we extended the cluster sample out to a projected radius of 117 kpc from the galaxy’s center. We found the metallicity gradient for all the confirmed clusters exists with a slope of dex kpc-1. However, the slope turns to be dex kpc-1 for all the halo clusters, which is much shallower. If we only consider the outer halo clusters with kpc, the slope becomes dex kpc-1 and if one cluster G001 is excluded from the outer halo sample, the slope is dex kpc-1. Thus we conclude that metallicity gradient for M31 outer halo clusters is not significant, which agrees well with the previous findings.
keywords:
galaxies: individual (M31) — galaxies: star clusters — globular clusters: general — star clusters: general1 Introduction
Galactic formation and evolutionary scenarios remain among the most important outstanding problems in contemporary astrophysics (Perrett et al., 2002). One way to better understand these questions is through detailed studies of globular clusters (GCs). These objects are often considered fossils of galactic formation and evolution processes, since they formed at the very early stages of their host galaxies’ lifecycles (Barmby et al., 2000). GCs are usually densely packed, gravitationally bound spherical systems containing several thousands to approximately one million stars. Thus, they can be detected from great distances and are suitable as probes for studying the properties of extragalactic systems.
Located at a distance of approximately 780 kpc (Stanek & Garnavich, 1998; Macri, 2001; McConnachie et al., 2005), M31 is the nearest and largest spiral galaxy in our Local Group. It contains a large number of GCs and is considered an ideal laboratory for studies of star clusters in external galaxies. Barmby & Huchra (2001) estimated the total number of GCs at , while Perina et al. (2010) arrived at 530. Both of these estimates yield much larger numbers than for the GCs in our Galaxy. However, from the observational evidence collected to date (see, e.g., Rich et al. , 2005), the M31 GCs and their Galactic counterparts reveal some striking similarities (Fusi Pecci et al., 1994; Djorgovski et al., 1997; Barmby et al., 2002). Based on survey data from the Canada-France-Hawaii Telescope (CFHT) and the Wide Field Camera on the Isaac Newton Telescope (INT), Huxor (2007) concluded that M31 and the Milky Way are more similar than previously thought. However, Hammer et al. (2007) compared our Galaxy and M31 to the local disk galaxies within the same mass range and found that Milky Way is an exceptional disk galaxy which did not undergo any significant merging for last 10 Gyrs so that it lacks stellar mass, angular momentum, disk radius ad metallicity of stars in the outskirts while M31 is a typical disk galaxy which is shaped by relatively recent merging. This may explain why there are more GCs in M31 than that in our Galaxy by a factor of 3 as the merging could lead to the formations of GCs. Later, Yin et al. (2009) found that the two galaxies are similar in the radial profiles of star formation rate, gas profiles and stellar metallicity distributions along the disk by studying the chemical evolution history of the two galaxies. The authors concluded that the star formation efficiency of M31 disk is twice high as that in our Galaxy. Hou et al. (2009) also compared the two disk galaxies and concluded that the Milky Way disk contains more gas and higher star formation rate than that of M31. The authors also find that the scaled abundance gradients are similar for the two galaxies. These recent works could provide useful clues which can explain the similarities and differences of two GC system. Therefore, studying the properties of the GCs in M31 not only improves our understanding of the formation and structure of our nearest large neighbor, but also of our own Galaxy.
A large number of halo GCs in M31 have recently been discovered. These are important to study the formation history of M31 and its dark matter content. Huxor et al. (2004) discovered nine previously unknown GCs in the halo of M31 using the INT survey. Subsequently, Huxor et al. (2005) found three new, extended GCs in the halo of M31, which have characteristics between typical GCs and dwarf galaxies. Mackey et al. (2006) reported four extended, low-surface-brightness clusters in the halo of M31 based on Hubble Space Telescope/Advanced Camera for Surveys (ACS) imaging. They are structurally very different from typical M31 GCs. However, their old and metal-poor characteristics are similar to those of typical GCs. Huxor (2007) discovered 40 new GCs in the halo of M31 (out to 100 kpc from the galactic center) based on INT and CFHT imaging. Some of them are also very extended. These extended star clusters in the M31 halo are very similar to the diffuse star clusters (DSCs) associated with early-type galaxies in the Virgo Cluster reported by Peng et al. (2006) based on the ACS Virgo Cluster survey. However, it seems that DSCs are usually fainter than typical GCs. Mackey et al. (2007) reported 10 outer-halo GCs in M31, at 15 kpc to 100 kpc from the galactic center. Eight of these were newly discovered based on deep ACS imaging. The halo GCs in their sample are very bright, compact, and metal poor, and therefore quite different from their counterparts in our Galaxy. Ma et al. (2010) constrained the age, metallicity, reddening and distance modulus of B379, which is located in the halo of M31, with the SSP model and photometry.
In this paper, we will present our new observations on a sample of new GCs, most of them are located far from the galaxy center. This allows us to be able to study the properties of the M31 outer halo in more detail. The paper is organized as follows. In §2 we describe how we selected our sample of M31 GCs and their spatial distribution. In §3, we reported the spectroscopic observations with 2.16 m telescope at Xinglong site and the data reductions from which the radial velocities and Lick line indices were measured. Subsequently, in §4, we derive the ages and metallicities of GCs with minimization fitting. We also discuss our final results on the metallicity distribution in the M31 halo. We give our summary in §5.
2 Sample selection
We selected the sources from the Revised Bologna Catalogue of M31 globular clusters and candidates (RBC v.4, available from http://www.bo.astro.it/M31; Galleti et al., 2004, 2006, 2007, 2009) , which is the latest and most comprehensive M31 GC catalogue so far. It contains 2045 objects, including 663 confirmed star clusters, 604 cluster candidates, and 778 other objects that were initially thought to be GCs but later proved to be stars, asterisms, galaxies, or Hii regions. In fact, many of the halo clusters were from Mackey et al. (2007), who reported 10 GCs in the outer halo of M31 from their deep ACS images, of which eight were detected for the first time (see for details in §1). In our work, our sample clusters are completely selected from RBC v.4. We selected the confirmed and bright ( mag in band) clusters as well as being located as far as they could from the galaxy center, where the local background is too bright to observe. Finally, we have 11 bright confirmed clusters in our sample and most of them are located in the halo of the galaxy. Although some of our sample clusters have the previous spectroscopic observations by some authors, actually those clusters lack comprehensive spectroscopic informations. In other words, they only have radial velocities or [Fe/H] or [/Fe] or age informations. Therefore it is necessary to observe the spectra of our sample clusters systematically and study the ages and metallicity in detail.
The informations of our sample GCs are listed in Table 1, including coordinates, projected radii, -band magnitudes and age estimates. All the coordinates (Cols. 2 and 3) and -band magnitudes (Col. 5) are from RBC v.4 except the mag of EXT8 which was derived from photometry of Peacock et al. (2010) with the transformation equation of Jester et al. (2005) as mag of EXT8 is not provided in RBC v.4. The projected radii from the galaxy center (Col. 4) were calculated with M31 center coordinate (Perrett et al., 2002), PA and distance kpc (McConnachie et al., 2005). The ages (Col. 6) are from a number of previous work: Peacock et al. (2010) by using the SDSS and 2MASS photometric colors; Caldwell et al. (2009) by using the 6.5m MMT Hectospec spetra line indices and HST CMD fittings, Galleti et al. (2005) by comparing the lines indices with the prediction models.
| ID | R.A. | Dec. | age | references for agesb | ||
|---|---|---|---|---|---|---|
| (J2000) | (J2000) | (kpc) | (mag) | |||
| MCGC2 | 00:29:44.90 | +41:13:09.8 | 33.47 | 16.98 | old | P |
| MCGC3 | 00:30:27.30 | +41:36:20.4 | 31.88 | 16.31 | old | P |
| B514 | 00:31:09.90 | +37:53:59.7 | 55.39 | 15.76 | Gyr | G |
| MCGC5 | 00:35:59.73 | +35:41:03.8 | 78.73 | 16.09 | old | P |
| B298 | 00:38:00.23 | +40:43:55.9 | 14.28 | 16.59 | old | C |
| H12 | 00:38:03.85 | +37:44:00.6 | 50.03 | 16.47 | ||
| B019 | 00:40:52.52 | +41:18:53.4 | 4.84 | 14.93 | old | C |
| B020 | 00:40:55.26 | +41:41:25.2 | 7.42 | 14.91 | interm / old | P, C |
| B023 | 00:41:01.18 | +41:13:45.7 | 4.46 | 14.22 | old | P, C |
| EXT8 | 00:53:14.51 | +41:33:24.7 | 27.27 | 15.54a | ||
| B517 | 00:59:59.91 | +41:54:06.6 | 45.08 | 16.08 |
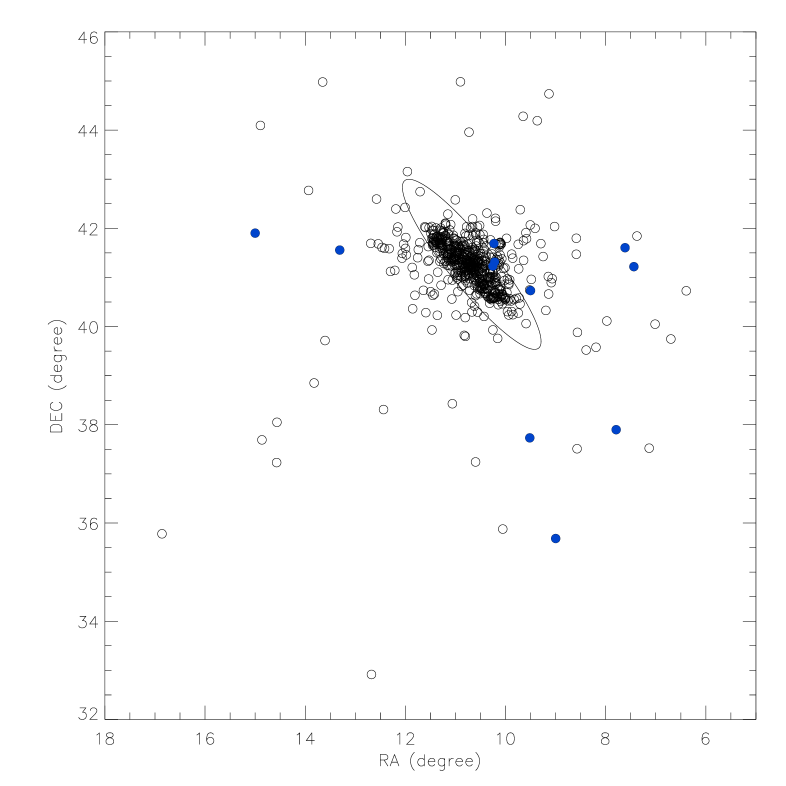
We show the spatial distribution of our sample GCs and all the confirmed GCs from RBC v.4 in Figure 1. The large ellipse is the M31 disk/halo boundary as defined by Racine (1991). Note that most of our sample are located in the halo of M31 except B019 and B023, which are very close to each other with a distance of arcmin. That’s to say, most of GCs in our sample are halo GCs in M31, which can help us to access the nature of galaxy halo with these clusters.
3 Observations and data reduction
Our Low-resolution spectroscopic observations were all taken at the 2.16m optical telescope at Xinglong Site, which belongs to National Astronomical Observatories, Chinese Academy of Sciences (NAOC), from 10th to 13th September 2010. An OMR (Optomechanics Research Inc.) spectrograph and a PI 1340400 CCD detector were used during this run with a dispersion of 200 Å mm-1, 4.8 Å pixel-1, and a 3.0 \arcsecslit. Exposures of seconds were taken with seeing typically \arcsec. Our spectra cover the wavelength range of Å at 4 Å resolution. All our spectra have .
The spectroscopic data were reduced following standard procedures using the NOAO Image Reduction and Analysis Facility (IRAF, version 2.11) software package. The CCD reduction includes bias and flat-field correction, as well as cosmic-ray removal. Wavelength calibration was performed based on helium/argon lamps exposed at both the beginning and the end of the observations each night. Flux calibration of all spectra was performed based on observations of at least two of the KPNO spectral standard stars (Massey et al., 1988) per night. The atmospheric extinction was corrected for using the mean extinction coefficients measured for Xinglong by the Beijing-Arizona-Taiwan-Connecticut (BATC) multicolor sky survey (H. J. Yan 1995, priv. comm.).
Before we measure the Lick absorption line indices, the heliocentric radial velocities were obtained by fitting the abosorption lines of our spectra with the templates in various radial velocities. The typical internal velocity errors on a single measure is km s-1. The estimated radial velocities with the associated uncertainties (Col. 2) are listed in Table 2. The published radial velocities (Col. 3) are also listed for comparisons. It can be seen that our measurements agree well with those listed in RBC v.4. At least, we can not see significant differences between our measurements and the published values.
| ID | This work | RBC v.4 |
|---|---|---|
| MCGC2 | ||
| MCGC3 | ||
| B514 | ||
| MCGC5 | ||
| B298 | ||
| H12 | ||
| B019 | ||
| B020 | ||
| B023 | ||
| EXT8 | ||
| B517 |
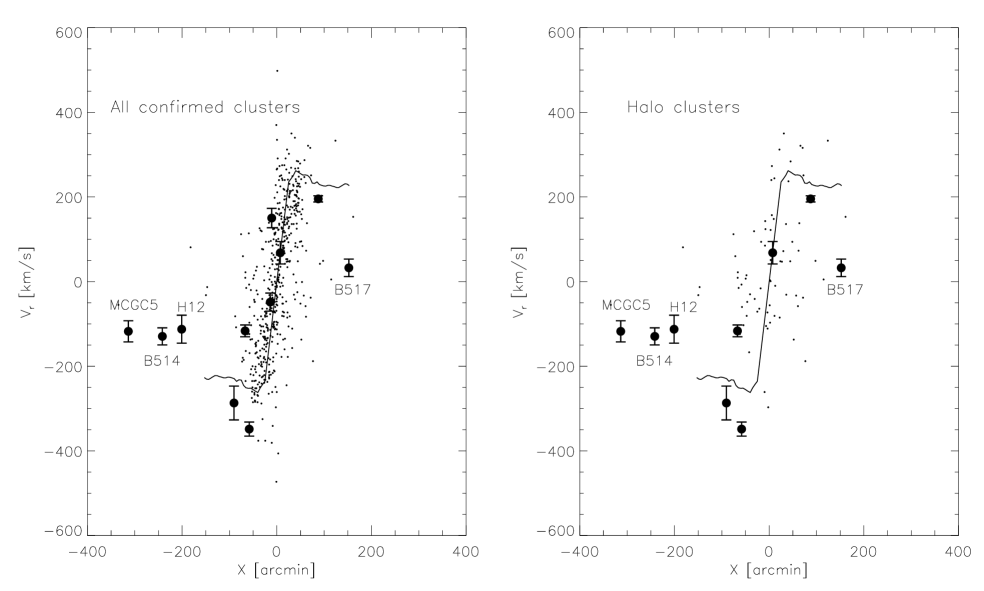
Similar to Galleti et al. (2005, 2006) and Caldwell et al. (2009), we plotted the radial velocity (corrected for the systemic velocity of M31) versus the projected distance along the major axis () in Figure 2. The left panel is for all the confirmed clusters while the right panel is for the halo clusters which are defined in Figure 1. The small points are the published measurements from RBC v.4 while the filled circles with errors are the measurements in our work. Since Carignan et al. (2006) calculated the HI rotation curve of M31 out to kpc with the observations results of Effelsberg and Green Bank 100 m telescopes, the HI rotation curve of M31 galaxy were over plotted in figure 2 with the continuous line. It can be seen that both the halo clusters and most of our sample clusters do not follow the disk mean velocity curve very well, especially for B514, MCGC5, H12 and B517, suggesting that they do not have kinematic association with the star forming young disk of M31.
Subsequently, all the spectra were shifted to the zero radial velocity and degraded to the wavelength dependent Lick resolution with a variable-width Gaussian kernel following the definition of Worthey & Ottaviani (1997), i.e. 11.5 Å at 4000 Å, 9.2 Å at 4400 Å, 8.4 Å at 4900 Å, 8.4 Å at 5400 Å, 9.8 Å at 6000 Å. Thus, we measured all the 25 types of Lick indices strictly by using the parameters and formulas from Worthey et al. (1994) and Worthey & Ottaviani (1997). The uncertainty of each index was estimated based on the analytic formulae (11)(18) of Cardiel et al. (1998). All the Lick absorption line indices measurements and errors are listed in Table 3.
| Indices | MCGC2 | MCGC3 | B514 | MCGC5 | B298 | H12 | B019 | B020 | B023 | EXT08 | B517 |
|---|---|---|---|---|---|---|---|---|---|---|---|
| (Å) | |||||||||||
| error | |||||||||||
| (Å) | |||||||||||
| error | |||||||||||
| (mag) | |||||||||||
| error | |||||||||||
| (mag) | |||||||||||
| error | |||||||||||
| (Å) | |||||||||||
| error | |||||||||||
| (Å) | |||||||||||
| error | |||||||||||
| (Å) | |||||||||||
| error | |||||||||||
| (Å) | |||||||||||
| error | |||||||||||
| (Å) | |||||||||||
| error | |||||||||||
| (Å) | |||||||||||
| error | |||||||||||
| (Å) | |||||||||||
| error | |||||||||||
| (Å) | |||||||||||
| error | |||||||||||
| (Å) | |||||||||||
| error | |||||||||||
| (Å) | |||||||||||
| error | |||||||||||
| (mag) | |||||||||||
| error | |||||||||||
| (mag) | |||||||||||
| error | |||||||||||
| (Å) | |||||||||||
| error | |||||||||||
| (Å) | |||||||||||
| error | |||||||||||
| (Å) | |||||||||||
| error | |||||||||||
| (Å) | |||||||||||
| error | |||||||||||
| (Å) | |||||||||||
| error | |||||||||||
| (Å) | |||||||||||
| error | |||||||||||
| (Å) | |||||||||||
| error | |||||||||||
| (mag) | |||||||||||
| error | |||||||||||
| (mag) | |||||||||||
| error |
As an example, Figure 3 shows the reduced spectroscopy of our sample GC B023, with all the Lick absorption line indices bandpasses marked. The spectrum has been degraded and shifted to the zero radial velocity as described above. Actually, from the definitions of line indices of CN1 and CN2 (Worthey et al., 1994; Worthey & Ottaviani, 1997), we find that the index bandpasses of them are totally the same and the only difference is the pseudocontinua coverage.

A simple way to estimate the metallicity is by calculating it from the combination of absorption line indices Mg and Fe. Galleti et al. (2009) provide the method to measure the metallicity from [MgFe], which is defined as [MgFe] , with (Fe5270+Fe5335)/2. Thus, the metallicity can be derived from the formula below,
| (1) |
The uncertainty of the was estimated with the equation in the following,
| (2) |
All metallicity derived from [MgFe] and the associated uncertainty determinations are listed in Col. (2) of Table 4. It is obvious that all the metallicity derived from the line index [MgFe] agree well with those from the model fitting method.
4 Fitting, analysis and results
4.1 Model description
Thomas et al. (2003) provided stellar population models including Lick absorption line indices for various elemental-abundance ratios, covering ages from 1 to 15 Gyr and metallicities from 1/200 to solar abundance. These models are based on the standard models of Maraston (1998), with input stellar evolutionary tracks from Cassisi et al. (1997) and Bono et al. (1997) and a Salpeter (1955) stellar initial mass function. Thomas et al. (2004) improved the models by including higher-order Balmer absorption-line indices. They found that these Balmer indices are very sensitive to changes in the /Fe ratio for supersolar metallicities. The latest stellar population model for Lick absorption-line indices (Thomas et al., 2010) is an improvement on Thomas et al. (2003) and Thomas et al. (2004). They were derived from the MILES stellar library, which provides a higher spectral resolution appropriate for MILES and Sloan Digital Sky Survey (SDSS) spectroscopy, as well as flux calibration. The models cover ages from 0.1 to 15 Gyr, [Fe/H] from to 0.67 dex, and [/Fe] from to 0.5 dex. In our work, we fitted our absorption indices based on the models of Thomas et al. (2010), by using the two sets of stellar evolutionary tracks provided, i.e., Cassisi et al. (1997) and Padova.
4.2 Fitting with stellar population models and the results
As Caldwell et al. (2009) demonstrated that the minimization method for many diagnostic lines are more reliable to extract the ages than the two absorption line indices diagram plot method. Furthermore, we have measured 25 different types of Lick line indices listed in Table 3, all of which were used for the fitting procedure, then the results should be much more reliable and accurate. Since Thomas et al. (2010) provide only 20 ages, 6 [Fe/H] values, and 4 [/Fe], it is necessary to interpolate the original models to the higher-resolution models for our needs. We carried out the cubic spline interpolations, using equal step lengths, to obtain a grid of 150 ages from 0.1 to 15 Gyr, 31 [Fe/H] values from to 0.67 dex, and 51 [/Fe] from to 0.5 dex, which makes the model more accurate and more helpful for our following statistics. Therefore, the ages (), metallicities [Fe/H], and [/Fe] were determined at the same time by comparing the interpolated stellar population models with the spectral-energy distributions from our photometry by employing the minimization method, i.e.,
| (3) |
where /Fe) is the Lick line index in the stellar population model for age , metallicity [Fe/H], and [/Fe], while represents the observed Lick line indices from our measurements and the errors estimated in our fitting are given as follows,
| (4) |
Here, is the observational uncertainty and is the uncertainty associated with the models of Thomas et al. (2010). We combined the two uncertainties together in our fitting.
| ID | |||||||
|---|---|---|---|---|---|---|---|
| MCGC2 | |||||||
| MCGC3 | |||||||
| B514 | |||||||
| MCGC5 | |||||||
| B298 | |||||||
| H12 | |||||||
| B019 | |||||||
| B020 | |||||||
| B023 | |||||||
| EXT8 | |||||||
| B517 |
0.86Cas: fitting with the model evolutionary tracks of Cassisi et al. (1997); Pad: fitting with the model evolutionary tracks of Padova, respectively.
From Table 4, we found that either the [Fe/H] or the ages or the [/Fe] derived from the Cassisi et al. (1997) or from Padova tracks of the models are basically the same, suggesting that our fitting results are consistent with each other. Moreover, the ages constrained in our work are in good agreement with those previous work in Table 4, implying that our fitting method is reliable. Besides, it is worth noting that all of our sample GCs, most of which are located in the galaxy halo, are older than 10 Gyr, indicating that these clusters formed at the very beginning of the galaxy formation. We also find that the metallicity derived from the absorption-line index [MgFe] (in Col. 2) consists with metallicity fitted with two different tracks of the model (in Cols. 3 and 6). Previously, Galleti et al. (2005) estimated the metallicity of B514 with [Fe/H], and RBC v.4 lists the metallicity for B514 [Fe/H], for B298 [Fe/H], for B019 [Fe/H], for B020 [Fe/H], for B023 [Fe/H]. All these previous measurements are in good agreement with our estimates in Table 4, indicating our method and results are reliable. For consistency, in the subsequent analysis, we adopted the ages and metallicity from Thomas et al. (2010) + Cassisi et al. (1997) track of the predictive model.
4.3 Metallicity Properties of Outer Halo
The metal abundance is one of the most important properties of star clusters to understand the formation and enrichment processes of their host galaxy. For instance, the halo stars and clusters should feature large-scale metallicity gradients if the enrichment timescale is shorter than the collapse time, which may be due to the galaxy formation as a consequence of a monolithic, dissipative, and rapid collapse of a single massive, nearly spherical, spinning gas cloud (Eggen et al., 1962; Barmby et al., 2000). On the other hand, Searle & Zinn (1978) presented a chaotic scheme for early galactic evolution, when the loosely bound pre-enriched fragments merge with the protogalaxy during a very long period of time, in which case a more homogeneous metallicity distribution should develop. Most galaxies are thought to have formed through a combination of these scenarios.
A lot of previous work attempted to find the clues of formation and evolution for M31 galaxy through studying the metallicity distribution of its globular cluster system. Huchra et al. (1991); Ashman & Bird (1993); Barmby et al. (2000); Perrett et al. (2002); Fan et al. (2008) found that the metal-rich GCs are statistically more concentrated toward the center of the galaxy, while their metal-poor counterparts are more spatially extended in the halo. Furthermore, there are also many work to find out whether or not a radial metallicity gradient exists for M31 star cluster system. van den Bergh (1969); Huchra et al. (1982) showed that there is little or no evidence for a general radial metallicity gradient for GCs within a radius of 50 arcmin. However, studies including Huchra et al. (1991); Perrett et al. (2002); Fan et al. (2008) support the possible existence of a radial metallicity gradient for the metal-poor M31 GCs, although the slope is not very significant. Perrett et al. (2002) suggest that the gradients is and dex arcmin-1 for the full sample and inner metal-poor clusters. More recently, Fan et al. (2008) found that the slope is and dex arcmin-1 for the metal-poor subsample and whole sample while the slope approches zero for the metal-rich subsample. Nevertheless, all these studies are based on GCs that are located relatively close to the center of the galaxy, usually at projected radii of less than 100 arcmin. In our work, we extended the radial coverage to a radius of kpc, which corresponds to arcmin, to check if the previous findings are correct at a much larger distance from the galaxy center.
For the purpose of better investigating the metallicity distribution/spatial gradient, we enlarged the metallicity sample by merging the metallicity of our measurements with the published spectroscopic metallicity from Huchra et al. (1991); Barmby et al. (2000); Perrett et al. (2002); Galleti et al. (2009); Caldwell et al. (2011) together with those from CMD fittings Mackey et al. (2006, 2007, 2010) . For the published data, if the metallicity from different work overlapped with the other, the small smaller associated uncertainty data will superseded the larger one and the spectroscopic data will superseded the one derived from CMD fitting. In total, we have a metallicity sample of 384 entries.
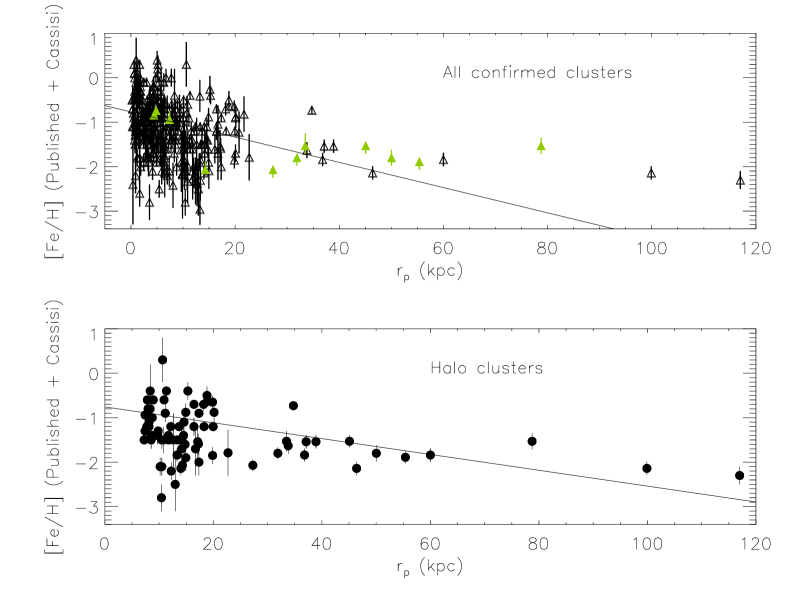
Figure 4 shows the metallicity as a function of projected radius from the galaxy center for all M31 confirmed clusters (Top) and the halo clusters only (Bottom) in the unit of kpc. In the top panel, open triangles with errorbars represent the spectroscopic metallicities from the published measurements of Huchra et al. (1991); Barmby et al. (2000); Perrett et al. (2002); Galleti et al. (2009); Caldwell et al. (2011) as well as the metallicities from CMD fittings Mackey et al. (2006, 2007, 2010) while the green filled triangles with errorbars are our spectroscopic measurements. The solid line is a linear fit to all the data points, with a slope of dex kpc-1, responding to dex arcmin-1. The fit results are similar to those given by the previous works (see, Perrett et al., 2002; Fan et al., 2008), which are based on the cluster sample within a projected radii arcmin ( kpc). Thus, our work tentatively supports the notion that a radial metallicity gradient may exist out to a projected radius of kpc by merging the published metallicities. In other words, we updated the results with the new sample extended to M31’s most remote outer halo. Since the aim of our work is to study the nature of M31 halo, we would like to foucs on the metallicity gradient of halo clusters. In the bottom panel, we only plot the halo clusters, which are defined in Figure 1. A least-squares fitting yields the slope of dex kpc-1. Therefore, it can be seen that the metallicity gradient seems to exist for the halo clusters, although it is not significant.
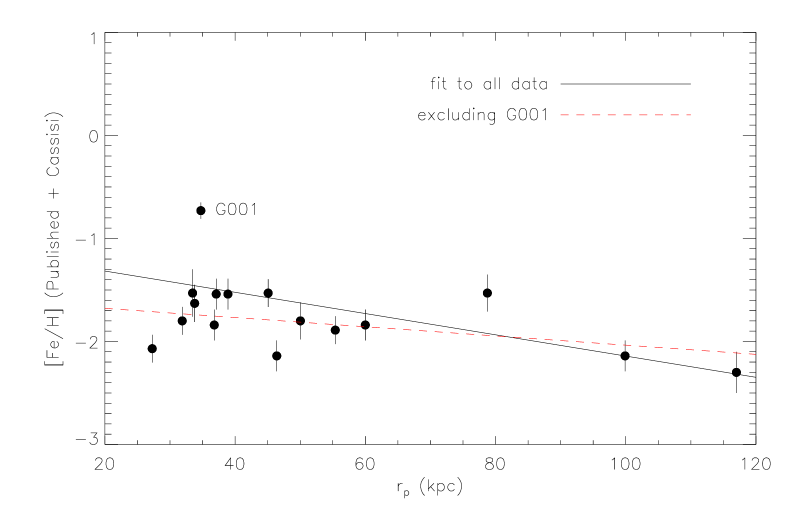
Furthermore, It is noted that in Figure 4, the metallicity gradient for the clusters located in the outer halo with 25 kpc is not significant. Thus, we show the metallicity as a function of projected radius for only the outer halo clusters with 25 kpc in Figure 5. A least-squares linear fitting for all the data shows the slope is dex kpc-1 (the solid line). However, if G001 is excluded, the slope turns out to be dex kpc-1 (the red dashed line), which is much shallower than that in Figure 4. It may suggest that the metallicity gradient is not significant for the outer halo clusters in M31. Very recently, Huxor et al. (2011) investigated the metallicity gradient for 15 halo CGs to 117 kpc with the metallicity derived from the CMD fittings Mackey et al. (2006, 2007, 2010) and the authors found that the metallicity gradient becomes not significant if one halo GC H14 is excluded in their Figure 6. We found that our result is consistent with the previous finding of Huxor et al. (2011).
5 Discussions and Summary
In our work, we carried out the spectroscopic observations of 11 confirmed globular clusters of M31 with the OMR spectrograph and a PI 1340400 CCD detector on 2.16 m telescope at Xinglong site of NAOC from 10th to 13th September of 2010. Since our aim is to study the nature of the halo of M31, we selected the bright confirmed clusters, 9 of which are located in the halo, out to a projected radius of 78.75 kpc from the galactic center.
For all our sample clusters, we measured all types of the Lick absorption-line indices (see the definitions in, Worthey et al., 1994; Worthey & Ottaviani, 1997) as well as the radial velocities. We found that most GCs of our sample are distinct from the HI rotation curve of M31 galaxy, especially for B514, MCGC5, H12 and B517, suggesting that most of our sample clusters do not have kinematic association with the star forming young disk of the galaxy.
Since Caldwell et al. (2009) demonstrated that the minimization method for many diagnostic lines are more reliable for extracting the ages than the line indices diagram plot, in our wok we applied the minimization method to fit the line indices with the updated stellar population model Thomas et al. (2010) with two different tracks Cassisi and Padova, separately. The fitting results show that all our sample clusters are older than 10 Gyr and most of them are metal-poor ( [Fe/H] dex).
In order to enlarge our sample, we merged the spectroscopic metallicity of our work with the previously published ones, extending the cluster sample out to a projected radius of 117 kpc from the galaxy’s center. We found the metallicity gradient for all the confirmed clusters exists with a slope of dex kpc-1. However, the slope turns to be dex kpc-1 for all the halo clusters, which is much shallower. If we only consider the outer halo clusters with kpc, the slope becomes dex kpc-1 and if one cluster G001 is excluded from the outer halo sample, the slope even could be dex kpc-1. Thus we conclude that metallicity gradient for M31 outer halo clusters is not significant, which agrees well with the previous findings. This result may imply that for M31 galaxy formation, the “rapid collapsing” scenario is supported inside the inner halo while the “fragments merging” scenario is proved in the outer halo of the galaxy beyond 25 kpc from the center. It seems that the combination of the two scenarios could best explain the galaxy formation. However, we still need more observations and further study to figure it out.
Besides, it is interesting to note that the halo of M31 galaxy might be divided into two parts (by combining the Huxor data): inner halo and outer halo from our study. The nature of the two parts of halo seem to be different in terms of metallicity gradients of the star clusters, which may be due to the different formation mechanisms of the two parts. Just like the Milky Way halo from the SDSS/SEGUE data, the Milky Way halo could be divided into two parts with different metallicity properties based on the observations of a large sample halo stars. Therefore, it seems that M31 galaxy and our Galaxy have more similarities than we expected. However, more observational data is required for the further study in the future.
Acknowledgements.
We would like to thank Richard de Grijs for useful discussions. The authors are also grateful to the anonymous referee for the helpful suggestions and the kind staff at the Xinglong 2.16m telescope for the support during the observations. This research was supported by National Natural Science Foundation of China through grants 10873016, 10803007, 10633020, 11003021, 11073027 and 11073032, as well as by the National Basic Research Program of China (973 Program) under grant 2007CB815403. ZF acknowledges a Young Researcher Grant of the National Astronomical Observatories, Chinese Academy of Sciences.References
- Ashman & Bird (1993) Ashman, K. M., Bird, C. M. 1993, AJ, 106, 2281.
- Barmby et al. (2000) Barmby, P., Huchra, J., Brodie, J., Forbes, D., Schroder, L., Grillmair, C. 2000, AJ, 119, 727
- Barmby & Huchra (2001) Barmby, P., & Huchra, J. P. 2001, AJ, 122, 2458
- Barmby et al. (2002) Barmby, P., Holland, S., Huchra, J. P. 2002, AJ, 123, 1937
- Bono et al. (1997) Bono, G., Caputo, F., Cassisi, S., Castellani, V., Marconi, M. 1997, ApJ, 489, 822
- Caldwell et al. (2009) Caldwell, N., Harding, P., Morrison, H., Rose, J. A., Schiavon, R., & Kriessler, J. 2009, AJ, 137, 94
- Caldwell et al. (2011) Caldwell, N., Schiavon, R., Morrison, H., Rose, J., Harding, P. 2011, AJ, 141, 61
- Cardiel et al. (1998) Cardiel, N., Gorgas, J., Cenarro, J. Gonzalez, J. J. 1998, A&AS, 127, 597
- Carignan et al. (2006) Carignan, C., Chemin, L., Huchtmeier, W. K., Lockman, F. J. 2006, ApJ, 641L, 109
- Cassisi et al. (1997) Cassisi S., Castellani M., Castellani, V. 1997, A&A, 317, 10
- Djorgovski et al. (1997) Djorgovski S. G., Gal R. R., McCarthy J. K., Cohen J. G., de Carvalho R. R., Meylan G., Bendinelli O., Parmeggiani G. 1997, ApJ, 474, L19
- Eggen et al. (1962) Eggen, O. J., Lynden-Bell, D., Sandage, A. R. 1962, ApJ, 136, 748
- Fan et al. (2008) Fan, Z., Ma, J., de Grijs, R., Zhou, X. 2008, MNRAS, 385, 1973
- Fusi Pecci et al. (1994) Fusi Pecci, F., et al. 1994, A&A, 284, 349
- Galleti et al. (2004) Galleti, S., Federici, L., Bellazzini, M., Fusi Pecci, F., Macrina, S. 2004, A&A, 426, 917
- Galleti et al. (2005) Galleti, S., Bellazzini, M., Federici, L., Fusi Pecci, F. 2005, A&A, 436, 535
- Galleti et al. (2006) Galleti, S., Federici, L., Bellazzini, M., Buzzoni, A., Fusi Pecci, F. 2006, A&A, 456, 985
- Galleti et al. (2007) Galleti, S., Bellazzini, M., Federici, L., Buzzoni, A., Fusi Pecci, F. 2007, A&A, 471, 127
- Galleti et al. (2009) Galleti, S., Bellazzini, M., Buzzoni, L., Federici, L., Fusi Pecci, F. 2009, A&A, 508, 1285
- Hammer et al. (2007) Hammer, F., Puech, M., Chemin, L., Flores, H., Lehnert, M. D. 2007, ApJ, 662, 322
- Hou et al. (2009) Hou, J., Yin, J., Boissier, S., Prantzos, N., Chang, R. X., Chen, L. 2009, IAU Symposium, 254, 27
- Huchra et al. (1982) Huchra, J. P., Stauffer, J., van Speybroeck, L. 1982, ApJ, 259, L57
- Huchra et al. (1991) Huchra J. P., Brodie J. P., Kent S. M. 1991, ApJ, 370, 495
- Huxor et al. (2004) Huxor, A., Tanvir, N. R., Irwin, M. J., Ferguson, A. M. N., Ibata, R. A., Lewis, G. F., Bridges, T. 2004, in ASP Conf. Ser. 327, Satellites and Tidal Streams, ed. F. Prada, D. Martinez-Delgado, & T. Mahoney (San Francisco: ASP), 118
- Huxor et al. (2005) Huxor, A. P., Tanvir, N. R., Irwin, M. J., Ibata, R., Collett, J. L., Ferguson, A. M. N., Bridges, T., Lewis, G. F. 2005, MNRAS, 360, 1007
- Huxor (2007) Huxor, A. 2007, Ph.D. Thesis, Univ. of Hertfordshire, UK
- Huxor et al. (2011) Huxor, A. P., Ferguson, A. M. N., Tanvir, N. R., Irwin, M. J., Mackey, A. D., Ibata, R. A., Bridges, T., Chapman, S. C., Lewis, G. F. 2011, arXiv1102.0403H
- Jester et al. (2005) Jester, S., et al. 2005, AJ, 130, 873
- Ma et al. (2010) Ma, J., Wu, Z., Wang, S., Fan, Z., Zhou, X., Wu, J., Jiang, Z., Chen, J. 2010, PASP, 122, 1164
- Macri (2001) Macri, L. M. 2001, ApJ, 549, 721
- Mackey et al. (2006) Mackey, A. D., et al. 2006, ApJ, 653, L105
- Mackey et al. (2007) Mackey, A. D., et al. 2007, ApJ, 655, L85
- Mackey et al. (2010) Mackey, A. D., et al. 2010, MNRAS, 401, 533
- Maraston (1998) Maraston, C. 1998, MNRAS, 300, 872
- Massey et al. (1988) Massey, P., Strobel, K., Barnes, J. V., Anderson, E. 1988, ApJ, 328, 315
- McConnachie et al. (2005) McConnachie, A. W., Irwin, M. J., Ferguson, A. M. N., Ibata, R. A., Lewis, G. F., Tanvir, N. 2005, MNRAS, 356, 979
- Peacock et al. (2010) Peacock, M. B., Maccarone, T. J., Knigge, C., Kundu, A., Waters, C. Z., Zepf, S. E., & Zurek, D. R. 2010, MNRAS, 402, 803
- Peng et al. (2006) Peng, E., et al. 2006, ApJ, 639, 838
- Perina et al. (2010) Perina, S., et al. 2010, A&A, 511, 23
- Perrett et al. (2002) Perrett, K. M., Bridges, T. J., Hanes, D. A., Irwin, M. J., Brodie, J. P., Carter, D., Huchra, J. P., Watson, F. G. 2002, AJ,123, 2490
- Racine (1991) Racine, R. 1991, AJ, 101, 865
- Rich et al. (2005) Rich, R. M., Corsi, C. E., Cacciari, C., Federici, L., Fusi Pecci, F., Djorgovski, S. G., Freedman, W. L. 2005, AJ, 129, 2670
- Salpeter (1955) Salpeter, E. E. 1955, ApJ, 121, 161
- Searle & Zinn (1978) Searle L., Zinn R. 1978, ApJ, 225, 357
- Stanek & Garnavich (1998) Stanek, K. Z., Garnavich, P. M. 1998, ApJ, 503, 131
- Thomas et al. (2003) Thomas, D., Maraston, C., Bender, R. 2003, MNRAS, 339, 897
- Thomas et al. (2010) Thomas, D., Maraston, C., Johansson, J. 2010, arXiv1010.4569.
- Thomas et al. (2004) Thomas, D., Maraston, C., Korn, A. 2004, MNRAS, 351, L19
- van den Bergh (1969) van den Bergh, S. 1969, ApJS, 19, 145
- Worthey et al. (1994) Worthey, Guy, Faber, S. M., Gonzalez, J. J., Burstein, D. 1994, ApJS, 94, 687
- Worthey & Ottaviani (1997) Worthey, Guy, Ottaviani, D. L. 1997, ApJS, 111, 377
- Yin et al. (2009) Yin, J., Hou, J. L., Prantzos, N., Boissier, S., Chang, R. X., Shen, S. Y., Zhang, B. 2009, A&A, 505, 497