High temperature charge and thermal transport properties of the n-type thermoelectric material PbSe
Abstract
We present a detailed study of the charge transport, optical reflectivity, and thermal transport properties of n-type PbSe crystals. A strong scattering, mobility-limiting mechanism was revealed to be at play at temperatures above 500 K. The mechanism is indicative of complex electron-phonon interactions that cannot be explained by conventional acoustical phonon scattering alone. We applied the first order non-parabolicity approximation to extract the density of states effective mass as a function of doping both at room temperature and at 700 K. The results are compared to those of a parabolic band model and in the light of doping dependent studies of the infrared optical reflectivity. The thermal conductivity behavior as a function of temperature shows strong deviation from the expected Debye-Peierls high temperature behavior (umklapp dominated) indicating an additional heat carrying channel, which we associate with optical phonon excitations. The correlation of the thermal conductivity observations to the high temperature carrier mobility behavior is discussed. The thermoelectric figure of merit exhibits a promising value of 0.8 at 700K at cm-3.
I Introduction
The cubic semiconductor PbSe (space group Fm-3m, a=6.125 Å) has been attracting scientific attention for more that seven decades mainly because of its optical properties. For example, the infra-red behavior of PbSe has been appreciated since the 1940s Barrow1944 and eventually found applications in photodetectors and thermal imaging.Ravich1970 More recently, the advent of nanoscience raised interest in photovoltaic applications based on excitonic effects in PbSe nanocrystals. Schaller2004 ; Choi2009 ; Ma2009 Hence, the compelling majority of published work on the system involves the study of thin films and other nanostructures mainly at room temperature and lower.
Lately, however, theoretical and experimental reports have pointed out the appealing characteristics of PbSe for higher temperature thermoelectric applications.Zhang2009 ; Parker2010 ; Wang2011 ; AndroulakisPRB11 ; AndroulakisJACS11 For example, PbSe melts at a relatively high temperature (1080 oC), is composed of earth abundant elements, is easy to scale up, and performs better than PbTe at 900 K, one of the choice thermoelectric materials in the temperature regime 600-900 K.AndroulakisPRB11 ; AndroulakisJACS11 ; Kanatzidis2010 It is noteworthy, that all of the above reports (refs 6-10) have highlighted the lack of detailed experimental studies on the charge and thermal transport as well as basic electronic band structure parameters of PbSe, with different dopants and as a function of doping level especially at high temperatures.
Hirahara et al., for example, studied the mobility of both n and p type PbSe hot pressed samples up to 773 K and doping levels well below cm-3 taking into account impurity scattering. Hirahara1954 Later, Schlichting and Gobrecht repeated the mobility study up to 800 K on melt grown crystals of n and p type PbSe extending the doping levels up to cm-3, and concluded that electron phonon interactions are dominant.Schlichting1973 Scattering was also studied in the framework of defect formation through measurements of Hall effect, electrical conductivity, and thermopower by Gurieva et al. but the study was not conclusive as to which type of defects (e.g. interstitial, Frenkel etc) dominate.Gurieva1987 Alekseeva et al. have studied the high temperature properties of p-type PbSe and samples with isovalent Cd and Mn ion substitution respectively.Alekseeva Finally, limited attention has been given to the valence band structure of PbSe and its effect on the high temperature thermoelectric properties.Vinogradova ; Alekseeva1997
Given the increasing interest in the high temperature properties of PbSe and the aforementioned conflicting conclusions on the charge transport properties of PbSe, it becomes clear that a reliable and consistent experimental body of results has to be established. Hence, we initiated a study of n-type samples doped with Cl exhibiting an electron carrier density in the range cm-3. The choice of Cl as a dopant is justified by its substitutionary action on the Se sublattice leaving undisturbed the conduction band of PbSe that consists primarily of Pb p-orbitals.Zhang2009 ; Parker2010 We report electrical conductivity, Hall coefficient, thermoelectric power and thermal conductivity as a function of doping and temperature. Furthermore, the optical reflectivity as a function of doping at room temperature was studied within the framework of a Krammers-Kroning analysis. We employed both a parabolic and a non-parabolic (Kane-type) band model to extract basic parameters such as the effective mass and the Lorenz number at different temperatures and as a function of the doping level. Finally, a thorough investigation of the lattice thermal conductivity is presented where in addition to acoustical and three phonon processes optical phonon contributions are required to better account for the observed high temperature behavior. We find that the maximum thermoelectric figure of merit, ZT, achieved at 700 K is 0.8 for a carrier density of cm-3.ZT
II Experimental Details
The PbSe crystals were grown by the Bridgman technique inside sealed and evacuated quartz ampules with one end tapered. The ampules were loaded with high purity Pb (99.999%, American Elements), Se (99.999%, 5N Plus) and PbCl2 (99.9999%, Aldrich). Initially the load was suspended in the hot zone of the furnace at 600 oC for 72 h. Then the hot zone was heated to 1150 oC, the load was raised at a higher position outside the hot zone and dipped at a speed of 1.2 mm/h. After growth, the ingots were sliced to 8 mm diameter disks with a waferizing saw. Subsequently, two of the disks were further processes with a polisher to form a bar of typical dimensions 73.52.5 mm and to a disk of thickness 2 mm. Optical examination of the specimens revealed a polycrystalline texture consisting of large single crystals oriented at different directions.
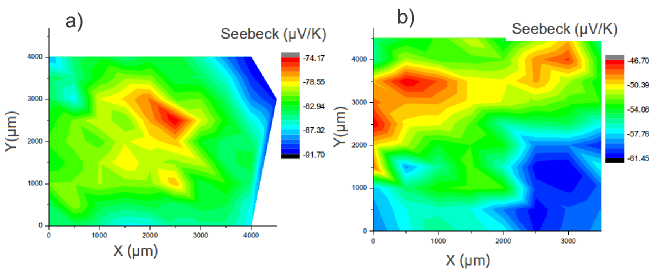
The bar and disk specimens of each growth were separately examined at room temperature for consistency in doping by combining Hall effect and a spatial scanning Seebeck apparatus. Specimens with large inhomogeneous areas of thermopower, pertaining to large carrier density variations, were not considered further. Figure 1 presents a typical example of a homogeneous and an inhomogeneous pair of specimens. Generally, we have observed that doping levels above 0.4 % mol, corresponding to an average Hall concentration, , higher than 4, produce such high doping inhomogeneities. Therefore, the present study was limited to a set of five samples exhibiting high homogeneity and an average carrier density not higher than 3.8, see Table I. The measured increases monotonically as a function of increasing nominal Cl concentration. A one to one correspondence of versus Cl concentration was observed to a reasonable degree at cm-3. At high PbCl2 molar concentrations there is a deviation indicating doping action inability of Cl in the PbSe lattice.
The high temperature Hall coefficient was measured in a home-made high temperature apparatus, which provides a working range from 300 K to 873 K. The samples were press-mounted and protected with argon gas to avoid possible oxidization at high temperature. The Hall resistance was monitored with a Linear Research AC Resistance Bridge (LR-700), and the data were taken in a field of 1 T provided by an Oxford Superconducting air-bore magnet.
The electrical conductivity, , and Seebeck coefficient, S, were measured simultaneously on the bar shaped specimens in a ULVAC-RIKO ZEM-3 system. The specimens were protected in a helium atmosphere ( 0.1 atm) while the furnace of the instrument was cycled from room temperature to 700 K and back. No thermal hysteresis was observed with thermal cycling.
The disk-shaped specimens were used to determine the thermal diffusivity as a function of temperature and doping in a NETZSCH LFA 457 Microflash instrument. Subsequently the thermal conductivity, , was estimated by the relation , where D is the thermal diffusivity, is the heat capacity under constant pressure and is the mass density of the specimens. was approximated by the formula .AndroulakisPRB11 All charge and thermal transport measurements were performed in the same specimen direction.
| ID | PbCl2 | n | (cm-1) | (g/cm3) |
| A | 0.05 | 0.75 | 697 | 7.90 |
| B | 0.10 | 0.88 | 710 | 7.98 |
| C | 0.20 | 1.50 | 729 | 8.02 |
| D | 0.30 | 3.20 | 970 | 7.90 |
| E | 0.40 | 3.80 | 990 | 7.99 |
| F | - | 0.2 | - | 8.09 |
Room temperature infrared reflectivity (IR) measurements were performed on finely-polished PbSe samples using a Bruker 113V FTIR spectrometer. The spectra were collected in the 100-3000 cm-1 spectral region with a resolution of 2 cm-1 at nearly normal incidence. The reflection coefficient was determined by a typical sample-in-sample-out method with a mirror as the reference. The and spectra (where is the complex dielectric function) were derived from the Kramers-Kronig transformation.Fox
III Results and Discussion
III.1 Charge Transport Measurements
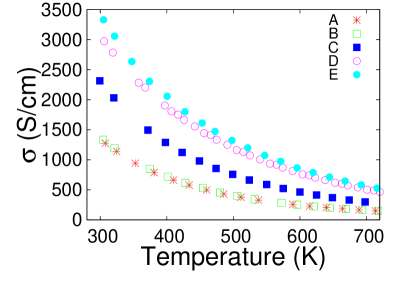
The electrical conductivity, of samples A-E is depicted in Fig. 2. The values of are increasing with increasing doping, i.e. moving from specimen A to E, at any given temperature. At room temperature values as high as 3500 S/cm can be realized for a doping level of 3.8 cm-3, indicative of relatively high mobilities, . For all specimens a monotonic decrease in with increasing temperature is observed. Since , the functional dependence of in temperature may result from the temperature dependence either of or from factors limiting .
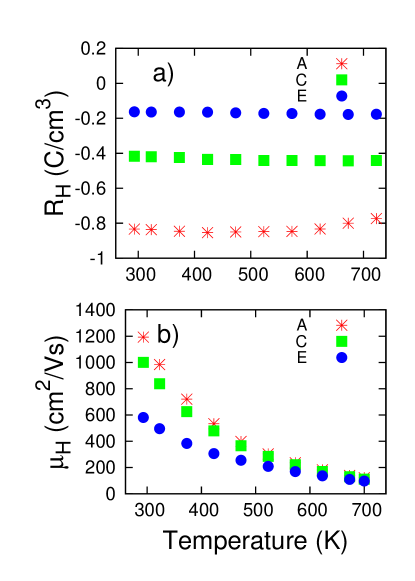
To elucidate the behavior of we performed temperature dependent Hall effect studies. The Hall coefficient, , for samples A, C, and E, is plotted in Fig. 3a as a function of temperature. is almost temperature independent. Considering it follows that the specimens retain the same carrier density up to 700 K. A more accurate description of should take into account the non-parabolicity of the bands and the statistical anisotropy due to scattering. In such a case ,Abeles1954 where is the statistical anisotropy factor that varies from 1 to , and is the energy surface anisotropy factor that is equal to .Schlichting1973 For PbSe, Zawadzki1974 and therefore the product varies from 0.97 to 1.14 depending on the value of . For simplicity we have kept , since fundamentally the conclusions of our study are not distorted by such an assumption.
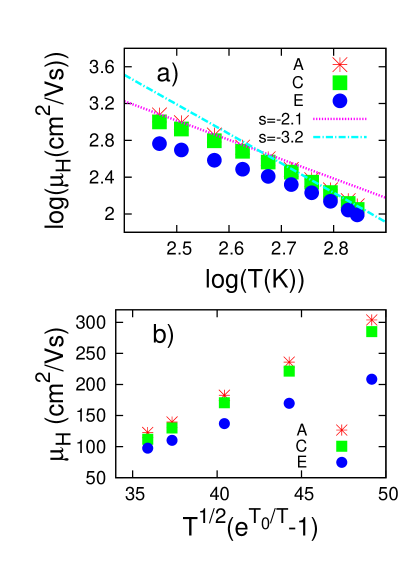
Figure 3b, presents the Hall mobility, , as a function of temperature for specimens A, C, and E. (Specimens B and D exhibit similar behavior but are not included in the discussion for clarity). The room temperature values are quite high and drop from 1200 cm2/Vs for specimen A to 600 cm2/Vs for specimen E. The decrease with doping reflects increasing e-e interactions with band filling. The high values of are not retained at high temperatures. A rapid decrease is observed that limits to 100 cm2/Vs at 700 K. The rapid decrease of is clearer on a plot where two linear regions show up, see Fig. 4. In the temperature regime K the slopes of the curves are -2. However, for 520K the slopes increase to -3. Table II, summarizes the fitting results. With increasing doping concentration the slopes assume lower values.
| 300480 K | 550750 K | ||||||
|---|---|---|---|---|---|---|---|
| A | C | E | A | C | E | ||
| -2.2 | -2.1 | -1.75 | -3.2 | -3.2 | -2.8 | ||
Electronic scattering in semiconductors gives rise to distinct temperature dependencies of the carrier mobility. Typical processes considered include: (i) electron-phonon scattering due to thermal vibrations of the lattice, (ii) ionized impurity scattering, (iii) scattering from high frequency vibrations of the lattice (optical phonons), and (iv) scattering by neutral impurities. On the assumption of parabolic bands, thermal lattice scattering causes to scale as .Shockley Non parabolicity of the bands, as in the case of Si,Pearson generally increases the value of the temperature exponent to 2-2.5.Mandelis03 In a similar fashion the low temperature exponent in Fig. 4 can be attributed to acoustical phonon scattering of electrons, in agreement with previous results on highly doped PbSe samples.Schlichting1973 The second mechanism, i.e. ionized impurity scattering, constitutes a positive contribution to mobilityAdachi2005 and is approximated as .Adachi2005 Ionized impurity scattering shows up mostly at low temperatures since the increasing thermal velocity of carriers with increasing temperature effectively screens the Coulomb potential of impurities.Adachi2005 Finally, mechanism (iv) contributes only weakly to scattering and does not have a significant temperature dependence.Pearson Therefore, in order to elucidate the behavior of the mobility at K we have to consider more complex processes such as polar optical phonon scattering.
The temperature dependence of the electron mobility due to scattering by high frequency optical phonons of the lattice follows the analysis of Fortini et al.,Fortini1970 that showed a temperature dependence of the form:
| (1) |
where, C is a constant of proportionality that involves the static and high frequency dielectric constants and the frequency of the longitudinal optical phonons, is the reduced chemical potential and is a function that assumes values from 0.65 to 1.7 depending on the excitation energy of the optical phonons. We point out that Mott and Gurney reached a surprisingly similar result, i.e. a formula containing an activation energy, from a completely different standpoint in the case of ionic polar crystals:Mott1950
| (2) |
where, is a characteristic temperature between 300 to 800 K. In Fig. 4b we present high temperature mobility data as a function of , where we define as a characteristic activation temperature corresponding to an energy of 50 meV. The linear region observed in this case indicates that complicated scattering mechanisms, possibly involving optical phonons, are at play at high temperatures.
However, the data are not conclusive as to weather an electron-optical phonon scattering is taking place. This is because in PbSe, where the lowest conduction band minimum is at the point of the first Brillouin zone (¡111¿ direction),Ravich1970 and hence is highly degenerate, phonons may scatter electrons transferring them from one valley to another.Adachi2005 This intervalley scattering mechanism can involve both acoustical and optical phonons and leads to a temperature dependence with similar characteristics as in eq. 1 and 2.Adachi2005 However, in this case many more parameters are involved such as the intervalley energy separation, the intervalley deformation potential etc.,Adachi2005 and hence a theoretical study is required to reach a definite conclusion as to the exact nature of the mobility-limiting mechanism at high temperatures. In any case, the data clearly point to deviations from simple electron phonon interactions at temperatures above 500 K and doping levels cm-3. Here we note that Schlichting et al. presented measurements of highly doped cm-3 PbSe specimens only up to 500 KSchlichting1973 which may have led to the erroneous conclusion for a simple dominant acoustical phonon scattering mechanism regardless of the doping level. At lower and K mobility data are plagued by bipolar diffusion which masks other interactions.Schlichting1973
The Seebeck coefficient, for specimens A-E is presented in Fig. 5 as a function of temperature. For all samples, i.e. for any doping level, is almost linearly decreasing from 300 to 700 K assuming higher absolute values with increasing temperature. At 300 K the absolute value of is decreasing from sample A to E consistent with increasing carrier density. The same behavior is observed at all temperatures.
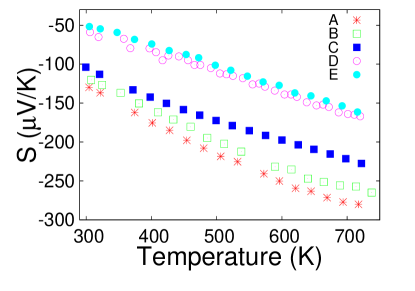
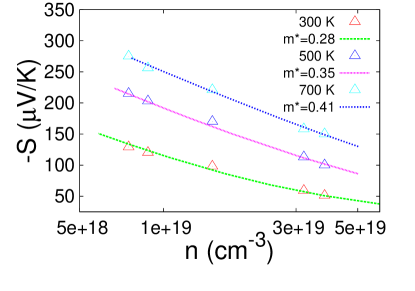
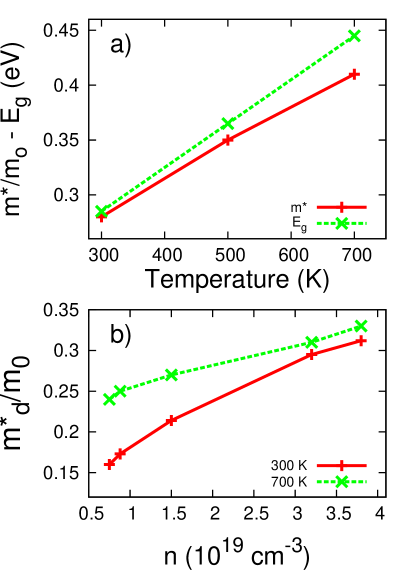
Assuming parabolic bands and an energy independent relaxation time then at any temperature is described by a unique effective mass value, , and for any the depends on the temperature dependence of .Johnsen2011 ; Fistul The aforementioned assumptions lead to simple formulas that have been explained in detail elsewhere,Johnsen2011 and can be used to construct Pisarenko plots, i.e. diagrams at different temperatures. Such plots are depicted in Fig. 6 for three different temperatures, 300 K, 500 K, and 700 K and the corresponding values 0.28, 0.35, and 0.41 that allowed fitting of the data (solid lines). The effective mass value is increasing as a result of an increasing band gap, , with increasing temperature,Ravich1970 consistent with the results of theory.Marder The temperature dependence of is plotted in Fig. 7a and compared to . For PbSe eVAndroulakisPRB11 and eV/K.Smirnov1961 It is evident that in the crude approximation of the parabolic band model follows very close the rate of the band gap increase.
As mentioned earlier, the above values are only crude approximations since the electronic band structure of PbSe close to the Fermi level is non parabolic.Parker2010 Non parabolicity pertains to a non-spherical Fermi surface shape, and hence the dispersion relation depends on the spatial direction. In general, a non parabolic energy band dispersion can be expanded in a power series:Zawadzki1974
| (3) |
where the coefficients are defined from the following relation:Zawadzki1974
| (4) |
The first order non-parabolicity approximation ignores all terms with and thus eq. 1 is greatly simplified to:
| (5) |
In this approximation the coefficient is usually taken to be equal to the inverse of the band gap, .Smirnov1967 Consequently, all galvanomagnetic coefficients can be expressed as functions of the generalized Fermi integrals defined by the equation:Zawadzki1974
| (6) |
where is the Fermi distribution function, is the reduced chemical potential, , and .
Here, we are especially concerned with the expression for . Fitting yields values that can be utilized in the calculation of other parameters in the same fashion as with assuming a parabolic band.Johnsen2011 is defined by:Zawadzki1974 ; Smirnov1967
| (7) |
Using the values extracted from fitting the data with eq. 7 and in conjunction with the expression for the carrier density (with a unity Hall factor):Zawadzki1974
| (8) |
the density of states effective mass, , can be calculated at any given pair of and values. The dependence of on is another substantial difference from the parabolic band model and is supported experimentally in lead chalcogenides.Dixon1965 ; Dixon1965b ; Aziza1970
The results of the fitting process using eq. 7 and 8 are depicted graphically in Fig. 7b for 300 K and 700 K. The extracted values are lower compared to those calculated from the parabolic band model, see Fig. 7a, but closer to 0.21, the textbook value for PbSe.Slack1995 Both at 300 and 700 K is monotonically increasing with increasing doping as discussed above.
III.2 Optical Reflectivity: independent measurement of the effective mass
The study of the reflectivity as a function of energy in the infrared part of the electromagnetic spectrum yields useful information about basic materials parameters that are related to the electronic band structure, such as the effective mass.Fox This is because the reflectivity, , depends on the contribution of both the bound and the free electrons to the real part of the complex index of refraction. Therefore, we have performed infrared reflectivity measurements in our samples as an independent, yet direct, method of probing the effective mass and thus compare the results with those of the transport models as discussed in the previous section.
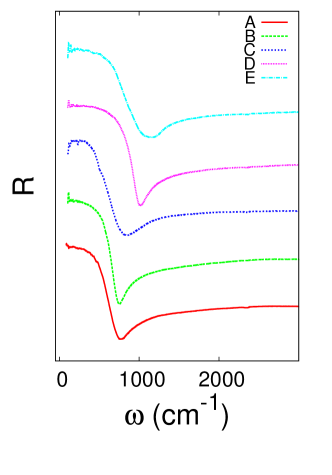
The room temperature infra red optical reflectivity as a function of incident radiation wavelength is depicted in Fig. 8 for samples A through E. It is readily seen that the minimum, associated with the plasma frequency, and hence the carrier concentration, is steadily increasing from specimen A to E reflecting the increasing doping. Accordingly, the Kramers-Kronig transformation yielded blue-shifted absorption peaks in , in the region 700 cm-1, that were used to accurately determine the plasma frequency, . The transverse optical - longitudinal optical splitting in the reflectivity spectra of PbSe occurs in the 34-114 cm-1 region.Burhkard1974 The latter makes plasmon-phonon effects negligible in the present study. Therefore, the reflectivity minima in Fig. 8 are mainly determined by the contribution of free carriers.
The plasma frequency is related to basic materials parameters, such as the electric susceptibility (or optical) effective mass, , through the relation:
| (9) |
where is the carrier concentration, is the high frequency dielectric constant (a measure of the bound electron contributions to the dielectric function), the vacuum permeability, and is the electron charge. The expression for the dependence of R on frequency, , at nearly normal incidence:
| (10) |
where is the complex dielectric function. Using the experimental R values at 3000 cm-1 and eq. 10 we calculated the value of (). We have observed that is decreasing from 25 to 17 with increasing n. However, there is no physical reason for a changing contribution of the bound electrons with n in PbSe, and thus, we have taken 25 for all samples.
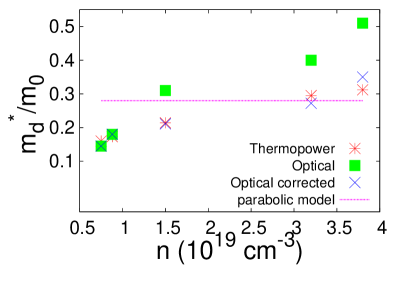
The values of (see Table I) were derived from the peak value of obtained by Kramers-Kronig transformation. Using eq. 9, with the Hall-effect extracted we have evaluated . The calculated values of can be transformed to by using the relation:Zawadzki1974 ; Aziza1970
| (11) |
where is the number of equivallent conduction band ellipsoids in the first Brillouin zone and is the ellipsoid anisotropy factor which for PbSe takes the value .Zawadzki1974 Our results are plotted in Fig. 9 as the green squares and compared to the extracted values from thermopower data analysis ( marks). We observe that the optical measurements support a strongly increasing with increasing in agreement with the non-parabolic nature of the conduction band of PbSe. The agreement between the optically extracted and charge transport extracted values is excellent for (blue marks). Obviously, the divergence of the data at high are associated with an underestimation of the values with heavy doping.
III.3 Thermal Transport
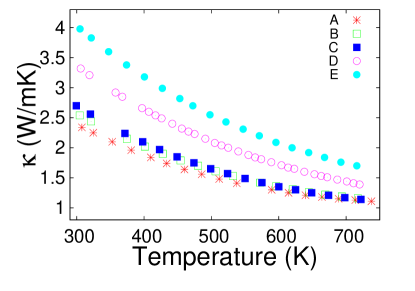
The total thermal conductivity (, where is the lattice part and the free carrier contribution) as a function of temperature is presented in Fig. 10. The room temperature values start from 2.4 W/mK for sample A and increase with increasing doping to 4 W/mK for sample E. Rising temperature increases the electron-phonon and phonon-phonon interactions which cause to decrease. Interestingly, remains above 1 W/mK at all temperatures, despite the strong mobility-reducing mechanism that is in effect above 500 K and should also limit the heat carrying efficiency of carriers. Therefore, we conclude that the latter may result from an increased lattice contribution at high temperatures, i.e. another mechanism contributing to heat conduction.
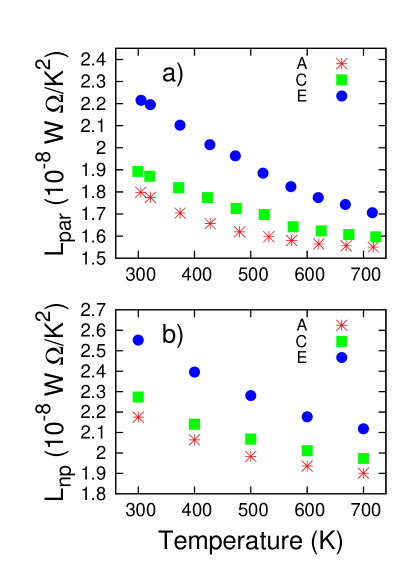
is estimated indirectly by use of the Wiedemann-Franz relation, , where is the Lorenz number and subtraction from the total. The temperature dependence of is critical in the proper calculation of . A good approximation that yields reasonable results is the assumption of a parabolic band, electron acoustic phonon interaction only and a constant relaxation time.Johnsen2011 ; AndroulakisPRB11 Figure 9a presents the results of such a calculation for samples A, C, and E. The calculated Lorenz number values are below the metallic limit ( W/) and decrease with decreasing doping and increasing temperature.
In the first-order non parabolic approximation the Lorenz number is expressed:Zawadzki1974
| (12) |
where are the integrals defined by eq. 6 and are functions of . The temperature dependence of is extracted by fitting data, see Fig. 5, with eq. 7. The results are plotted as a function of temperature in Fig. 11b. Comparing with the results of the parabolic model, it is evident that the first order non-parabolicity leads to higher Lorenz number values for the same doping level. At high doping (sample E) the room temperature value is slightly larger than that of the metallic limit, . This may be due to an inadequacy of the non-parabolicity approximation () at high doping. Both models, however, exhibit essentially the same functional dependence with respect to temperature and therefore the temperature dependence of remains the same.
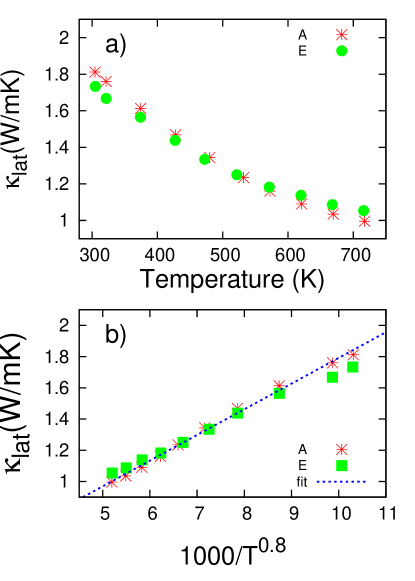
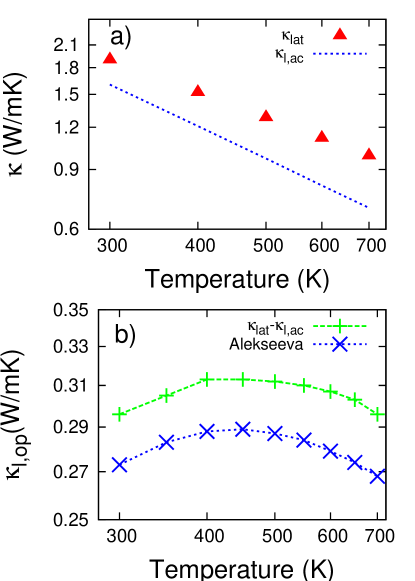
Due to the overestimation of the Lorenz number of the non-parabolic model at high doping we have used the predictions of the parabolic model to extract lattice thermal conductivity as a function of temperature. The results are depicted graphically in Fig. 12a. For clarity we use the results for samples A and E only. Curves for samples B-D have similar values and temperature dependence, leading us to conclude that is independent of doping consistent with the low concentration of PbCl2 used in this study.
Generally, the temperature behavior of when umklapp processes are dominant is . This is the case of PbTe.Alekseeva1983 In the case of PbSe, however, we find that with . In Fig. 12b is presented as a function of . The solid line is a linear fit of the data confirming the scaling behavior. In order to exclude such a behavior stemming from fitting artifacts (Lorenz number calculation) or from doping, despite the dilute Cl concentration, we grew separately a pure, undoped PbSe single crystal, here referred to as sample F in Table I. (The same crystal was also used in a previous study AndroulakisPRB11 ). The carrier concentration in the undoped crystal was determined through Hall measurements to be . In such a case the contribution of free carriers is minimized. In confirmation of the scaling behavior mentioned above the of specimen F exhibits a similar temperature dependence with and a room temperature value of 1.9 W/mK.
Usually a positive is attributed to optical phonon excitations that provide an extra heat carrying path.Steigmeier1963 ; Steigmeier1966 ; Alekseeva1983 ; Hess2004 This raises the thermal conductivity at high temperatures compared to the simple behavior. Steigmeier and Kudman, used the well known result of three-phonon processes at high temperatures:
| (13) |
in combination with temperature dependent accurate data of several III-V compounds received with the flash diffusivity - heat capacity method.Steigmeier1963 They concluded that eq. 13 (where, are the Boltzmann constant, Planck’s constant, the lattice parameter, the density, the Debye temperature, and the Grüneisen parameter respectively) is valid only when is temperature dependent, indicating the presence of optical phonons contributing to heat conduction. A similar analysis on our PbSe specimens leads to the same conclusion on . Interestingly, a more simplified model developed by Dugdale et al.Dugdale1955 with a similar physical basis as the three phonon model, was previously found adequate to describe the temperature dependence of on the assumption of a temperature dependent .AndroulakisPRB11
To separate the contribution of acoustical phonons from the we have calculated the phonon thermal conductivity by assuming a phonon scattering relaxation time Callaway1960
| (14) |
where we have considered only contributions from point defects (D index) and umklapp processes (P index). In the above is the phonon frequency. Hence the acoustical phonon contribution to takes the form:
| (15) |
where the speed of sound, the dimensionless variable of the phononic energy, is a temperature independent constant and . Since, optical phonons presumably appear at temperatures above we have used literatureRavich1970 ; Shalyt1968 values at KRavich1970 , i.e. at temperatures where only acoustical phonons dominate, to extract the constant . Subsequently , and where calculated. The results are depicted in Fig. 13a along with of sample F.AndroulakisPRB11 Evidently, there is a considerable deviation which increases with rising temperature.
Interestingly, Alekseeva et al.Alekseeva1983 have previously observed similar thermal conductivity scalings on the lighter lead chalcogenides, i.e. PbSe and PbS. The authors formulated the relationship:Alekseeva1983
| (16) |
where is the contribution of optical phonons to the lattice thermal conductivity, and are fitting constants, and and are the minimum and maximum optical phonon frequencies. Equation 16 was extracted based on experimental phonon spectra of lead chalcogenides.Alekseeva1983
The temperature dependence of the contribution of optical phonons can be calculated either by the subtraction , see eq. 15, or directly fitting with Alekseeva’s model (eq. 16). Using data received on sample F we have employed both models. Alekseeva’s model resulted in meV, meV, and W/mK. (Note that in Fig. 4b amounts to 50 meV, i.e. the average of , minimum and maximum optical phonon energies as suggested by eq. 16). The contribution of optical phonons to the total lattice thermal conductivity as a function of temperature is graphically depicted in Fig. 13b. A comparison of the results gives a rough 7 % disagreement between the values predicted by the two models at all temperatures, with Alekseeva’s model lying lower. Nevertheless, a striking similarity in the functional form of with respect to temperature is observed, where a broad peak value appears at 450 K. It is interesting that this temperature correlates with the transition temperature of the electronic Hall mobilities (see Fig. 4a) progressing from a predominant acoustical phonon scattering region (300-450 K) to a region of stronger, possibly optical phonon, scattering (T520 K). We would like to point out that the peak is not related to a maximum contribution of optical phonons. Since the contribution from acoustical phonons is rapidly decreasing () the percentage contribution of the optical phonons to the total thermal conductivity is constantly increasing with increasing temperature giving rise to the dependence.
The physical origin of the optical phonon contributions identified here is currently unknown but it may be associated with the increasing displacement of Pb atoms from the octahedron center in the rock salt structure discovered recently in PbQ (Q=S, Se, Te).Bozin2010 Interestingly, even in the heaviest lead chalcogenide, i.e. PbTe, anharmonic contributions are present in both the charge and the thermal transport properties. Feit et al.Feit1983 identified significant polar optical phonon contributions in n-type PbTe and more recently Delaire et al.Delaire2011 identified a strong coupling of the transverse optic mode with the acoustical longitudinal mode which is believed to overall keep the thermal conductivity low.Delaire2011 However, in contrast to PbS and PbSe the lattice thermal conductivity of PbTe exhibits a 1/T behavior at high temperatures, i.e. .Alekseeva1983 The above emphasize that despite their striking structural similarity and simplicity, lead chalcogenides present challenging electronic structure complexity that varies from Te to Se and likely S. In any case despite the increasing experimental evidence for significant participation of interactions involving high frequency out of phase, i.e. anharmonic, phonons in the heat conduction process in a wide and diverse variety of compoundsAndroulakisJACS11 ; Steigmeier1966 ; Alekseeva1983 ; Hess2004 ; Delaire2011 ; Morelli2008 leading to either an increase or a decrease of there is still no adequate theoretical treatment.
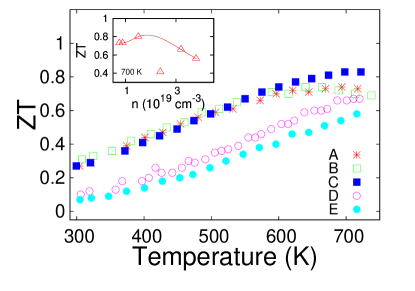
The ZT, ZT is depicted as a function of temperature in Fig. 14. The maximum value (0.8 at 700 K) is assumed for sample C (n cm-3). Given the high temperature mobility reducing mechanism, the ZT values reached here emphasize that PbSe is a promising thermoelectric material. We note that chemical substitutions on the Se sublattice with inexpensive and highly abundant S have led to ZTs as high as 1.3 at 900 K.AndroulakisJACS11
IV Concluding Remarks
We have performed a detailed study of the charge transport and thermal transport properties of n-type, Cl-doped PbSe. A strong mobility-limiting mechanism, most probably related to polar optical phonon scattering of free carriers, was shown to be in operation at high temperatures. Thermal conductivity analysis identified an extra heat carrying path in PbSe in the form of polar optical phonon excitations related to the above mobility reducing mechanism. Applying a single parabolic band model with a constant relaxation time results in oversimplifications and therefore should be applied with caution. The first order non-parabolic model, for carrier concentrations cm-3 and approximating the non-linear coefficient with the inverse of a linearly increasing band gap, was shown to describe satisfactorily basic electronic structure parameters of PbSe such as the density of states effective mass. The latter was independently extracted by optical reflectivity measurements and found to be in good agreement with the charge transport results. At high temperatures and higher carrier densities a better non-parabolic approximation of the conduction band is necessary. Finally, our results indicate a great potential of PbSe for applications as a thermoelectric material at high temperatures. The involvement of optical phonons in conducting heat at high temperatures imply that in PbSe the lattice thermal conductivity at 700-900 K is higher in relative terms than in PbTe where optical phonons are less important. Therefore, strategies for reducing thermal conductivity to raise ZT should take these findings into account and be aimed at creating optical phonon scattering mechanisms.
Acknowledgements
The authors would like to acknowledge sponsorship and scanning Seebeck measurements by ZT Plus Thermoelectric Materials (www.ztplus.com). This work was also supported as part of the Revolutionary Materials for Solid State Energy Conversion, an Energy Frontier Research Center funded by the U.S. Department of Energy, Office of Science, Office of Basic Energy Sciences under Award Number DE-SC0001054. The work at Argonne National Laboratory is supported by Department of Energy, Office of Basic Energy Sciences (Grant No. DE-AC02-06CH11357).
References
- (1) R. F. Barrow, E. E. Vago, Proc. Phys. Soc. London 56, 76 (1944).
- (2) Y. I. Ravich, B. A. Efimova, I. A. Smirnov, Semiconducting Lead Chalcogenides, edited by L. S. Stil’bans (Plenum Press, New York-London, 1970).
- (3) R. D. Schaller, V. I. Klimov, Phys. Rev. Lett. 92, 186601 (2004)
- (4) J. J. Choi, Y.-F. Lim, M. B. Santiago-Berrios, M. Oh, B.-R. Hyun, L. Sun, A. C. Bartnik, A. Goedhart, G. G. Malliaras, H. D. Abruña, F. W. Wise, T. Hanrath, Nano Lett. 9, 3749 (2009).
- (5) W. Ma, J. M. Luther, H. Zheng, Y. Wu, A. P. Alivisatos, Nano Lett. 9, 1699 (2009).
- (6) L. Zhang, D. J. Singh, Phys. Rev. B 80, 075117 (2009)
- (7) D. Parker and D.J. Singh, Phys. Rev. B 82, 035204 (2010).
- (8) H. Wang, Y. Pei, A. D. LaLonde, G. J. Snyder, Adv. Mater. 23, 1366 (2011).
- (9) J. Androulakis, Y. Lee, I. Todorov, D. Y. Chung, M. G. Kanatzidis, Phys. Rev. B 83, 195209 (2011).
- (10) J. Androulakis, I. Todorov, J. He, D. Y. Chung, V. P. Dravid, M. G. Kanatzidis, J. Amer. Chem. Soc. 133, 10920 (2011).
- (11) M. G. Kanatzidis, Chem. Mater. 22, 648 (2010).
- (12) E. Hirahara, M. Murakami, J. Phys. Soc. Jpn. 9, 671 (1954).
- (13) U. Schlichting, K. H. Gobrecht, J. Phys. Chem. Solids 34, 753 (1973).
- (14) E.A. Gurieva, L.V. Prokof’eva, Yu. I. Ravich, Kh. R. Maïlina, Sov. Phys. Semicond. 20, 1144 (1987).
- (15) G.T. Alekseeva, E.A. Gurieva, P.P. Konstantinov, L.V. Prokof’eva, M.I. Fedorov, Semiconductors 30, 1125 (1996).
- (16) M. N. Vinogradova, N. V. Kolomoets, I. M. Rudnik, L. M. Sysoeva, Sov. Phys. Semicond. 3, 231 (1969); M. N. Vinogradova, I. M. Rudnik, L. M. Sysoeva, N. V. Kolomoets, ibid 2, 892 (1969)
- (17) G.T. Alekseeva, E.A. Gurieva, P.P. Konstantinov, L.V. Prokof’eva, Yu. I. Ravich, Semiconductors 31, 446 (1997).
- (18) ZT is defined as , where is the Seebeck coefficient, the electrical conductivity and the total thermal conductivity.
- (19) M. Fox, Optical Properties of Solids (Oxford University Press, 2010).
- (20) B. Abeles, S. Maiboom, Phys. Rev. 95, 31 (1954).
- (21) W. Zawadzki, Adv. Phys. 23, 435 (1974).
- (22) W. Schockley, Electrons and Holes in Semiconductors (D. Van Norstrand Co. Inc., New York, 1950).
- (23) G. L. Pearson, J. Bardeen, Phys. Rev. 75, 865 (1949).
- (24) J. Batista, A. Mandelis, D. Shaughnessy, Appl. Phys. Lett. 82, 4077 (2003).
- (25) S. Adachi, Properties of Group-IV, III-V and II-VI Semiconductors (John Wiley & Sons, 2005).
- (26) A. Fortini, D. Diguet, J. Lugand, J. Appl. Phys. 41, 3121 (1970).
- (27) N. F. Mott, R. W. Gurney, Electronic Processes in Ionic Crystals, 2nd edition (Oxford Press, 1950).
- (28) S. Johnsen, J. He, J. Androulakis, V. P. Dravid, I. Todorov, D.-Y. Chung, M. G. Kanatzidis, J. Am. Chem. Soc. 133, 3460 (2011).
- (29) V. I. Fistul’, Heavily doped semiconductors (Plenum Press, New York, 1969).
- (30) M. P. Marder, Condensed Matter Physics (John Wiley & Sons, 2000).
- (31) I. A. Smirnov, B. Y. Moizhes, E. D. Nensberg, Sov. Phys. Solid State 2, 1793 (1961).
- (32) I. A. Smirnov, Yu. I. Ravich, Sov. Phys. Semicond. 1, 739 (1967).
- (33) J. R. Dixon, H. R. Riedl, Phys. Rev. 138, A873 (1965).
- (34) J. R. Dixon, H. R. Riedl, Phys. Rev. 140, A1283 (1965).
- (35) A. Aziza, E. Amzallag, M. Balkanski, Solid State Commun. 8, 873 (1970).
- (36) G. A. Slack, in CRC Handbook of thermoelectrics, edited by D. M. Rowe (CRC press, Boca Raton, 1995), chpt. 34.
- (37) H. Burhkard , R. Geick, P. Kastner, K.-H. Unkellbach, phys. stat. sol. b 63, 89 (1974).
- (38) T. Grandke, M. Cardona, L. Ley, Solid State Commun. 32, 353 (1979).
- (39) S. A. Nemov, T. A. Gavrikova, V. A. Zykov, P. A. Osipov, V. I. Proshin, Semiconductors 32, 689 (1998).
- (40) V. I. Kaĭdanov, R. B. Mel’nik, N. V. Germanas, Sov. Phys. Semicond. 6, 627 (1972).
- (41) L. V. Prokof’eva, E. A. Gurieva, Sh. I. Zhumaksanov, P. P. Konstantinov, Kh. R. Maïlina, Yu. I. Ravich, L. S. Stil’bans, Sov. Phys. Semicond. 21, 1078 (1987).
- (42) V. I. Kaĭdanov, S. A. Nemov, Yu. I. Ravich, Sov. Phys. Semicond. 26, 113 (1992).
- (43) E. F. Steigmeier, I. Kudman, Phys. Rev. 132, 508 (1963).
- (44) E. F. Steigmeier, I. Kudman, Phys. Rev. 141, 767 (1966).
- (45) G. T. Alekseeva, E. T. Krylov, Sov. Phys. Solid State 25, 2140 (1983).
- (46) C. Hess, B. Büchner, Eur. Phys. J. B 38, 37 (2004).
- (47) J. S. Dugdale, D. K. C. MacDonald, Phys. Rev. 98, 1751 (1955).
- (48) J. Callaway, H. C. Von Baeyer, Phys. Rev. 120, 1149 (1960).
- (49) S. S. Shalyt, V. M. Muzhdaba, A. D. Galetskaya, Sov. Phys. Solid State 10, 1018 (1968).
- (50) E. Bozin, C. D. Malliakas, P. Souvatzis, T. Proffen, N. A. Spaldin, M. G. Kanatzidis, S. J. L. Billinge, Science 330, 1660 (2010).
- (51) Z. Feit, A. Zemel, D. Eger, S. Szapiro, Phys. Lett. 98A, 451 (1983)
- (52) O. Delaire, J. Ma, K. Marty, A. F. May, M. A. McGuire, M-H. Du, D. J. Singh, A. Podlesnyak, G. Ehlers, M. D. Lumsden, B. C. Sales, Nat. Mater. doi:10.1038/nmat3035 (2011).
- (53) D. T. Morelli, V. Jovovic, J. P. Heremans, Phys. Rev. Lett. 101, 035901 (2008).