Present address: ]Department of Chemistry, Graduate School of Science, Kyoto University, Kyoto, 606-8502, Japan
Magnetic phases of a highly frustrated magnet, ZnCr2O4, up to an ultra-high magnetic field of 600 T
Abstract
The Faraday rotation and magneto-optical absorption spectral measurements were conducted to reveal the full-magnetization process and map out a magnetic phase diagram of a typical geometrical frustrated magnet, ZnCr2O4, by using the electromagnetic flux compression method in ultra-magnetic fields up to 600 T. A fully polarized ferromagnetic phase is observed in which the absorption spectra associated with an exciton-magnon-phonon transition disappears. Furthermore, prior to the fully polarized ferromagnetic phase above 410 T, we found a novel magnetic phase above 350 T followed by a canted 3:1 phase.
pacs:
75.30.Kz, 75.50.Ee, 78.20.LsGeometrically frustrated magnet systems have been a fascinating subject for decades because they have macroscopically degenerated ground states vulnerable to tiny perturbations (spin-lattice interaction, quantum and thermal fluctuation, etc.), which leads to the emergence of exotic magnetic states moessner02 ; chubukov91 . Interestingly, magnetic fields also cause the appearance of peculiar magnetic phenomena such as the magnetization plateau kageyama99 ; okamoto11 , magnetic supersolid miyata11 and crystalline magnon state tsunetsugu04 due to competition between a magnetic field and frustrated spin exchange interaction. In order to understand the essence of the geometrical frustration, it is indispensable to conduct magnetization measurements up to full magnetization. Most geometrically frustrated magnets show , where and are the Neel temperature and the Curie-Weiss temperature, respectively, because geometrical frustration suppresses the occurrence of a magnetic order. This inequality is the main reason that investigating the full-magnetization processes of geometrically frustrated magnets has required multiple extreme conditions, such as a high magnetic field and extremely low temperature kageyama99 ; okamoto11 . Here, we developed magnetization measurements by the Faraday rotation method and magneto-optical absorption spectral measurements in photo-wavelengths in the visible light range in magnetic fields up to 600 T and at temperatures down to 5 K by the electro-magnetic flux compression (EMFC) method takeyama10 . Geometrically frustrated magnets mainly consist of transition metal ions, and d-d transitions and the transitions associated with them, such as exciton-magnon transitions, are sensitive to the transformation of crystal and magnetic structures. In addition, most of these transitions can be observed in wavelengths in the visible light range. We applied the magneto-optical methods to a typical three-dimensional geometrically frustrated magnet with a pyrochlore lattice, ZnCr2O4 ( K and K) lee00 ; lee02 , and revealed the full-magnetization processes at different temperatures.
Cr3+ ions in a chromium spinel oxide, Cr2O4 (=Zn, Cd, Hg), reside on a pyrochlore lattice, and therefore these compounds are regarded as a candidate for the three-dimensional frustrated magnet. Magnetization measurements in these compounds have revealed various magnetic phases, including a robust 1/2 plateau phase miyata11 ; ueda05 ; ueda06 ; kojima08 . Penc et al. suggested that a spin-lattice interaction plays a key role in determining the magnetic phases under magnetic fields in these compounds penc04 . The observed magnetization data of HgCr2O4 and CdCr2O4 showed a fairly good agreement with those of the theory with taking account of a large spin lattice coupling parameter, i.e., ueda06 ; kojima08 ; motome06 . Whereas, when is small which is the case for ZnCr2O4 (), the theory predicted the realization of new phase, the canted 2:1:1 phase. This is what we have actually found at a lower magnetic field side of the 1/2 plateau phase miyata11 . ZnCr2O4 approaches an ideal frustrated magnet with only a nearest neighbor exchange interaction, compared with other sister compounds. The magnetization processes of an ideal frustrated pyrochlore antiferromagnet () have been unclear both experimentally and theoretically. In addition, S. Kimura et al. recently reported that another phase might exist between a canted 3:1 phase and the ferromagnetic phase in HgCr2O4, and the magnetic phases would be more complicated than those by the theory with a spin-lattice coupling kimura11 . Therefore, full-magnetization measurements of ZnCr2O4 are needed.
Recently, we developed a copper-lined coil for the EMFC method, which enabled us to generate a magnetic field of over 700 T takeyama10 . We applied this system to measurements of solid-state physics combined with a low-temperature apparatus. We employed a hand-made liquid-He flow-type miniature cryostat made completely of “stycast” resin, and achieved a temperature down to 5 K miyata11 . The sample temperature was monitored by an Au-Fe/Chromel thermocouple attached adjacent to the sample, but the value could be higher than the actual sample temperature by about 1 – 2 K due to the temperature gradient between the sample and the thermocouple. The values of magnetic fields were measured by a calibrated pick-up coil wound at the vicinity of the sample. The estimated error of the magnetic field was about 3. A single crystal of ZnCr2O4 was grown by a vapor transport technique. The sample was cut parallel to the (111) crystal surface, attached on a quartz substrate and polished to a thickness of about 100 m for the Faraday rotation measurement or 50 m for optical transmission measurements, and the diameter of the sample was about 1.5 mm. The Faraday rotation measurement was performed in a manner similar to the measurement described in Ref. miyata11 . A semiconductor laser (a Coherent “Cube”) of 635 nm wavelength was used as a light source. The incident light was linearly polarized to the horizontal axis. The transmitted light was separated into vertical () and horizontal () components by a Wollaston prism. The Faraday rotation angle of the sample () was determined by subtraction of the diamagnetic contribution from the sample and a quartz substrate from the raw data of . The magneto-optical absorption spectra measurements were performed using a streak camera system coupled with a CCD detector and a polychromater. A Xe arc-flash lamp was used as a light source and light was guided into and out of the sample by optical fibers as shown in Ref. miura98 .
In Fig. 1, we obtained the Faraday rotation angle of the sample, which showed good agreement with that by the single-turn coil (STC) method up to 190 T. We could obtain the magneto-optical absorption derived from the intensity of the monochromatic transmitted light in our experimental setup while measuring the Faraday rotation. In a magnetization curve, we clearly observed the transition into a ferromagnetic phase with a saturated magnetization moment of 3 at 410 T, and no clear anomaly was observed between 410 T and 160 T above the transition field from a 1/2 plateau phase to a canted 3:1 phase miyata11 . The slope of magnetization in the antiferromagnetic phase between 0 T and 120 T was larger than that in the canted 3:1 phase above 160 T. This is a point of difference from that in the theory taking into account the spin-lattice coupling by K. Penc et al. and D. L. Bergman et al. penc04 ; bergman06 . This discrepancy implies that the exchange interactions should change due to lattice distortion associated with a magnetic phase transition, which agrees with the idea that the 1/2 plateau phase exists widely even above the Neel temperature ( K), as described in Ref. miyata11 .
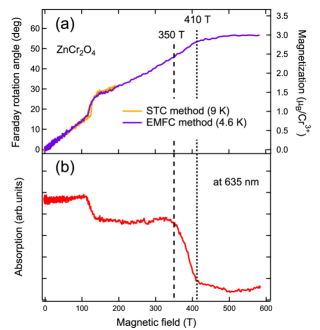
On the other hand, we observed a rapid decrease of absorption between 350 T and 410 T. The absorption peak corresponding to a laser wavelength of 635 nm arises from both a d-d transition () and an exciton-magnon-phonon (EMP) transition in Cr3+ szy80 . The energy and spectrum shape of these transitions are sensitive to the crystal and magnetic structures. Apparently, the anomaly at 120 T of the absorption is related to lattice distortion caused by a first-order transition from the antiferromagnetic phase to the canted 2:1:1 phase. Likewise, the rapid decrease of absorption between 350 T and 410 T implies a change in the crystal or magnetic structure. According to our recent work, there exists a canted 3:1 phase above 160 T miyata11 , and the theories of K. Penc et al. and D. L. Bergman et al. allow no magnetic phases other than the ferromagnetic phase to exist in magnetic fields higher than a canted 3:1 phase penc04 ; bergman06 . Therefore, the present data are indicative of the certain existence of a novel phase which has not yet been predicted by the conventional theories. To clarify this behavior, we investigated the temperature dependence of the magnetization and magneto-optical absorption measurements.
Figure 2 shows the magnetization curve and magneto-optical absorption change in 635 nm at 4.6 K, 8.0 K and 9.3 K, respectively. In the magnetization curve, we observed the transition to the ferromagnetic phase at 330 T at 8.0 K, and no clear anomaly was observed at 9.3 K. This transition point shifted toward a lower magnetic field with increasing temperature. In addition, a decrease of the absorption at 295 T at 8.0 K and at 270 T at 9.3 K were observed, and the field at which the absorption decreased shifted lower as the temperature increased.
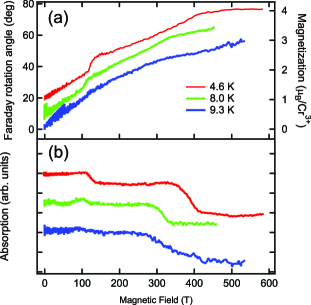
Figure 3 (a) shows the absorption spectra arising from a d-d transition () and an EMP transition in Cr3+ in several magnetic fields obtained from streak spectroscopy. The inset in Fig. 3 (a) presents absorption spectra taken at 0 T with a wider wavelength region covering three absorption peaks ( transition, transition and an EMP transition in Cr3+). Figure 3 (b) presents the absorption intensity change in magnetic fields at several chosen wavelengths taken from Fig. 3 (a) and also from the absorption obtained in the Faraday rotation measurement. The absorption obtained by the streak spectroscopy at a wavelength of 635 nm and that obtained in the Faraday rotation method ( nm, dotted arrow shown in Fig. 3 (a)) show good agreement. We observed an almost complete suppression of the absorption peak arising from an EMP transition when the magnetic field increased up to a region of the fully-polarized ferromagnetic phase. A d-d transition with (exciton, ), and magnon excitation with were simultaneously excited to conserve the spin momentum in the process of EMP transition. However, the magnon with could not be excited in the fully-polarized ferromagnetic phase, and therefore the EMP transition disappeared, which explains the rapid decrease of absorption observed in Fig. 2 (b).
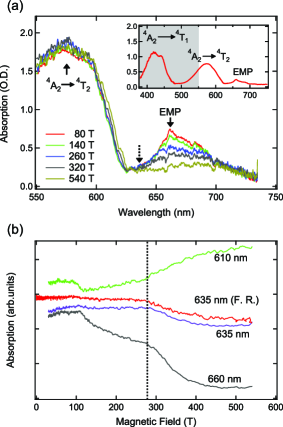
Moreover, we observed an anomalous increase of the intensity in the magneto-optical absorption measured at the tail of the transition synchronized with a decrease of the intensity of the exciton-magnon-phonon transition at 270 T (the dotted line shown in Fig. 3 (b)). This suggests some changes in the crystal structure at 270 T. Previous theoretical bergman06 and experimental matsuda07 ; matsuda10 works reported that the space group symmetry of the 1/2 plateau state in chromium spinel oxides is universally symmetry, and that the canted 3:1 phase should be at least as low as the symmetry. symmetry could be restored to symmetry before or at saturation field, since a fully polarized ferromagnetic state has an ideal pyrochlore symmetry bergman06 . Our results at 270 T shown in Fig. 3 (b) present the possibility of a transition into a partially-polarized ferromagnetic state with higher space group symmetry than symmetry. S. Kimura et al. have pointed out by high magnetic field ESR study the possibility of a novel phase between the canted 3:1 phase and the ferromagnetic phase in HgCr2O4, where symmetry was higher than symmetry kimura11 . Furthermore, V. Tsurkan et al. reported ultrasound studies on a similar compound, ZnCr2S4 in high magnetic fields, and insisted that this material should show subsequent lattice transformations as a bond frustrated magnet, despite the absence of any anomalies observed in the magnetization curves tsurkan11 . In their results, reflecting the importance of the spin-lattice coupling, the structural phase transition from the tetragonal to cubic phase with a partially-polarized ferromagnetic phase took place at the vicinity of the saturation field, and then the magnetic transition to the fully-polarized ferromagnetic phase occurred at the saturation field. Their results are similar to ours at the vicinity of the saturation field. These findings imply that a transition from a canted 3:1 state to a partially-polarized ferromagnetic state with higher crystal symmetry than occurs at a magnetic field of 350 T, and then at 410 T a magnetic phase transition results in the fully-polarized ferromagnetic phase as shown in Fig. 1. This novel magnetic phase has never been predicted by existing theories. Higher-order exchange interactions among the distant sublattices, and/or more complex spin-lattice interactions could be responsible for the appearance of the novel phase.
We have discussed a physical analogy of the magnetic phase diagram of ZnCr2O4 to that in 4He proposed by H. Matsuda and T. Tsuneto matsuda70 and K.-S. Liu and M. E. Fisher liu73 in Ref. miyata11 . The canted 3:1 phase observed in the case of ZnCr2O4 corresponds to a supersolid state and the ferromagnetic (or paramagnetic) phase to a liquid state. The supersolid (intermediate) state could only exist between the solid and the superfluid state in the phase diagram matsuda70 ; liu73 . Thus, the partially-polarized ferromagnetic phase between 350 T and 410 T is naturally inferred as a superfluid state from the analogy described above. A direct transition from a ferromagnetic (i.e., liquid) phase to a canted 3:1 (i.e., supersolid) phase requires a simultaneous breaking of the translational and the spin rotational symmetry, which could take place with less probability.
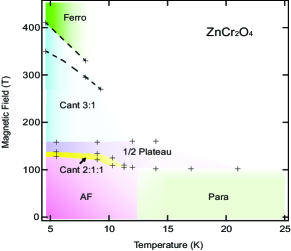
Figure 4 shows a field-temperature phase diagram constructed from the data in Fig. 2 and the data obtained by the STC method in our previous paper miyata11 . The cross symbols indicate transition points observed by the Faraday rotation method and the broken line shows anomalies observed in the magneto-optical absorption by the Faraday rotation method. Between the broken lines, there should exist a novel magnetic phase. As the temperature increases, a rapid decrease is observed in the magnetic field at which the phase transition takes place between the canted 3:1 phase and the ferromagnetic phase. A similar behavior is observed in other sister materials, CdCr2O4 and HgCr2O4, but the decrease is most pronounced in ZnCr2O4. Thermal fluctuation favors the collinear magnetic structure in the 1/2 plateau phase, or the so-called entropy-driven “order-by-disorder” effect kawamura84 ; zhitomirsky02 . This effect becomes pronounced in the small limit of the spin-lattice coupling, and is discussed in Ref. miyata11 . The same discussion applies equally to the present case for the ferromagnetic phase.
The Faraday rotation and magneto-optical absorption spectra measurements conducted in an ultra-high magnetic field up to 600 T revealed the full-magnetization processes of ZnCr2O4, and a magnetic phase diagram was obtained. We found anomalies in the absorption spectra as a function of the magnetic field, which implied the certain existence of a novel phase between a canted 3:1 phase and the ferromagnetic phase, corresponding to the superfluid state in the analogy of 4He. This phase should have higher symmetry than the one with a partially-polarized ferromagnetic structure, and will require a more sophisticated model to interpret. Magneto-absorption was found to be a good tool to detect magnetic phase transitions which are insensitive to the magnetization data.
References
- (1) O. Tchernyshyov et al., Phys. Rev. Lett. 88, 067203 (2002).
- (2) A. V. Chubukov and D. I. Golosov, J. Phys. Condens. Matter 3, 69 (1991).
- (3) H. Kageyama et al., Phys. Rev. Lett. 82, 3168 (1999).
- (4) Y. Okamoto et al., Phys. Rev. B 83, 180407(R) (2011).
- (5) A. Miyata et al., J. Phys. Soc. Jpn. 80, 074709 (2011).
- (6) M. E. Zhitomirsky and H. Tsunetsugu, Phys. Rev. B 70, 100403(R) (2004).
- (7) S. Takeyama et al., J. Low Temp. Phys. 159, 328 (2010).
- (8) S.-H. Lee et al., Phys. Rev. Lett. 84, 3718 (2000).
- (9) S.-H. Lee et al., Nature (London) 418, 856 (2002).
- (10) H. Ueda et al., Phys. Rev. Lett. 94, 047202 (2005).
- (11) H. Ueda et al., Phys. Rev. B 73, 094415 (2006).
- (12) E. Kojima et al., Phys. Rev. B 77, 212408 (2008).
- (13) K. Penc et al., Phys. Rev. Lett. 93, 197203 (2004).
- (14) Y. Motome et al., J. Magn. Magn. Mater. 300, 57 (2006).
- (15) S. Kimura et al., Phys. Rev. B 83, 214401 (2011).
- (16) N. Miura et al., Physica B 256–258, 308 (1998).
- (17) D. L. Bergman et al., Phys. Rev. B 74, 134409 (2006).
- (18) H. Szymczak et al., J. Magn. Magn. Mater. 15–18, 841 (1980).
- (19) M. Matsuda et al., Nature Phys. 3, 397 (2007).
- (20) M. Matsuda et al., Phys. Rev. Lett. 104, 047201 (2010).
- (21) V. Tsurkan et al., Phys. Rev. Lett. 106, 247202 (2011).
- (22) H. Matsuda and T. Tsuneto: Prog. of Theor. Phys. Supplement 46 (1970) 411.
- (23) K. S. Liu and M. E. Fisher: J. Low Temp. Phys. 10 (1973) 655.
- (24) H. Kawamura and S. Miyashita, J. Phys. Soc. Jpn. 54, 4530 (1985).
- (25) M. E. Zhitomirsky, Phys. Rev. Lett. 88, 057204 (2002).