A Rotating Disk in the HH 111 Protostellar System
Abstract
The HH 111 protostellar system is a young Class I system with two sources, VLA 1 and VLA 2, at a distance of 400 pc. Previously, a flattened envelope has been seen in C18O to be in transition to a rotationally supported disk near the VLA 1 source. The follow-up study here is to confirm the rotationally supported disk at 23 times higher angular resolutions, at (or 120 AU) in 1.33 mm continuum, and (or 240 AU) in 13CO () and 12CO () emission obtained with the Submillimeter Array. The 1.33 mm continuum emission shows a resolved dusty disk associated with the VLA 1 source perpendicular to the jet axis, with a Gaussian deconvolved size of 240 AU. The 13CO and 12CO emissions toward the dusty disk show a Keplerian rotation, indicating that the dusty disk is rotationally supported. The density and temperature distributions in the disk derived from a simple disk model are found to be similar to those found in bright T-Tauri disks, suggesting that the disk can evolve into a T-Tauri disk in the late stage of star formation. In addition, a hint of a low-velocity molecular outflow is also seen in 13CO and 12CO coming out from the disk.
1 Introduction
Stars are formed inside molecular cloud cores by means of gravitational collapse. The details of the process, however, are complicated by the presence of magnetic fields and angular momentum. In particular, for the stars to form, collapsing material has to lose most of the magnetic fields and angular momentum. As a result, in addition to infall (or collapse), rotation and outflow are also seen toward star-forming regions. In theory, a rotationally supported disk is expected to form inside a collapsing core around a protostar, from which part of the material is accreted by the protostar and part is ejected away. Observationally, however, when and how a rotationally supported disk is actually formed are still unclear, because of the lack of detailed kinematic studies inside the collapsing core.
This paper is a follow-up study of the HH 111 protostellar system, which is a well-studied Class I system deeply embedded in a compact molecular cloud core in the L1617 cloud of Orion at a distance of 400 pc. This system has a bolometric temperature K and thus has just transitioned to the Class I phase from the Class 0 phase (Froebrich, 2005). At the center of this system, there are two sources, VLA 1 and VLA 2, with a projected separation of (1200 AU) (Reipurth et al., 1999). Previously, a flattened envelope has been seen in C18O around the VLA 1 source (Lee et al 2009, hereafter Paper I) and it seems to be in transition to a rotationally supported disk near the VLA 1 source (Lee et al 2010, hereafter Paper II). The follow-up study here is to confirm the rotationally supported disk at 23 times higher angular resolutions, at (or 120 AU) in 1.33 mm continuum, and (or 240 AU) in 13CO () and 12CO () emission obtained with the Submillimeter Array (SMA)111The Submillimeter Array is a joint project between the Smithsonian Astrophysical Observatory and the Academia Sinica Institute of Astronomy and Astrophysics, and is funded by the Smithsonian Institution and the Academia Sinica. (Ho et al., 2004). This study also shows that the physical properties of the disk here in the early phase of star formation can be similar to those of the bright T-Tauri disks in the late phase of star formation (Andrews et al., 2009).
2 Observations
Observations toward the HH 111 system were carried out with the SMA, first on 2005 December 5 in the compact-north configuration (Paper I ), then on 2010 January 24 in the extended configuration and on 2010 March 26 in the sub-compact configuration (Paper II, ), and then on 2011 Jan 01 in the very extended configuration. The baselines have projected lengths ranging from 10 to 480 m onto the sky. The 230 GHz band receivers were used to observe the 12CO (), 13CO (), C18O (), and SO () lines simultaneously with the 1.33 mm continuum. The 12CO and 13CO lines are bright and thus are presented here to show the kinematics of the inner region and search for the rotationally supported disk around the VLA 1 source at high resolution. The velocity resolution in these lines is 0.28 km s-1 per channel, similar to that of C18O presented in Paper II . The visibility data were calibrated with the MIR package. The flux uncertainty was estimated to be 15%. The calibrated visibility data in different configurations were combined and then imaged with the MIRIAD package, as described in Paper II . With various different weightings, the synthesized beams can have a size from down to . The rms noise levels are 0.036 Jy beam-1 in the 12CO channel maps with a beam of , 0.032 Jy beam-1 in the 13CO channel maps with a beam of , and 0.9 mJy beam-1 in the continuum map with a beam of . The velocities in the channel maps are LSR.
3 Results
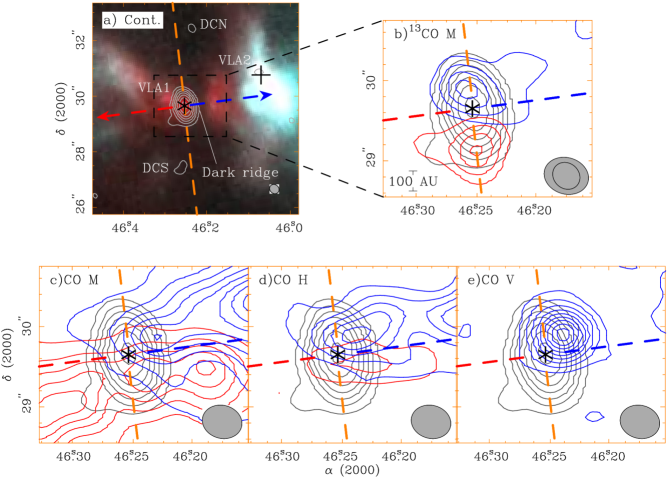
As in Paper II , the results are presented in comparison to a mosaic image based on the Hubble Space Telescope (HST) NICMOS image ([FeII] 1.64 m + H2 at 2.12 m + continuum) obtained by Reipurth et al. (1999), which shows the two sources VLA 1 and VLA 2 in the infrared, and the reflection nebulae that trace the illuminated outflow cavity walls. The two sources are located at , (Rodríguez et al., 2008) and , , respectively (Reipurth et al., 1999; Rodríguez et al., 2008). The jet is bipolar with a western and an eastern component. It has a position angle (P.A.) of 97∘ and an inclination angle of 10∘, with the western component being blueshifted and tilted toward us (Reipurth, Raga, & Heathcote, 1992). The systemic velocity in this system is assumed to be 8.900.14 km s-1 LSR, as before. Throughout this paper, the velocity is relative to this systemic value.
3.1 1.33 mm Continuum Emission
As shown in Figure 1a, the continuum emission associated with the VLA 1 source is now resolved into a disk-like structure perpendicular to the jet axis, with a Gaussian deconvolved (FWHM) size of ( 240120 AU) and a P.A. of 7.6∘. As found in Paper II , this emission has a total flux of 28540 mJy and it is the thermal emission mainly from a dusty disk, with the inner part of which already seen with a deconvolved size of (60 AU) at 7 mm (Rodríguez et al., 2008). Note that the emission seems to show a little faint protrusion to the east along the jet axis. This faint protrusion seems to be seen in 3.6 cm and 7 mm as well, and it may trace either the material along the jet axis or a disk around a companion in a close binary system as suggested in Rodríguez et al. (2008). In addition, a faint protrusion is also seen extending to the southeast from the southern part of the disk. As in Paper II , faint emission is also detected around the VLA 2 source ( 4 detection with 1 mJy beam-1), probably tracing a disk around it. Moreover, two more faint emission peaks DCN and DCS are seen at in the north and in the south respectively near the equatorial plane (P.A. 7∘), probably tracing the density enhancement there.
3.2 Previous Results of Envelope and Outflow in C18O
Previously in the C18O observations (Paper II, ), a flattened envelope is seen perpendicular to the jet axis, extending to 7200 AU () out from the VLA 1 source. It is rotating, with the blueshifted emission in the north and the redshifted emission in the south. The outer part (20007200 AU, or –) seems to have a rotation that has constant specific angular momentum with km s-1, while the inner part ( 602000 AU, or –) seems to have a Keplerian rotation with km s-1, where is the radial distance from the source in the unit of arcsecond. Outflow is also seen in C18O, with the blueshifted emission extending to the west and the redshifted emission extending to the east.
3.3 Line Emission
The 13CO and 12CO lines are detected toward the VLA 1 source upto 4.2 km s-1 and 10 km s-1, respectively, from the systemic velocity. In order to show how the envelope and disk structure changes with velocity, the line emission is divided into four velocity ranges: low (02.5 km s-1), medium (2.54.2 km s-1), high (4.25.8 km s-1), and very high (5.810 km s-1) velocity ranges, on the redshifted and blueshifted sides.
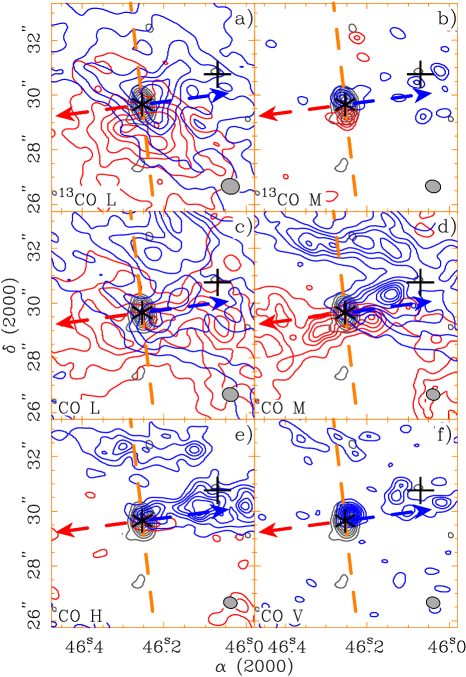
In 13CO, at low velocity, the redshifted emission is detected mainly in the south and the blueshifted emission is mainly in the north of the VLA 1 source (Fig. 2a), consistent with a rotation motion about the source. As seen in C18O, the emission is contaminated by the outflow emission, with the blueshifted emission also extending to the west and the redshifted emission also extending to the east. In addition, the blueshifted emission shows a V-shaped structure opening to the north, spatially coincident with the cavity walls traced by the reflection nebulae, suggesting that the envelope material is piling up on the cavity walls as the cavity walls expand into the envelope. A similar V-shaped structure is also seen opening to the south in the redshifted emission. At medium velocity, the 13CO emission shrinks to the source, spatially coincident with the dusty disk (Fig. 2a and Fig. 1b for a zoom-in). The blueshifted emission peak is to the north and the redshifted emission peak is to the south in the equatorial plane, indicating that the motion there is highly dominated by the rotation about the VLA 1 source, as expected for a rotationally supported disk. The two peaks, however, are not symmetric about the source, with the northern peak at a distance of and southern peak at . Two faint protrusions are also seen, one in the blue extending to the west from the northern part of the disk and one in the red extending to the east from the southern part, parallel to the jet axis. These structures are similar to those seen in the rotating molecular outflow in CB 26 (Launhardt et al., 2009), and thus may trace material outflowing from the disk.
In 12CO, at low velocity, the blueshifted emission is mainly to the north and the redshifted emission is mainly to the south, with V-shaped structures coincident with the cavity walls (Fig. 2c), similar to that seen in 13CO. At medium velocity, the blueshifted emission extends to the west from the northern part of the disk while the redshifted emission extends to both the west and east from the southern part of the disk (Fig. 2d and Fig. 1c for a zoom-in). Note that the blueshifted emission and the redshifted emission beyond from the source are contaminated by the outflow shell emission, showing a cone-like structure with the tip pointing toward the source. The blueshifted emission also shows an E-W elongation at in the north (Fig. 2d), with an unknown origin. At high velocity, the blueshifted and redshifted emissions extend out from the inner radii of the disk (Fig. 2e and Fig. 1d for a zoom-in). The emissions within from the source are not much contaminated by the outflow shell emission, which is expected to be further away from the source at higher velocity. They extend to the west, first opening from the VLA 1 source and then bent to be aligned with the jet axis. They also extend slightly to the east. The blueshifted emission is mainly to the north of the jet axis and the redshifted emission is mainly to the south, with the velocity sense the same as that of the rotation in the disk, and thus may trace the material coming out from the disk. Note that, in the west, the blueshifted emission also extends slightly to the south. At very high velocity, only blueshifted emission is detected with a peak slightly away from the equatorial plane at to the west (Fig. 2f and Fig. 1e for a zoom-in). This emission peak is spatially coincident with the blueshifted emission peak seen at high velocity in Figure 1d, suggesting that the emission there has a broad range of velocities from high to very high and may trace a shock interaction, either inside the disk or outside.
3.3.1 Rotation motion near the VLA 1 source
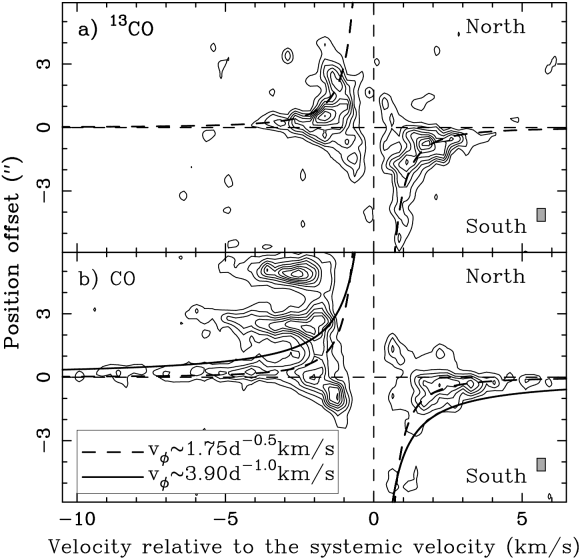
As seen in the last section, the inner part of the envelope can also be traced by 13CO and 12CO, allowing us to check and confirm the Keplerian rotation law near the source seen in C18O. Figure 3 shows the position-velocity (PV) diagrams of the envelope and disk in 13CO and 12CO cut along the equatorial plane perpendicular to the jet axis. In 13CO, the emission within 1 km s-1 from the systemic velocity is mainly resolved out and affected by the outflow emission, and thus should be excluded for studying the rotation law. As can been seen, the velocity structure beyond 1 km s-1 roughly follows the Keplerian rotation law seen in C18O. In 12CO, the emission within 2 km s-1 from the systemic velocity is mainly resolved out and affected by the outflow emission, and thus should also be excluded for studying the rotation law. In addition, as seen in the emission map (Fig. 2d and e), the blueshifted emission is also detected at to in the north with a velocity ranging from 2 to 6 km s-1 w.r.t. the systemic velocity. This emission is unclear, and it may trace some interaction in the envelope or something in the foreground or background, and thus should also be excluded. In this line, on the redshifted side, the emission is detected up to 6 km s-1, higher than that seen in 13CO, arising from the inner region as seen in Figure 1d. The velocity structure also follows the Keplerian rotation law to that high velocity to the inner region. On the blueshifted side, the emission is detected up to 10 km s-1 from the systemic, much higher than that on the redshifted side. However, as can be seen, the emission beyond 5 km s-1 is localized with a broad range of velocities and it corresponds to the localized emission at to the west as seen in the emission map (Fig. 1e). Since this emission can trace a local shock interaction, the blueshifted emission should not be used to derive the rotation law. As a result, the rotation structure near the source seen in 12CO is also consistent with that seen in C18O.
4 Model the disk continuum emission
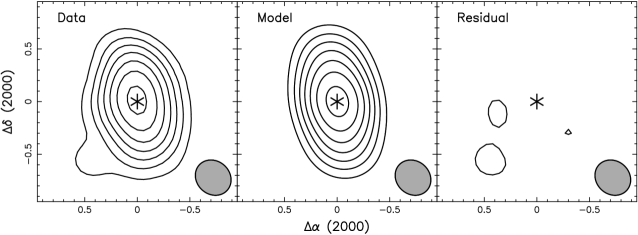
Here a simple disk model is used to fit the structure and intensity distribution of the continuum emission in order to derive the temperature and density distributions of the dusty disk. Note that, the emission that extends to the east along the jet axis and the emission that extends to the southeast from the southern part of the disk are not from the disk perpendicular to the jet axis and are thus excluded from the model.
For simplicity, the disk in the model is assumed to be flat with a constant thickness of , an inner radius of , and an outer radius of . The disk is assumed to be perpendicular to the jet axis and thus have an inclination angle of 10∘ to the line of sight, with the nearside tilted to the east (Reipurth, Raga, & Heathcote, 1992). It has a position angle of 7.6∘ as given by the Gaussian source deconvolution earlier in Section 3.1. The temperature is assumed to be given by
| (1) |
where (120 AU), which is the radius (i.e., the half of the size) of the disk derived earlier from the Gaussian source deconvolution, is the temperature at , and the power-law index is set to 0.5, assumed to be similar to that found in T-Tauri disks in the late stage of star formation (Mundy et al., 1996; Andrews et al., 2009). In Paper I , using the dust opacity law
| (2) |
as given in Beckwith et al. (1990), the spectral energy distribution (SED) of the continuum source was found to be fitted with a dust temperature ranging from 41 to 64 K and . Thus, here is assumed to be 45 K and the dust mass opacity is assumed to be 0.026 cm2 g-1 at mm (or 225 GHz). The number density of molecular hydrogen is assumed to be given by
| (3) |
with the power-law index assumed to be 1. With a constant thickness, the disk has a surface density with a power-law index of 1, similar to that found in the T-Tauri disks (Andrews et al., 2009). As can be seen in Figure 4, with the above assumptions, the model can fit the continuum emission reasonably well, with (120 AU), (12 AU), (240 AU), and cm-3. Here, turns out to be the same as the Gaussian source deconvolved size of the continuum emission in the minor axis. This is expected for a nearly edge-on disk, for which the size in the minor axis is mainly due to the thickness of the disk. On the other hand, and thus is twice the disk radius derived from the Gaussian source deconvolution. Assuming that Helium has a number density , then the mean molecular weight with respect to the number of molecular hydrogen is 2.8. Thus, the mass of the disk is found to be 0.14 , similar to the mean value found by fitting the SED (Paper II, ). The surface density in the disk is 7.2 g cm-2 at 120 AU and 21.5 g cm-2 at 40 AU, similar to those found in the bright T-Tauri disks, e.g., GSS 39, in Ophiuchus, which also has a similar radius of 200 AU and a same disk mass of 0.14 (Andrews et al., 2009). Thus, the dusty disk here can be a very young protoplanetary disk that could evolve into a T-Tauri disk in the later stage of star formation.
5 Discussion
5.1 A Rotationally supported Disk
A rotationally supported disk has been seen in Taurus with an outer radius of 500 AU in CO in the late (i.e., Class II or T Tauri) phase of star formation (see, e.g., Simon et al., 2000). Note that the disk could appear smaller in continuum (Andrews et al., 2009), because of the rapid decrease in the continuum intensity due to a power-law decrease of the density and temperature in the disk. Formation of such a disk must have started early in the Class I phase and even earlier in the Class 0 phase. HH 111, with a bolometric temperature of only 78 K, is a very young Class I source, just transitioning from the Class 0 phase. The observations here show that such a rotationally supported disk can indeed form in such an early phase of star formation. In continuum, the disk is found to have a deconvolved radius of 120 AU (with an outer radius of 240 AU in the disk model), with the inner part of which already seen with a deconvolved radius of 30 AU at 7 mm (Rodríguez et al., 2008). It is rotationally supported with a Keplerian rotation, as seen previously in C18O and now in 13CO and 12CO, which implies a mass of 1.3 for the central star (Paper II, ). Note that as discussed in Paper II , this stellar mass can account reasonably for the observed bolometric luminosity. The disk mass is 0.14 , which is 10% of the stellar mass. This disk mass is consistent with that implied for a Class 0 source by Jørgensen et al. (2009) and that implied for a young Class I source by Andrews & Williams (2007). Since no rotationally supported disk has been confirmed in the Class 0 phase, the disk here could be the youngest rotating disk resolved to date. Moreover, as discussed earlier, the surface density and the radius of the disk here in HH 111 are both similar to those of the bright resolved T-Tauri dusty disks in Andrews et al. (2009). Thus, the disk could evolve to a T-Tauri disk in the later stage of star formation as the accretion rate drops to 10-7 yr-1 from a few times 10-6 yr-1 (Paper II, ).
As discussed in Paper II , the Keplerian rotation in this system can extend further out to the envelope to 2000 AU () from the source. At that large radius, the envelope seems to have some small amount of infall motion as well, and thus the rotation there could actually be sub-Keplerian. Therefore, the disk seems to be deeply embedded in a sub-Keplerian envelope with a radius of 2000 AU. Observations at higher velocity and angular resolutions are really needed to differentiate the Keplerian motion from the sub-Keplerian motion in order to determine where the envelope is transitioning to a disk. Another way to determine the location of transition is to search for an accretion shock that is expected to occur at the transition. As discussed in Paper II , SO is found to trace a shock emission at 400 AU (), and it may trace an accretion shock and thus the transition there. Further observations in other shock tracers are needed to check this possibility.
Rotationally supported disks have also been claimed in a few other Class I sources, e.g., IRAS 04302+2247 (the Butterfly star, K) (Wolf et al., 2008), L1489-IRS ( K) (Brinch et al., 2007), IRS 43 ( K) (Jørgensen et al., 2009), and Elias 29 ( K) (Lommen et al., 2008). These sources, with a much higher than HH 111, are at much later stages than HH 111. Among these sources, L1489-IRS has been modeled in detail for the disk and envelope properties, and thus can be compared here with HH 111. This system was found to host a Keplerian disk with an outer radius of 200 AU deeply embedded in a sub-Keplerian envelope with a radius 2000 AU (Brinch et al., 2007), similar to the HH 111 system. The mass and the infall rate in the sub-Keplerian envelope are 0.093 and 4.3 yr-1, respectively (Brinch et al., 2007), also similar to those in HH 111, which are 0.13 and 4.2 yr-1, respectively (Paper II, ). The central star has a mass of 1.35 , also similar to that in HH 111. However, this system has a bolometric luminosity of 3.7 , much smaller than that of HH 111, which is 20 . The small bolometric luminosity suggests that the accretion rate in the disk must be much lower than that in HH 111, as supported by the less jet activity. This is probably because that the accretion rate decreases with the evolutionary stage. The disk mass was first found to be only 4 (Brinch et al., 2007) and later modified to be 0.018 (Jørgensen et al., 2009), but it is still much smaller than that in HH 111. As argued in Jørgensen et al. (2009), however, it is not clear if this is because the disk mass really decreases with the evolutionary stage, or merely because the disk mass is underestimated more in the later stage due to a grain growth.
Rotationally supported disks have been seen in a few other much older sources, eg., HH 30 (late Class I) (Guilloteau et al., 2008) and IRAS 04158+2805 (Class II) (Andrews et al., 2008). In these older disks, a central hole is seen and it could be due to a tidal clearing by a possible binary system at the center or due to an outflow cavity. Since the HH 111 VLA 1 source itself is a close binary, a central hole is expected to have formed at the center of the disk near the source as well. Observations at higher angular resolution are needed to check this possibility.
5.2 Material outflowing from the disk?
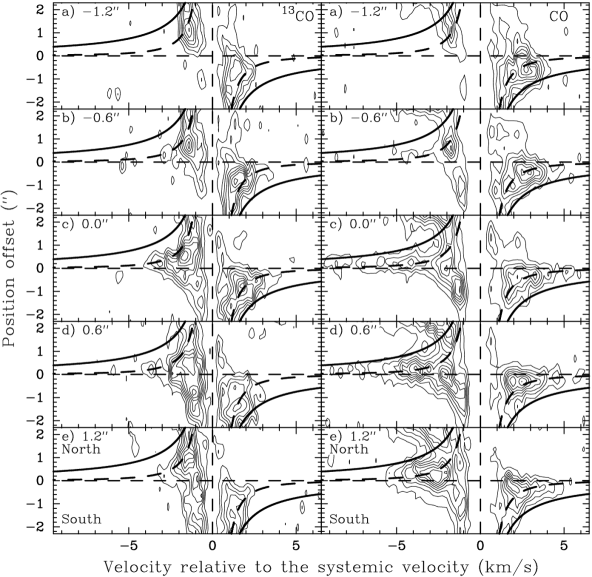
As mentioned in Section 3.3, 12CO and 13CO emissions are seen near the source extending out from the disk to the east and west parallel to the jet axis. Could this emission structure trace the material coming out from the disk, as that seen in CB 26 (Launhardt et al., 2009), carrying away the angular momentum? To study this possibility, PV diagrams cut across the jet axis centered at 5 positions along the jet axis, from in the east to in the west with a step of (which is the size of the synthesized beam), are presented here in Figure 5 to investigate the kinematics of this emission structure. In these cuts, excluding the emission within 2 km s-1 from the systemic velocity, the blueshifted emission is in the north and redshifted in the south, as seen in the emission map in Figure 1d, with a velocity sense the same as that of the rotation in the disk. Therefore, the emission could trace the material rotating around the jet axis and thus the material outflowing from the disk. In panels (c) and (d), the blueshifted emission is contaminated by the shock emission and should be excluded. From cut A in the east to cut E in the west, no clear systemic velocity shift is seen in the PV diagrams. Thus, if the emission really traces the material outflowing from the disk, the projected outflow velocity must be smaller than 1 km s-1. This is not impossible since (1) the outflowing material could have the same inclination as the jet and thus be close to the plane of the sky with an inclination angle of 10∘, and (2) the outflowing velocity could be only a few km s-1 in 12CO (Launhardt et al., 2009). Further observations are needed to study this possibility.
6 Conclusion
The HH 111 protostellar system has been mapped at a resolution of in 1.33 mm continuum, and in 13CO () and 12CO (). The 1.33 mm continuum emission shows a resolved dusty disk associated with the VLA 1 source perpendicular to the jet axis, with a Gaussian deconvolved size of 240 AU. The 13CO and 12CO emissions toward the dusty disk show a Keplerian rotation, indicating that the dusty disk is rotationally supported. The density and temperature distributions in the disk derived from a simple disk model are found to be similar to those found in bright T-Tauri disks. Thus, the disk can be a young protoplanetary disk that could evolve into a T-Tauri disk in the late stage of star formation. In addition, a hint of a low-velocity molecular outflow is also seen in 13CO and 12CO coming out from the disk.
References
- Andrews et al. (2008) Andrews, S. M., Liu, M. C., Williams, J. P., & Allers, K. N. 2008, ApJ, 685, 1039
- Andrews et al. (2009) Andrews, S. M., Wilner, D. J., Hughes, A. M., Qi, C., & Dullemond, C. P. 2009, ApJ, 700, 1502
- Andrews & Williams (2007) Andrews, S. M., & Williams, J. P. 2007, ApJ, 671, 1800
- Beckwith et al. (1990) Beckwith, S. V. W., Sargent, A. I., Chini, R. S., & Guesten, R. 1990, AJ, 99, 924
- Brinch et al. (2007) Brinch, C., Crapsi, A., Hogerheijde, M. R., & Jørgensen, J. K. 2007, A&A, 461, 1037
- Froebrich (2005) Froebrich, D. 2005, ApJS, 156, 169
- Guilloteau et al. (2008) Guilloteau, S., Dutrey, A., Pety, J., & Gueth, F. 2008, A&A, 478, L31
- Ho et al. (2004) Ho, P. T. P., Moran, J. M., & Lo, K. Y. 2004, ApJ, 616, L1
- Jørgensen et al. (2009) Jørgensen, J. K., van Dishoeck, E. F., Visser, R., Bourke, T. L., Wilner, D. J., Lommen, D., Hogerheijde, M. R., & Myers, P. C. 2009, A&A, 507, 861
- Launhardt et al. (2009) Launhardt, R., et al. 2009, A&A, 494, 147
- (11) Lee, C.-F., Mao, Y.-Y., & Reipurth, B. 2009, ApJ, 694, 1395
- (12) Lee, C.-F. 2010, ApJ, 725, 712
- Lommen et al. (2008) Lommen, D., Jørgensen, J. K., van Dishoeck, E. F., & Crapsi, A. 2008, A&A, 481, 141
- Mundy et al. (1996) Mundy, L. G., et al. 1996, ApJ, 464, L169
- Reipurth, Raga, & Heathcote (1992) Reipurth, B., Raga, A. C., & Heathcote, S. 1992, ApJ, 392, 145
- Reipurth et al. (1999) Reipurth, B., Yu, K. C., Rodríguez, L. F., Heathcote, S., & Bally, J. 1999, A&A, 352, L83
- Rodríguez et al. (2008) Rodríguez, L. F., Torrelles, J. M., Anglada, G., & Reipurth, B. 2008, AJ, 136, 1852
- Simon et al. (2000) Simon, M., Dutrey, A., & Guilloteau, S. 2000, ApJ, 545, 1034
- Wolf et al. (2008) Wolf, S., Schegerer, A., Beuther, H., Padgett, D. L., & Stapelfeldt, K. R. 2008, ApJ, 674, L101