Electroproduction of (1405)
Abstract
The electroproduction of was studied by analyzing the E1F data set collected in Hall B at Jefferson Lab. The analysis utilized the decay channel of the (1405) and of the . Simulations of background, (1405) and (1520) production according to PDG values were performed by using standard CLAS analysis tools adapted for the E1F run. Fits of the acceptance-corrected simulations were made to the acceptance-corrected data to determine contributions from signal and background processes. The line shape of (1405) varies with the four momentum transfer, , and does not match the line shape based on PDG resonance parameters. It corresponds approximately to predictions of a recent two-pole meson-baryon picture of this state.
Keywords:
electroproduction, hyperon, (1405):
14.20.Jn, 25.30.Dh, 25.30.Rw1 Introduction
The strong interaction, as one of the four fundamental interactions, is of central and enduring interest in particle physics. Baryons, as quantum systems of quarks “glued” by strong interaction, are a central subject to study strong interaction. In fact, Nathan Isgur asked “Why N*’s” in his closing speech at the workshop on Excited Nucleons and Hadronic Structure in 2000 Isgur (2001).It was stated that “baryons were at the roots of the development of the quark model” Klempt and Richard (2010).
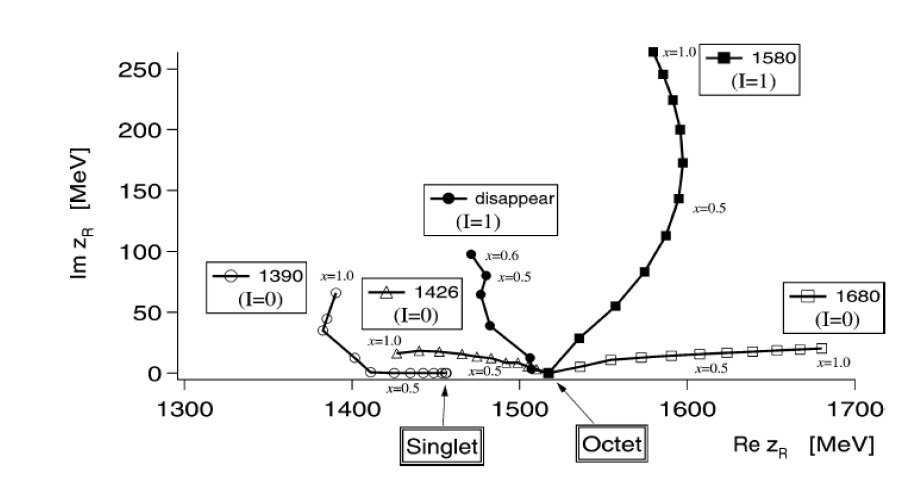
It was first predicted and proposed by Dalitz and Tuan (1959, 1960) that there is a bound-state resonance below threshold. It was first observed by Alston and et al. (1961). Following an earlier paper by Oller and Meissner (2001), Jido and et al. (2003) used a chiral unitary formalism to describe the (1405) as formed by two poles, 1390+i0.066 GeV and 1420+i0.016 GeV. Figure 1 illustrates the evolution of these poles from the exact SU(3) symmetry limit (x=0) to the physical mass limit (x=1), and shows how the 1405 MeV region is a composite of two states. The key prediction of this model was that the mass distribution, or “lineshape” of the (1405) should depend upon which reaction channel excites it and into which final state it decays. No specific prediction was made for electroproduction of this state, so the present study represents an exploration of an unknown corner of (1405) phenomenology.
2 Event Selection and Background Subtraction
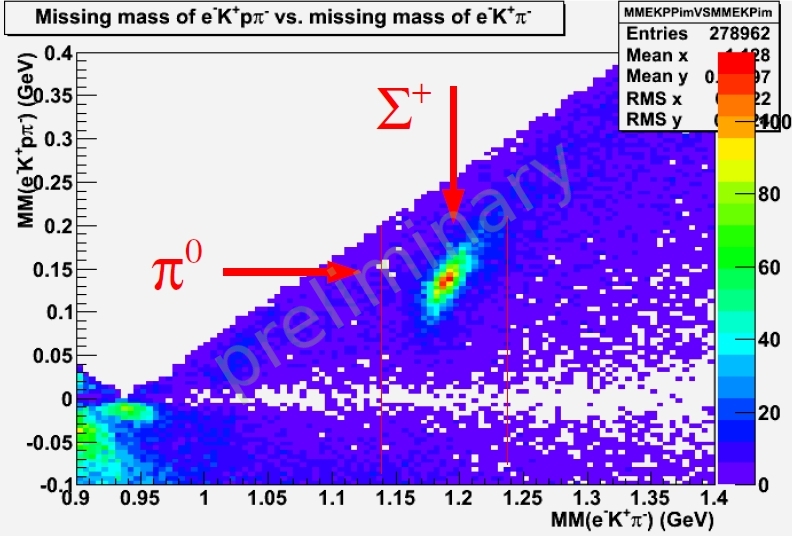
This work analyzed the data from the E1F run in Hall B at Jefferson Lab, which utilized an electron beam of 5.5 GeV and liquid hydrogen target. The (1405) decays into 100% according to PDG (Nakamura and et al., 2010). The decay channel chosen in this work was for the (1405) and for . Therefore, the final detected particles were the scattered electron , , proton, and , while a was missing for the exclusive electroproduction of (1405). Thus, events with exactly these four charged particles were selected. The missing mass of vs. the missing mass of is shown in Fig. 2. The missing s and s are clearly seen as indicated in the figure. A selection was made by requiring the missing mass of between 1.14 GeV and 1.24 GeV and the missing mass of between 0.05 GeV and 0.2 GeV. The range, after the selection, is mainly from 1.0 to 3.0 .
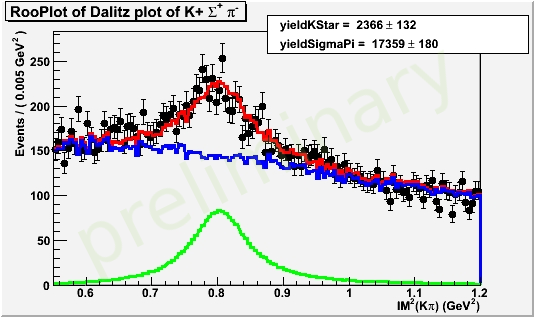
The background is mostly from the nonresonant electroproduction of and resonant , whose decays into and . The invariant mass of and was plotted and fitted with simulations of two channels. The total fit, with contribution from and is shown in Fig. 3.
3 Acceptance correction and dependence
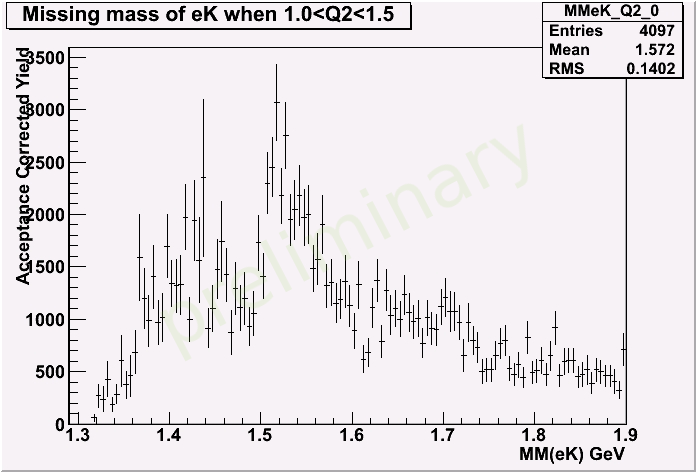
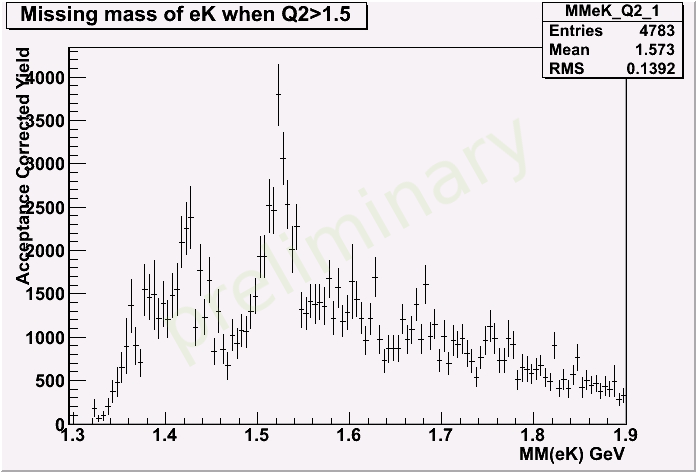
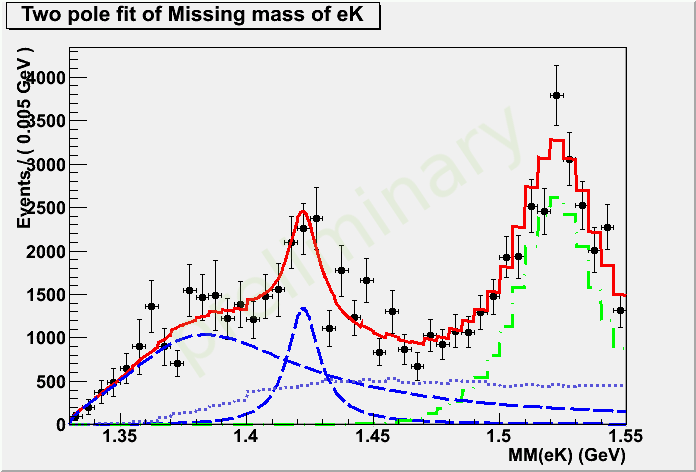
Acceptance correction was performed using the simulation of non-resonant three-body phase space . The raw and accepted events were binned in (1.0 to 3.0 ), W (1.5 to 3.5 GeV) and cosine of the kaon angle in the center-of-mass frame. Acceptance factor was calculated for each of 9500 bins. Data was corrected bin by bin in order to reduce bin-averaging effects. The corrected yield is shown in Fig. 4, where Fig. 4LABEL:sub@fig:accYield_lowQ2 is for from 1.0 to 1.5 and Fig. 4LABEL:sub@fig:accYield_highQ2 for from 1.5 to 3.0 . The statistics in these two Q2 regions are similar to each other. The dominant peak in both figures is from the (1520). A clear peak around 1.42 GeV and another peak with much broader width at the lower invariant mass in Fig. 4LABEL:sub@fig:accYield_highQ2 are not consistent with PDG values of (1405) Nakamura and et al. (2010). However, they are not clearly seen in the lower Q2 range ( Fig. 4LABEL:sub@fig:accYield_lowQ2). The higher Q2 range distribution was fitted with simulated background, (1520) and two relativistic Breit-Wigner functions described in Eqn. 1.
| (1) |
Here , and are fitting parameters, is the momentum of in center-of-mass frame of , and is the value of when . The result gives the preliminary fit parameters as GeV and GeV for peak around 1.42 GeV, and GeV and GeV for peak below 1.4 GeV (Fig. 5). More detailed study of fits to this spectrum are in progress.
4 Summary
The (1405) mass distribution in electroproduction is different from a single Breit-Wigner distribution and varies with Q2. A fit with two relativistic Breit-Wigner functions has been performed and the fit result favors the two-pole theoretic prediction.
References
- Isgur (2001) N. Isgur, “Why N*’s Are Important,” in Excited Nucleons and Hadronic Structure, N*2000, Newport News, 2000, edited by V. D. Burkert, L. Elonadrihiri, and J. J. Kelly, World Scientific, Singapore, 2001, p. 403.
- Klempt and Richard (2010) E. Klempt, and J.-M. Richard, Rev. Mod. Phys. 82, 1095–1153 (2010).
- Dalitz and Tuan (1959) R. H. Dalitz, and S. F. Tuan, Phys. Rev. Lett 2, 425 – 428 (1959).
- Dalitz and Tuan (1960) R. H. Dalitz, and S. F. Tuan, Ann. of Phys. 10, 307–351 (1960).
- Alston and et al. (1961) M. H. Alston, and et al., Phys. Rev. Lett. 6, 698–702 (1961).
- Oller and Meissner (2001) J. A. Oller, and U.-G. Meissner, Physics Letters B 500, 263 – 272 (2001).
- Jido and et al. (2003) D. Jido, and et al., Nucl. Phys. A 725, 181 – 200 (2003).
- Nakamura and et al. (2010) K. Nakamura, and et al., J. Phys. G 37, 075021 (2010).