Anisotropy effects on Rashba and topological insulator spin polarized surface states: a unified phenomenological description
Abstract
Spin polarized two-dimensional electronic states have been observed in metallic surface alloys with giant Rashba splitting and at the surface of topological insulators. We study the surface band structure of these systems, in a unified manner, by exploiting recent results of theory. The model suggests a different way to address the effect of anisotropy in Rashba systems. Changes in the surface band structure of various Rashba compounds can be captured by a single effective parameter which quantifies the competition between the Rashba effect and the hexagonal warping of the constant energy contours. The same model provides a unified phenomenological description of the surface states belonging to materials with topologically trivial and non-trivial band structures.
I I. Introduction
The spin degeneracy of electronic states can be lifted at surfaces or interfaces by the combined effect of the spin-orbit (SO) interaction and an out-of-plane electric potential gradient Bychkov and Rashba (1984). The latter appears as an effective magnetic field in the rest frame of the electrons giving rise to the Rashba-Bychkov (RB) effect. Spin polarized low dimensional states have been experimentally observed in the surface states of metals with a large atomic SO coupling LaShell et al. (1996); Cercellier et al. (2006); Koroteev et al. (2004); Reinert (2003). Such 2D electron gases (2DEG) can be described by a nearly-free electron (NFE) model where the RB SO interaction enters as a -linear correction term in the effective Hamiltonian:
| (1) |
where is the Rashba parameter, a scaled effective electron mass (i.e. ) and the Pauli spin matrices.
Similar spin polarized 2D states have been observed in a new class of quantum matter: the 3D topological insulators (TI) Hsieh et al. (2008); Xia et al. (2009); Chen et al. (2009); Hsieh et al. (2009a, b, c). TI and RB systems are characterized by a similar momentum-dependent helical spin arrangement Xu (2010). Not surprisingly, H as introduced in Eq. (1), has been used as an approximation to describe the low-energy, long-wavelength, surface band structure of the 3D TI materials Zhang et al. (2009); Wang et al. (2010). In this case, the linear term is dominant and v, where v is the Fermi velocity at the Dirac point. The spin polarized surface states described by a TI effective Hamiltonian must reflect the topologically non-trivial band structure of the bulk. The RB surface states have a similar origin in the SO interaction, but correspond to trivial bulk topologies and always give rise to pairs of constant energy contours encircling the spin degenerate points Fu and Kane (2007); Xia et al. (2009). Despite these differences, H (for RB systems) and H (for TI materials) are essentially identical.
Greatly different values of , and hence of the quadratic term in Eq. (1) cannot be the only explanation for the topological differences reflected in the surface states of the two kinds of systems. For instance, the overall band structure of RB-split Pb quantum well states with very heavy effective masses Dil et al. (2008) is clearly different from that of 3D TI materials Hsieh et al. (2008); Xia et al. (2009); Chen et al. (2009); Hsieh et al. (2009a). Even more interestingly, the surface state of Bi2Se3 has been fitted with an effective mass of only , a value lower than those encountered in many RB systems Wang et al. (2010).
Here we investigate which parameters in H determine the topological differences reflected in the surface states of RB and TI materials with the same structural symmetry. To this end, anisotropy effects are very critical and arise naturally when the isotropic RB Hamiltonian [Eq. (1)] is modified to describe real materials. The Rashba parameter in Eq. (1) was initially associated with the surface potential gradient Bychkov and Rashba (1984), but large quantitative discrepancies in the size and anisotropy of the band splitting were observed because H disregards the important influence of the ion cores LaShell et al. (1996). One must therefore take into account the atomic structure and the corresponding electronic charge distribution, either explicitly by using a site-spin representation Liu et al. (2009a, b); Frantzeskakis et al. (2010a), or implicitly by modifying the effective H. A single parameter cannot capture the anisotropic band structure and different approaches have been proposed. DFT calculations have stressed the importance of the wavefunction asymmetry near the ion cores Bihlmayer et al. (2006); Sakamoto et al. (2009), while an independent NFE approach enhanced the standard model with an ad hoc in-plane potential gradient Premper et al. (2007).
Recent data on Bi- and Pb-based surface alloys on metallic and semiconducting substrates have provided an experimental counterpart to the theoretical studies Ast et al. (2007); Pacilé et al. (2006); Frantzeskakis et al. (2008); He et al. (2008); Gierz et al. (2009); Frantzeskakis et al. (2010b). Those giant RB systems exhibit both a very large RB splitting and clear anisotropies. The anisotropy manifests itself in the shape of the constant-energy (CE) contours and the existence of an out-of-plane component of the spin polarization Ast et al. (2007); Premper et al. (2007); Meier et al. (2008). Similar RB-type quantum well states with significant splitting have been also observed to coexist with TI surface states on several TI compounds where adatoms induce a strong band bending Bianchi et al. (2011); King et al. (2011); Wray et al. (2011); Benia et al. (2011); Zhu et al. (2011). In the field of TI, Fu has recently performed a a perturbation analysis and proposed a higher order correction to H which can explain the anisotropy observed in the surface states of Bi2Te3 Fu (2009). In this case, the extra parameter captures the deviation of their momentum distributions from perfect circles (i.e. the warping of the surface states).
The purpose of this work is twofold. On one hand, we provide a phenomenological description which verifies that the results of theory can be applied not only to TI but also to RB materials of the same symmetry (R3). The Hamiltonian can be used for a common description of RB systems whose band structure follows Eq. (1) and of those where it deviates significantly from the predictions of the classical RB effect. Band structure changes in RB materials can be accurately captured by the continuous tuning of a dimensionless material-dependent parameter which quantifies the interplay of SO and anisotropy effects. On the other hand, using the same analysis, we investigate the possibility of using this parameter to discriminate the spin polarized surface states of compounds with non-trivial bulk topologies from those exhibiting a RB-type dispersion. Our results have been used to model the surface band structure of real systems with remarkable accuracy around the center of the surface Brillouin zone (SBZ).
II II. Model and parameters
As developed in Ref. Fu, 2009, the Hamiltonian has to respect the symmetry class of the studied materials. Momentum and spin must be invariant under the necessary symmetry operations. Therefore, for the R3 group the system Hamiltonian must take the following form up to third order terms:
| (2) |
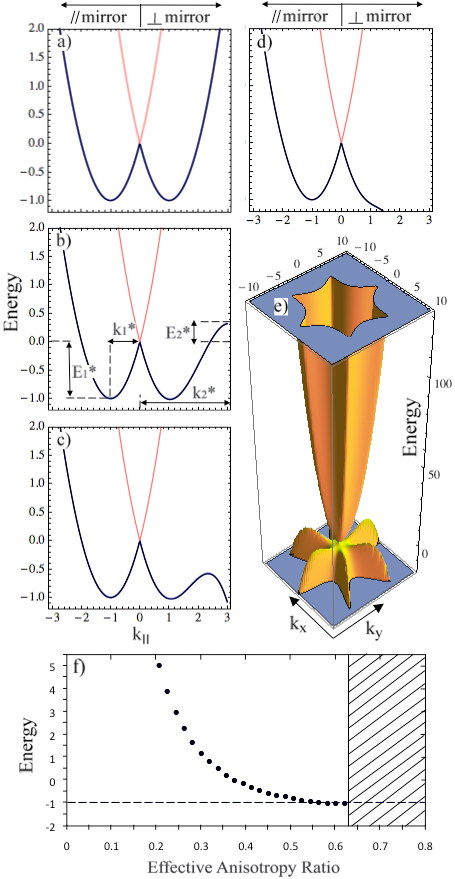
The cubic term introduces warping effects on the otherwise circular in-plane momentum distributions. Deviations of the resulting dispersion from a single NFE parabola due to SO coupling and hexagonal warping can be quantified by corresponding wavevector or energy scales. The characteristic wavevector scale for the isotropic RB effect, determines the -shift from the parent spin degenerate band, while the energy offset marks the energy position of the band’s extremum. Namely, for the split bands have a minimum at , while for they have a maximum at Ast et al. (2007); Cercellier et al. (2006). Using dimensional analysis, one can define a characteristic wavevector and energy scale introduced by the hexagonal warping on a NFE parabola. and mark the -position and energy of the local extremum for the band dispersion normal to a mirror plane. For the band has a local maximum at energy , while for the band has a local minimum at energy . A sketch of the effect of different parameters on a model band structure is given in Fig. 3(b). One should bear in mind that () and () are defined for a negligible value of (). When neither nor is small, the momentum and energy values of the RB minimum and the local maximum are only approximately given by , , and . Therefore, in Fig. 3(b), , , and have been used to denote the corresponding momentum and energy positions of the extrema. In the following analysis, we will use , , and as the fundamental momentum and energy scales. The deviation of the ”asterisk” values with respect to the corresponding fundamental parameters increases with the intermixing of the Hamiltonian terms preceded by and .
and are competing energy scales, since the former favors the RB minimum for and the latter a local maximum in the dispersion of the outer spin polarized branch normal to the mirror planes [see Figs. 3(b) and 3(c)]. The characteristic wavevector scale introduced by Fu is equal to and might be alternatively used to characterize the effects of RB coupling and hexagonal warping Fu (2009). As noted by the author, that study discarded the effect of the effective mass because it does not contribute significantly to the shape of the constant-energy (CE) contours. Here, however, we will not limit our conclusions to a single material. Our aim is to comment on the possibility of a generic classification scheme by comparing spin polarized surface states with different , and . For this reason, one has to follow the modifications of the complete dispersion around and the effective mass is one of the key parameters. In sections III and IV we provide evidence that the ratio (called effective anisotropy ratio hereafter) gives us the opportunity to describe the splitting and warping effects using a single dimensionless constant. 2D electronic states with the same effective anisotropy ratio exhibit identical band topologies irrespective of any differences in the values of , and . is also related to the ratio of the characteristic energies .
In order to solve the model of Eq. (2), we used a representation where the basis states are and , and spin projections refer to the axis. If , the corresponding ‘spin-up’ and ‘spin-down’ eigenstates refer to a quantization axis , which is always perpendicular to , i.e. along the tangential direction. The corresponding states are in this case 100% in-plane polarized, with a purely tangential spin polarization – opposite on the two branches – rotating around . For non-zero the quantization axis deviates from the tangential direction resulting in non-negligible radial () and out-of-plane () spin polarization components. Experimental and theoretical studies have nevertheless proven that the in-plane rotation of the spins is preserved; i.e. despite the presence of and , the two eigenstates always refer to states with opposite signs of tangential spin polarization, while the total in-plane component is always tangent to the warped CE contour Premper et al. (2007); Ast et al. (2007); Meier et al. (2008).
III III. Qualitative results
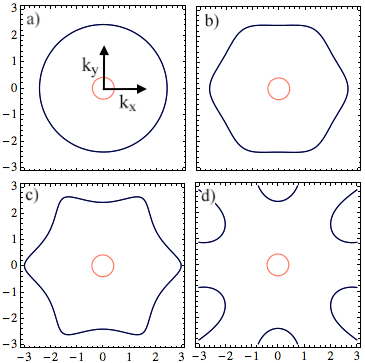
Fig. 1 summarizes our results for an increasing effective anisotropy ratio from (a) to (d). CE contours have been determined from the eigenvalues of Eq. (2). The results are plotted in units of , while the energy of the contours is equal to . The image sequence clearly shows that there is a continuous transition from the isotropic RB effect (a) to the anisotropic case (c). The outer contour is affected by the R3 symmetry of the surface and develops hexagonal warping due to the combined effect of the threefold axis and the time-reversal symmetry. The inner state also experiences the in-plane symmetry of the surface as it is reflected at higher energies [Fig. 2(b)]. Figs. 2(a) and 2(b) evidence that the warping for the outer (inner) contour has a maximum positive (negative) value normal to the mirror plane (i.e. along ), while it vanishes along a mirror plane of the system (). The shape of the CE contours follows the symmetry requirements imposed by Eq. (2). The relative in-plane orientation of the inner and outer momentum distributions with respect to the mirror planes is in full agreement with the conclusions of a NFE model for an anisotropic RB effect on a 2DEG with R3 symmetry Premper et al. (2007).
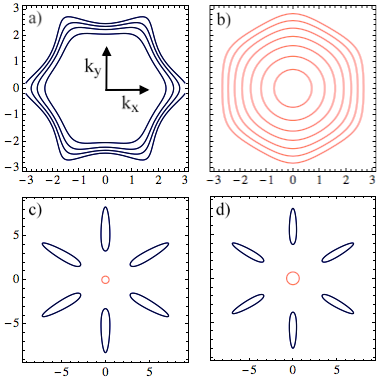

For even larger values the outer constant energy contour is not closed around the point [Fig. 1(d)]. In order to access its shape at larger wavevectors, one may renormalize the value of using a recently proposed -quadratic correction [i.e. ] Fu (2009). Fig. 2(c) corresponds to the anisotropy ratio of Fig. 1(d) with . The outer state gives rise to six elliptical contours which shrink at higher energies while the inner spin split branch expands [Fig. 2(d)]. These contours are reminiscent of the Fermi surfaces of Bi(111), Sb(111) and the TI compound BiSbAst and Höchst (2001, 2002); Koroteev et al. (2004); Sugawara et al. (2006); Hsieh et al. (2009b, 2008). All of these systems are known to have a R3 symmetry and exhibit two spin polarized branches. In each case, the outer branch does not form a closed contour around but rather the so-called teardrop contours along the six equivalent mirror planes of the system. The teardrop states possess an unconventional spin polarization whose in-plane component is captured by the results presented in Fig. 2 Hsieh et al. (2009b). is one of the time-reversal invariant momenta (TRIM) points. According to theory an electron evolving by 360 in -space around a TRIM point acquires a geometric phase (Berry’s phase) of Fu et al. (2007). Figs. 1(d), 2(c) and 2(d) suggest that an odd number of spin polarized contours encircle , which might imply a total Berry’s phase of as a consequence of the non-trivial topological properties of the bulk. This is a necessary condition for the parent compounds of strong TI such as the Sb(111) surface Hsieh et al. (2009b); Fu et al. (2007). Although the present model cannot follow the surface state behavior at the other TRIM points of the surface Brillouin zone (SBZ) (i.e. points), the band structure modification around might be a hint that the value of can discriminate between materials with topologically trivial and non-trivial band structures or consequently between pairs and an odd number of spin-polarized surface states around the TRIM points. Quantitative remarks and caveats about this description will be given in the following.
Fig. 3 compares the band dispersion for different effective anisotropy ratios and . Along a mirror plane direction, the band structure remains unchanged because the warping term of the Hamiltonian is odd and has no effect. Interesting changes can, however, be observed along the perpendicular direction: for increasing , the dispersion becomes more anisotropic resembling the findings of Ref. Premper et al., 2007. From (a) to (c), the outer branch continuously bends at lower energy values and develops a local maximum [e.g. in Fig. 3 (c)]. When the values of the fundamental parameters and become comparable, the RB minimum becomes harder to define until it is finally not observed [Fig. 3(d)]. In order to access the band structure at larger wavevectors, we have plotted Fig. 3(d) by using the quadratic correction for . The results are presented in Fig. 3(e). The dispersion is modified in a similar way along both high-symmetry directions by bending the outer branch at even lower energy values. The effects are more visible at large values of . As a result, the dispersion resembles a warped cone as proposed by Fu Fu (2009). Under the same descriptive analysis, the shape of the electronic dispersion follows the suggestions of the electronic contours sequence presented in Fig. 1. 2D electronic states similar to those encountered in an anisotropic RB NFE gas may be considered as an intermediate case between the isotropic RB effect and surface states with a cone-like behavior accompanied by strong hexagonal warping as observed in various TI compounds Hsieh et al. (2009b); Fu (2009); Wray et al. (2010).
Fig. 3(f) presents a summary of the previous observations. It illustrates, for non-negligible and , the energy position of the local band maximum in a direction perpendicular to the mirror plane, as a function of the effective anisotropy ratio. For increasing , the energy position of the maximum approaches the Rashba minimum at a decreasing rate (, due to the deviation of the fundamental parameters from the ”asterisk” values as explained in section II). This is the lowest value it can have because no local maximum is observed for higher values [Fig. 3(d)]. The energy value of the local maximum marks the transition from two closed concentric contours around [e.g. Fig. 1(c)] to one closed contour and six additional elliptical pockets [e.g. Fig. 1(d)]. Therefore, the actual merit of Fig. 3(f) is that it determines the lower value of () for which the spin polarized states always (i.e. at all energy values) exhibit an odd number of closed contours around .
| material | ) | Refs | ||||||||
| Au(111) | 0.27 | 0.33 | 0 | 0.012 | 0 | 0.002 | 0.475 | LaShell et al. (1996); Cercellier et al. (2006) | ||
| Bi/Cu(111) | -0.29 | 0.85 | 12 | -0.032 | -0.741 | 0.043 | -0.014 | -2.439 | -0.215 | Bentmann et al. (2009); Moreschini et al. (2009) |
| Bi/Ag(111) | -0.32 | 2.95 | 18 | -0.122 | -0.446 | 0.274 | -0.181 | -0.800 | N/A | Ast et al. (2007); Bentmann et al. (2009); Meier et al. (2008) |
| Bi(111) | 0.50 | 0.70 | 58 | 0.046 | 0.088 | 0.515 | 0.016 | 0.020 | 0.067 | Ast and Höchst (2001); Koroteev et al. (2004) |
| Cu0.05Bi2Se3 | 0.26 | 1.90 | 140 | 0.067 | 0.068 | 0.978 | 0.063 | 0.022 | 0.45 | Wray et al. (2010) |
| (Bi1-δSnδ)2Te3 | 1.37 | 2.00 | 230 | 0.360 | 0.008 | 44.444 | 0.360 | 6 | 0.25 | Hsieh et al. (2009b); Fu (2009) |
IV IV. Quantitative results
We will now use the results of the previous section in a quantitative analysis of published data on real systems. Table 1 lists the effective anisotropy ratios, as well as the characteristic wavevector and energy scales for five different materials with R3 symmetry. Results of the fits are depicted in Fig. 4 and summarized in Table 1. The model of Eq. (2) has been solved using values of and in good agreement with those in the corresponding Refs., while is treated as the only free parameter.
The surface state of Au(111) is included as the paradigm of an isotropic RB splitting. The consequences of the anisotropy start appearing for the spin split surface states of the BiCu2/Cu(111) surface alloy which exhibits a non-zero value. Nevertheless, anisotropy effects are not readily seen at the Fermi surface contours [Fig. 4(a) and Refs. Moreschini et al., 2009; Bentmann et al., 2009] because the Fermi energy value is very small compared to . The corresponding states of the BiAg2/Ag(111) alloy are more anisotropic. This can be quantified by a substantial increase in the value of . These surface states do not exhibit any Fermi surface contours but the anisotropy manifests itself in the CE maps taken at a binding energy somewhat higher than the spin degenerate point [Fig. 4(b)].
The effective anisotropy ratio of the Bi(111) surface states is even higher and is now comparable to . The anisotropy effects are very strong on the Fermi surface contours. They consist of a single spin polarized state centered at and six hole pockets Ast and Höchst (2001, 2002); Koroteev et al. (2004), which are reproduced by our results. As pointed out previously, such surface CE contours have been observed in materials with topologically non-trivial band structures Hsieh et al. (2009b, 2008). According to the tight-binding model of Ref. Koroteev et al., 2004, the surface states of Bi(111) exhibit a complex dispersion at larger wavevectors. Therefore, the complete bandstructure can be revealed only by first-principles methods Koroteev et al. (2004). Nevertheless, our simple NFE-based results can provide valuable information about the dispersion in regions where the parent band can be approximated by a simple parabola, since they indicate that the outer branch forms contours which do not close around .
The 3D TI compounds Bi2Se3 (CuxBi2Se3 with ) and Bi2Te3 (Sn-doped 0.27%) have been included as examples of materials with R3 symmetry and high effective anisotropy ratios. We have chosen these members of the TI family due to availability of high quality data which readily shows warping effects on the band dispersion and the CE contours Wray et al. (2010); Chen et al. (2009). The fit parameters reproduce very well the experimental results [Figs. 4(d) top and 4(e)] or the theoretical predictions [Fig. 4(d) bottom] for small -values. The outer spin polarized branch forms the lower part of the dispersion cone and there is a single spin polarized contour around the center of the SBZ, as expected for materials with a topologically non-trivial band structure. The effective anisotropy ratio of Bi2Te3 is more than one order of magnitude higher than the one of Cu-intercalated Bi2Se3 as revealed by the corresponding parameters and reflected in the blossomlike shape of the Fermi surface contour. The hexagonal warping term used for Bi2Te3 is in close agreement with the one proposed by Fu in his recent study Fu (2009).
The prediction of an unmodified RB dispersion along the mirror plane direction of the 3D TI materials (i.e. not taking into account a quadratic correction in the value of ) may seem at a first glance in striking contrast with the well-known cone-like dispersion of their surface states. Nevertheless, one should bear in mind that at energies slightly lower than the Dirac spin degeneracy point the surface states of TI materials merge into the bulk valence band continuum, thereby obscuring any clear experimental identification Wray et al. (2010); Chen et al. (2009). Such a difference in the dispersion between the mirror plane direction and its perpendicular has been clearly identified by ab initio calculations on various compounds of the TI family Zhang et al. (2009).
V V. Conclusions
Warped in-plane momentum distributions like those depicted in Fig. 4 are a signature of a -dependent out-of-plane spin polarization component Premper et al. (2007); Fu (2009); Meier et al. (2008); Ast et al. (2007). According to previous theoretical studies and experimental results, vanishes along the three equivalent surface mirror planes Premper et al. (2007); Fu (2009); Meier et al. (2008), one of which is indicated by the dashed lines in Fig. 4, while the other two are rotated by . The value of follows a threefold symmetry determining the overall symmetry of the total spin polarization vector under the requirements of Eq. (2). Moreover, the orientation of the inner and outer CE contours is a fingerprint for the symmetry of the vector Premper et al. (2007); Meier et al. (2008). Therefore, the results presented in the bottom panel of Fig. 4 can qualitatively capture the -dependent out-of-plane rotation of the total spin polarization vector.
As a tradeoff for its simplicity, the Hamiltonian proposed by Fu [i.e. Eq. (2)] has a few shortcomings. Since it is derived by perturbation theory, it is valid at wavevector values around . In order to satisfy this need we did not extend our results to other high-symmetry points of the SBZ. One should bear in mind that, similar to Ref. Fu, 2009, we used scaled axes in Figs. 1-3. Scaling is necessary to maintain a universal character of the trends we have addressed. Nevertheless, the validity of the corresponding results at points far from the SBZ center depends on the absolute -distance from zero. In this frame, Fig. 4 proves that the conclusions from the scaled-axes Figures can indeed be applied to real systems. Another shortcoming of the model is related to the passage from anisotropic RB-type 2D electronic states to surface states exhibiting a dispersion similar to those of TI compounds. It is not straightforward to claim a topological change because our results are limited to the surface states and they do not consider the bulk valence and conduction bands of the described compounds. However, the energy position of the bulk bands continuum is crucial to determine whether there is a partner switching in the spin polarized surface state branches within the bulk gap and between two TRIM points Fu et al. (2007). The topological differences between similar compounds may depend on bulk band characteristics such as a critical bulk band inversion which discriminates the trivial band structure of Bi(111) from the non-trivial band structure of Sb(111) Fu and Kane (2007). Although the described model cannot capture such bulk effects, the effective anisotropy ratio is a measure of how fast the surface state dispersion deviates from the isotropic case. Therefore, it may determine the minimum size of the bulk gap around which would allow a partner switching to occur. Although Eq. (2) has already been used to describe the surface states of Bi2Te3 Fu (2009), the derived dispersion along the direction which connects two TRIM points remains unchanged in the absence of the -quadratic correction in the value of . As a matter of fact, the best indication for a possible topological change within the model is the predicted change in the total number of closed spin polarized contours around . According to Fig. 3(f), there will always be an odd number of closed contours for . In any case, since a purely two-dimensional model is not enough to capture the complete band structure of a TI compound, our results on this topic rest as a descriptive analysis of the alleged topological change. Final predictions should be made after determining the surface state behavior at different TRIM points which cannot be captured by Eq. (2).
Nevertheless, the value of the present work is not limited to a purely phenomenological analysis of the consequences of the aforementioned topological change reflected on the surface states. The description of the RB effect using the Fu Hamiltonian [Eq. (2)], although overlooked in the past RB literature, offers major advantages. As explicitly demonstrated by our qualitative and quantitative arguments, it presents a simple but instructive way to capture the effects of anisotropy on the surface band structure. Continuous tuning of the effective anisotropy ratio permits a unified description of different RB systems with complex topologies without resorting to relativistic DFT calculations and deviating from the conventional RB description. The same Hamiltonian [i.e. Eq. (2)] can capture the band structure of (a) the classical RB effect as observed on Au(111) and was originally accessed by the isotropic RB Hamiltonian [i.e. Eq. (1)] LaShell et al. (1996), (b) the ”weakly” anisotropic RB systems such as the metallic surface alloys which have been previously described by DFT calculations or by an NFE model with an ad hoc in-plane potential gradient Ast et al. (2007); Premper et al. (2007), and (c) ”strongly” anisotropic cases which do not show a pair of closed contours around the spin degeneracy points and have been previously described only by relativistic first-principles calculations Koroteev et al. (2004). Differences between the corresponding RB surface states are accurately captured by the effective anisotropy ratio , which can be determined either from an experimental CE contour or from the band dispersion perpendicular to the mirror plane direction. Alternatively, the simple parameter can be determined by fitting relativistic first-principles calculations.
Can we attribute a physical meaning to the effective anisotropy ratio? As already mentioned, quantifies the warping effects on the surface state dispersion, which are always accompanied by a non-zero out-of-plane spin polarization component. The latter is intuitively linked to an in-plane electronic potential gradient. Premper et al. introduced explicitly such an in-plane gradient in the standard RB model and found that it can both influence the splitting size and alter the circular shape of the surface state contours Premper et al. (2007). There are however alternative views of the same phenomenon. Bihlmayer et al. proposed that it is the asymmetry of the surface state wavefunction which drives the size and anisotropy of the splitting Bihlmayer et al. (2006). Recent first-principles calculations suggested that the asymmetric charge distribution can arise from the unquenched local orbital angular momentum in the presence of SO coupling Park et al. (2011). Because of their computational complexity, such approaches face practical limitations, and the effective anisotropy ratio can be considered as an alternative easy-to-use effective parameter, which quantifies the warping effects induced to surface states of R3 symmetry according to the predictions of the aforementioned physical models. Therefore, is intimately related to an in-plane asymmetry of the electronic charge distribution, which in turn may correspond to an asymmetric surface state wavefunction or again to an anisotropic quenching of the local orbital angular momentum.
VI VI. Summary
We presented a phenomenological description of the similarities and differences between the surface states of RB and TI compounds by continuously tuning an anisotropy-related parameter. We showed that the Hamiltonian proposed by Fu Fu (2009) can be used not only to describe the surface states of TI compounds but also as a tool to quantify anisotropy effects in RB systems. We propose a general classification scheme for 2D spin polarized states of R3 symmetry. Materials which exhibit an isotropic RB splitting, and 3D topological insulators with a single Dirac cone on their surface can be considered as the two opposite ends of our classification. Systems with an anisotropic RB splitting naturally fall into place as an intermediate category. This simple approach suggests a unified description of the RB surface states on different materials which exhibit complex spin polarized contours without deviating from the simplicity of the conventional RB Hamiltonian. We hope that it will motivate more fundamental efforts to compute the in-plane electronic charge distribution and the momentum and energy dependence of the spin polarization vector.
Acknowledgements.
We are grateful to A. Crepaldi and S. Pons for fruitful discussions and their helpful comments. This research was supported by the Swiss NSF and the NCCR MaNEP.References
- (1)
- Bychkov and Rashba (1984) Y. A. Bychkov and E. I. Rashba, JETP Lett. 39, 78 (1984).
- LaShell et al. (1996) S. LaShell, B. A. McDougall, and E. Jensen, Phys. Rev. Lett. 77, 3419 (1996).
- Cercellier et al. (2006) H. Cercellier, C. Didiot, Y. Fagot-Revurat, B. Kierren, D. M. L. Moreau, and F. Reinert, Phys. Rev. B 73, 195413 (2006).
- Koroteev et al. (2004) Y. M. Koroteev, G. Bihlmayer, J. E. Gayone, E. V. Chulkov, S. Blügel, P. M. Echenique, and P. Hofmann, Phys. Rev. Lett. 93, 046403 (2004).
- Reinert (2003) F. Reinert, J. Phys. Condens. Matter 15, S693 (2003).
- Hsieh et al. (2008) D. Hsieh, D. Qian, L. Wray, Y. Xia, Y. S. Hor, R. J. Cava, and M. Z. Hasan, Nature (London) 452, 970 (2008).
- Xia et al. (2009) Y. Xia, D. Qian, D. Hsieh, L. Wray, A. Pal, H. Lin, A. Bansil, D. Grauer, Y. S. Hor, R. J. Cava, et al., Nat. Phys. 5, 398 (2009).
- Chen et al. (2009) Y. L. Chen, J. G. Analytis, J.-H. Chu, Z. K. Liu, S.-K. Mo, X. Qi, H. J. Zhang, D. H. Lu, X. Dai, Z. Fang, et al., Science 325, 178 (2009).
- Hsieh et al. (2009a) D. Hsieh, Y. Xia, D. Qian, L. Wray, J. H. Dil, F. Meier, J. Osterwalder, L. Patthey, J. G. Checkelsky, N. P. Ong, et al., Nature (London) 460, 1101 (2009a).
- Hsieh et al. (2009b) D. Hsieh, Y. Xia, L. Wray, D. Qian, A. Pal, J. H. Dil, J. Osterwalder, F. Meier, G. Bihlmayer, C. L. Kane, et al., Science 323, 919 (2009b).
- Hsieh et al. (2009c) D. Hsieh, Y. Xia, D. Qian, L. Wray, F. Meier, J. H. Dil, J. Osterwalder, L. Patthey, A. V. Fedorov, H. Lin, et al., Phys. Rev. Lett. 103, 146401 (2009c).
- Xu (2010) C. Xu, Phys. Rev. B 81, 054403 (2010).
- Zhang et al. (2009) H. Zhang, C.-X. Liu, X.-L. Qi, X. Dai, Z. Fang, and S.-C. Zhang, Nat. Phys. 5, 438 (2009).
- Wang et al. (2010) Z. Wang, Z.-G. Fu, S.-X. Wang, and P. Zhang, Phys. Rev. B 82, 085429 (2010).
- Fu and Kane (2007) L. Fu and C. L. Kane, Phys. Rev. B 76, 045302 (2007).
- Dil et al. (2008) J. H. Dil, F. Meier, J. Lobo-Checa, L. Patthey, G. Bihlmayer, and J. Osterwalder, Phys. Rev. Lett. 101, 266802 (2008).
- Liu et al. (2009a) G. Liu, P. Zhang, Z. Wang, and S.-S. Li, Phys. Rev. B 79, 035323 (2009a).
- Liu et al. (2009b) G. Liu, Z. Wang, and S.-S. Li, Physics Letters A 373, 2091 (2009b).
- Frantzeskakis et al. (2010a) E. Frantzeskakis, S. Pons, and M. Grioni, Phys. Rev. B 82, 085440 (2010a).
- Bihlmayer et al. (2006) G. Bihlmayer, Y. M. Koroteev, P. M. Echenique, E. V. Chulkov, and S. Blügel, Surf. Sci. 600, 3888 (2006).
- Sakamoto et al. (2009) K. Sakamoto, T. Oda, A. Kimura, K. Miyamoto, M. Tsujikawa, A. Imai, N. Ueno, H. Namatame, M. Taniguchi, P. E. J. Eriksson, et al., Phys. Rev. Lett. 102, 096805 (2009).
- Premper et al. (2007) J. Premper, M. Trautmann, J. Henk, and P. Bruno, Phys. Rev. B. 76, 073310 (2007).
- Ast et al. (2007) C. R. Ast, J. Henk, A. Ernst, L. Moreschini, D. Pacilé, P. Bruno, K. Kern, and M. Grioni, Phys. Rev. Lett. 98, 186807 (2007).
- Pacilé et al. (2006) D. Pacilé, C. R. Ast, M. Papagno, C. DaSilva, L. Moreschini, M. C. Falub, A. P. Seitsonen, and M. Grioni, Phys. Rev. B 73, 245429 (2006).
- Frantzeskakis et al. (2008) E. Frantzeskakis, S. Pons, H. Mirhosseini, J. Henk, C. R. Ast, and M. Grioni, Phys. Rev. Lett. 101, 196805 (2008).
- He et al. (2008) K. He, T. Hirahara, T. Okuda, S. Hasegawa, A. Kakizaki, and I. Matsuda, Phys. Rev. Lett. 101, 107604 (2008).
- Gierz et al. (2009) I. Gierz, T. Suzuki, E. Frantzeskakis, S. Pons, S. Ostanin, A. Ernst, J. Henk, M. Grioni, K. Kern, and C. R. Ast, Phys. Rev. Lett. 103, 046803 (2009).
- Frantzeskakis et al. (2010b) E. Frantzeskakis, A. Crepaldi, S. Pons, K. Kern, and M. Grioni, J. Electron Spectr. Rel. Phenom. 181, 88 (2010b).
- Meier et al. (2008) F. Meier, H. Dil, J. Lobo-Checa, L. Patthey, and J. Osterwalder, Phys. Rev. B 77, 165431 (2008).
- Bianchi et al. (2011) M. Bianchi, R. C. Hatch, J. Mi, B. B. Iversen, and P. Hofmann, Phys. Rev. Lett. 107, 086802 (2011).
- King et al. (2011) P. D. C. King, R. C. Hatch, M. Bianchi, R. Ovsyannikov, C. Lupulescu, G. Landolt, B. Slomski, J. H. Dil, D. Guan, J. L. Mi, et al., Phys. Rev. Let. 107, 096802 (2011).
- Wray et al. (2011) L. A. Wray, S.-Y. Xu, Y. Xia, D. Hsieh, A. V. Fedorov, Y. S. Hor, R. J. Cava, A. Bansil, H. Lin, and M. Z. Hasan, Nat. Phys. 7, 32 (2011).
- Benia et al. (2011) H. M. Benia, C. Lin, K. Kern, and C. R. Ast, Phys. Rev. Lett. 107, 177602 (2011).
- Zhu et al. (2011) Z.-H. Zhu, G. Levy, B. Ludbrook, C. N. Veenstra, J. A. Rosen, R. Comin, D. Wong, P. Dosanjh, A. Ubaldini, P. Syers, et al., Phys. Rev. Lett. 107, 186405 (2011).
- Fu (2009) L. Fu, Phys. Rev. Lett. 103, 266801 (2009).
- Ast and Höchst (2001) C. R. Ast and H. Höchst, Phys. Rev. Lett. 87, 177602 (2001).
- Sugawara et al. (2006) K. Sugawara, T. Sato, S. Souma, T. Takahashi, M. Arai, and T. Sasaki, Phys. Rev. Lett. 96, 046411 (2006).
- Bentmann et al. (2009) H. Bentmann, F. Forster, G. Bihlmayer, E. V. Chulkov, L. Moreschini, M. Grioni, and F. Reinert, Europhys. Lett. 87, 37003 (2009).
- Wray et al. (2010) L. A. Wray, S.-Y. Xu, Y. Xia, Y. S. Hor, D. Qian, A. V. Fedorov, H. Lin, A. Bansil, R. J. Cava, and M. Z. Hasan, Nat. Phys. 6, 855 (2010).
- Ast and Höchst (2002) C. R. Ast and H. Höchst, Phys. Rev. B 66, 125103 (2002).
- Fu et al. (2007) L. Fu, C. L. Kane, and E. J. Mele, Phys. Rev. Lett. 98, 106803 (2007).
- Moreschini et al. (2009) L. Moreschini, A. Bendounan, H. Bentmann, M. Assig, K. Kern, F. Reinert, J. Henk, C. R. Ast, and M. Grioni, Phys. Rev. B 80, 035438 (2009).
- Park et al. (2011) S. Y. Park, C. H. Kim, J. Yu, J. H. Han, and C. Kim, Phys. Rev. Lett. 107, 156803 (2011).