2nd-order Fermi acceleration as the origin of the Fermi bubbles
Abstract
Gamma-ray data from Fermi-LAT show a bi-lobular structure extending up to 50 degrees above and below the Galactic centre, coincident with a possibly related structure in the ROSAT X-ray map which presumably originated in some energy release close to the centre a few million years ago. It has been argued that the gamma-rays arise due to inverse Compton scattering of relativistic electrons accelerated at plasma shocks present in the bubbles. We explore the alternative possibility that the relativistic electrons undergo stochastic 2nd-order Fermi acceleration in the entire volume of the bubbles by plasma wave turbulence. This turbulence is generated behind the outer shock and propagates into the bubble volume, leading to a non-trivial spatial variation of the electron spectral index. Rather than a constant volume emissivity as predicted in other models we find an almost constant surface brightness in gamma-rays and also reproduce the observed sharp edges of the bubbles. We comment on possible cross-checks in other channels.
1 Introduction
Recently, data from the Fermi-LAT have revealed [1, 2] (see also [3]) the presence of two huge bi-lobular structures in gamma-rays, the so-called “Fermi bubbles”, extending up to above and below the galactic plane. The overall spectrum of the bubbles is , i.e. much harder than the , inverse Compton (IC) and bremsstrahlung foregrounds from galactic cosmic rays in the disk, and extends from a spectral shoulder at about a GeV up to a cut-off/roll-over at a few hundreds of GeV. The bubbles have an almost constant surface brightness with sharp edges. The above properties as well as the size and position of the bubbles are rather robust with respect to the details of foreground subtraction making it unlikely that the bubbles are an artefact of the foreground subtraction.
Both the position at galactic longitude and its symmetry with respect to the galactic plane hint at the galactic centre (GC) as the origin of the bubbles. While similar structures have been observed in radio galaxies the detection of the Fermi bubbles is puzzling given that there is no evidence for present activity of the massive black hole at the GC. Understanding this would provide an excellent probe of this region which is otherwise obscured by the galactic disk. The bubbles may play an important role in the dynamics of our galaxy and constitute a source of cosmic rays. They dominate the high latitude -ray emission at (and possibly contribute close to) the GC, so constitute an important background for indirect dark matter searches. It is therefore important to understand and model the origin of the non-thermal emission from the bubbles.
The observed high-energy gamma-rays can in principle be of hadronic or leptonic origin, i.e. decay or inverse Compton (IC) scattering of the ambient radiation fields (CMB, far IR and optical/UV) by high energy electrons. A model [4] for the hadronic origin invokes an increased star formation rate close to the GC in combination with a strong convective wind up to kiloparsec distances from the galactic plane. The neutral pions are produced from spallation on the ambient gas in the bubbles of an spectrum of protons and nuclei accelerated in supernova remnants close to the GC; the kinematics of the production can explain the spectral shoulder around . Leptonic models, on the other hand, have to explain how despite the rapid cooling of electrons the bubbles volume can be filled with a consistently hard spectrum. It has been argued that disruption of stars close by the central massive black hole can heat the ambient gas and produce shocks. Estimates for the rate of this process predict hundreds of concentric shock fronts filling the bubbles. Electrons are repeatedly accelerated by diffusive shock acceleration, thereby explaining the hard gamma-ray spectrum. The spectral cut-off/roll-over would then be due to competition of acceleration and cooling by IC (and possibly synchrotron) losses.
Data from the ROSAT x-ray satellite [5] however only show evidence for a limb brightened structure coinciding with the bubble edges, possibly from a shock front. The non-observation of x-rays from the bubble interior, on the other hand, points at a relatively thin, hot plasma. With estimates for a gas density of and a temperature of , the total energy in hot gas is [1]. Furthermore, assuming velocities typical for shock fronts in the interstellar medium gives for the age of the bubbles at a projected distance of .
Other possible scenarios for the generation of the bubbles than those above include jets emanating from the central black hole. While we choose to remain agnostic about the origin of the bubbles itself we note that a shock might have been produced by such a jet active for a few million years. It has recently been shown [6] that a light but overpressured jet powered by of the Eddington luminosity leads to a shock coincident with the bubble edge and in agreement with the overall bubble shape. In the following, we will explain the non-thermal emission from the bubbles by 2nd-order Fermi acceleration of electrons and IC scattering of these electron on ambient radiation fields. As the electrons are constantly accelerated in the whole bubble this can lead to the hard gamma-ray spectrum.
2 Second order Fermi acceleration
In particular, we start from the evidence for a shock front from ROSAT. At the outer shock Rayleigh-Taylor and Kelvin-Helmholtz instabilities will generate plasma turbulence that is then being convected into the bubble interior by the downstream bulk flow. The turbulence will cascade from the injection scale to smaller scales and will finally be dissipated at a scale , i.e. once the eddy velocity reaches the Alfvén velocity, . The usual Rankine-Hugoniot conditions allow to compute [7] the spatial variation of the eddy velocity at the injection scale, , and the magnetosonic phase velocity, , with distance from the shock:
| (1) | |||||
| (2) |
where is the shock velocity, the Alfvén velocity (which we assume to be constant and equal to the speed of sound at the shock) and .
We consider the stochastic acceleration by large-scale, fast mode turbulence [8]. Second order Fermi acceleration processes like this have been proven successful in explaining the non-thermal spectra of high-energy electrons in a variety of astrophysical environments [9, 10, 11, 12, 13, 7] and might be responsible for the acceleration of ultra-high energy cosmic rays [14, 15, 16]. The spectrum is governed by the Fokker-Planck equation,
| (3) |
where is the density of electrons with momentum in . The second, third and fourth term describe diffusion and systematic gains in momentum, escape due to spatial diffusion and energy losses by synchrotron radiation and IC scattering (with cooling time ), respectively. The diffusion coefficient in momentum for scattering by fast magnetosonic waves is [8]
| (4) |
which translates into the timescale for acceleration, . Both and (and therefore the resulting spectrum) depend on three parameters that cannot be inferred directly from observations. The scale of turbulence injection is necessarily smaller than the size of the bubbles and MHD simulations show generation of turbulence on kiloparsec scales. Here, we assume . The shock velocity can in principle be determined from the displacement of the shock; the shock needs to move a distance corresponding to the resolution of the Chandra X-ray observatory. Here, we fix , a value consistent with MHD simulations [6]. Finally the Alfvén velocity is given by the square root of the ratio of magnetic field energy density to thermal plasma energy density: . Hence for an estimated upper limit on the thermal gas density [1] and a magnetic field . Such a field strength in the halo is suggested by radio observations of edge-on spiral galaxies as NGC 891 [17]. Here we adopt . The resulting timescales are compared in Fig. 1.
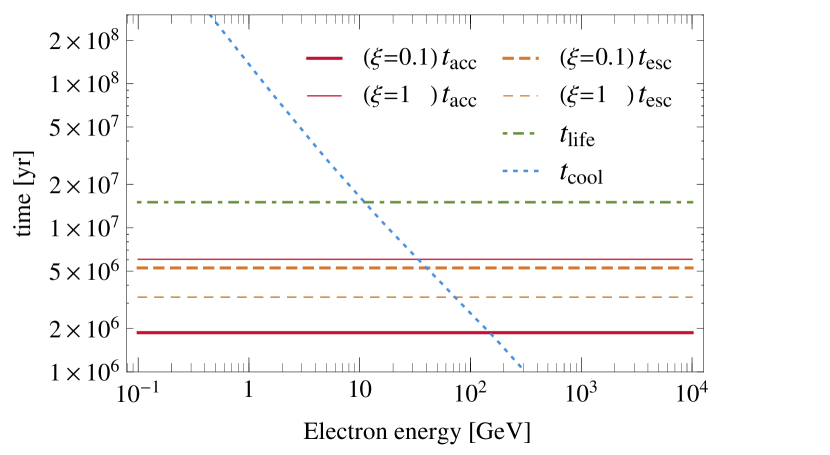
With these adopted parameters the dissipation length is always larger than the gyro-radius of relativistic electrons . Hence, the spatial diffusion coefficient and also the escape and acceleration time are effectively energy-independent. Furthermore, with the parameters as above we recover a hierarchy of timescales, which justifies the use of the steady state solution [18],
| (5) |
The spectral index, , is determined by the ratio of acceleration and escape times alone and asymptotically approaches as . One could argue that for low energies the cooling time becomes larger than the dynamical time scale and that therefore the use of the steady state solution is not strictly justified. However, it has been shown [19] for 2nd-order Fermi acceleration that irrespective of the cooling rate the spectrum always attains the steady state spectrum in a few times and that the steady state solution can therefore be applied as long as . The change in timescales and with distance from the shock front (through and ) is therefore adiabatic such that the electron spectrum relaxes quickly to its steady state value.
The emissivity in gamma-rays is calculated in the most general form [20] using a recent model of interstellar radiation fields [21] and depends on the distance from the shock. We calculate the flux of photons by integrating along the line of sight through the bubble. Since the overall normalisation of the electron spectrum depends on the microphysics of injection, we fix this by demanding that our model matches the observed gamma-ray flux.
3 Results
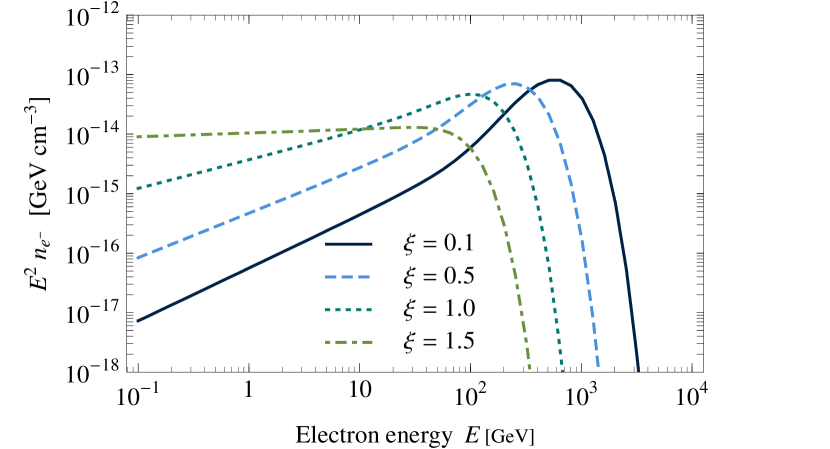
Figure 2 shows the electron spectrum for different distances from the shock. The spectrum is hardest close to the shock and becomes gradually softer towards the bubble interior. Furthermore, the spectral pile-up and cut-off (determined by the competition between acceleration and energy losses) move to lower energies. Integration of the (position-dependent) spectrum over both bubbles shows that the total energy in electrons above is . This is a rather moderate energy demand, in particular in comparison to the hadronic model [4] which requires up to five orders of magnitude more energy in high energy protons.
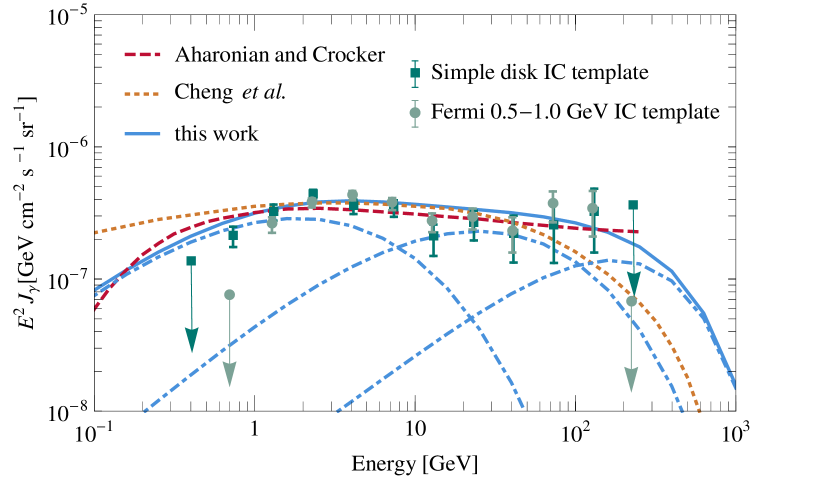
The overall spectrum of gamma-rays from the bubbles is shown in Fig. 3 and compared to the data and predictions from other models. Our model not only reproduces the spectrum but also both the spectral shoulder around and the roll-over/cut-off at . We note that the other two models presented would need to invoke a somewhat unmotivated break in the proton/electron spectrum to produce both features whereas in our model they arise naturally due to the very hard electron spectrum and the cut-off due to cooling.
In Fig. 4, we compare the data with the intensity as a function of distance from the bubble edge predicted by our model and obtained in the same fashion as in Ref. [1], i.e. averaging over great circles intersecting the bubble centre. At both energies for which data is available ( and ) our model nicely reproduces the constant profile inside the bubbles and their sharp edges, i.e. the jump in intensity within a few degrees around the bubble edge. We have also computed the profile at which is much more limb-brightened – a robust prediction of our model. We note that the profile expected from a constant volume emissivity, as predicted by a hadronic [4] and a leptonic [22] model, would be much softer at the edges and does not reproduce the data.
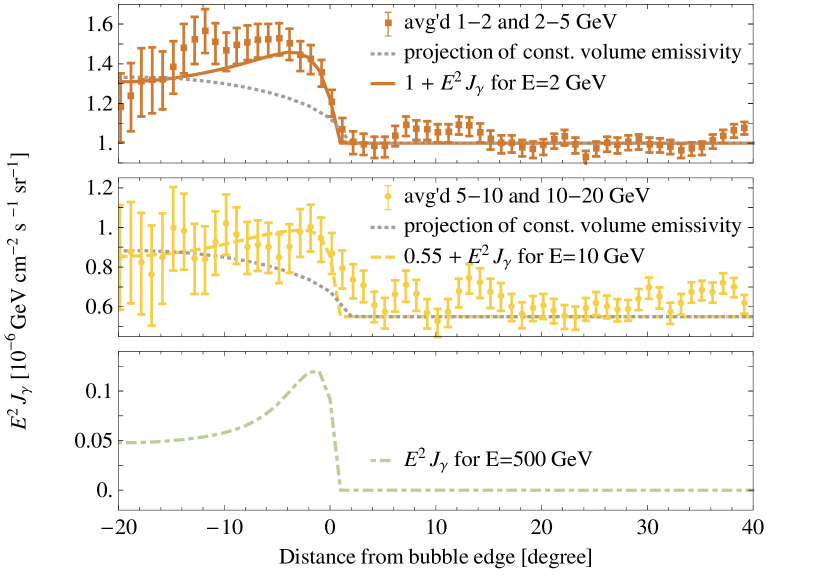
Both the constant surface brightness with sharp edges at low energies and the limb-brightening at the highest energies are consequences of the position dependent electron spectrum. As shown already in Fig. 2, the high-energy electrons are present only close to the shock front whereas low-energy electrons are distributed over the whole bubble volume. The IC emissivity at a given distance from the shock is in fact a convolution over a certain range in electron energies: For GeV gamma-rays the emissivity profile is flat in the bubble interior and peaks at the bubble edge, which in projection leads to a flat surface brightness with sharp edges. At the highest energies however, only electrons of hundreds of GeV which are located close to the shock can contribute which leads to a limb-brightening in projection.
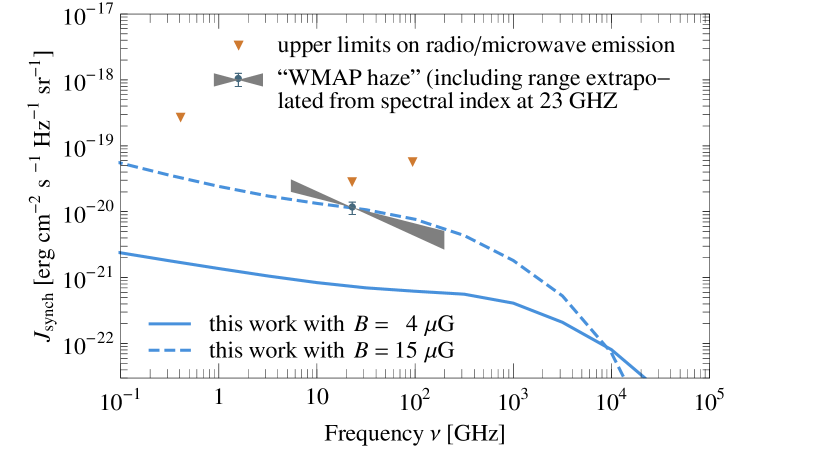
While the “WMAP haze” [23] has not been observed in polarised emission [24] and may be just an artefact of the template subtraction [25], it has been proposed as a physical counterpart of the Fermi bubbles [1]. However as seen in Fig. 5, in our model the expected synchrotron flux in the middle of the bubble is of the required amplitude only if the magnetic field is as strong as . For a field the synchrotron flux is significantly lower, .
The hadronic model predicts a detectable flux of neutrinos for the proposed Mediterranean km3 neutrino telescope [4]. We stress however that the observed bubble profile already disfavours this model (as well as the leptonic DSA model) and instead favours our model with 2nd-order Fermi acceleration of electrons.
References
- [1] M. Su, T. R. Slatyer, D. P. Finkbeiner, Astrophys. J. 2010, 724: 1044
- [2] Fermi: http://www.nasa.gov/fermi.
- [3] G. Dobler et al., Astrophys. J. 2010, 717: 825
- [4] R. M. Crocker, F. Aharonian, Phys. Rev. Lett. 2011, 106:101102.
- [5] S. L. Snowden et al., Astrophys. J. 1997, 485: 125
- [6] F. Guo, W. G. Mathews, [arXiv:1103.0055].
- [7] Z. Fan, S. Liu, C. L. Fryer, Mon. Not. R. Astron. Soc. 2009, 406: 1337.
- [8] V. S. Ptuskin, Sov. Astron Lett. 1988, 14: 255.
- [9] J. S. Scott, R. A. Chevalier, Astrophys. J. Lett. , 1975, 197: L5.
- [10] C. Lacombe, Astron. Astrophys. 1977, 54: 1.
- [11] A. Achterberg, Astron. Astrophys. 1979, 76: 276.
- [12] J. A. Eilek, Astrophys. J. , 1979, 230: 373.
- [13] R. Cowsik, S. Sarkar, Mon. Not. R. Astron. Soc. 1984, 207: 745.
- [14] M. J. Hardcastle et al., Mon. Not. R. Astron. Soc. 2009, 393: 1041.
- [15] F. Fraschetti, F. Melia, Mon. Not. R. Astron. Soc. 2008, 391: 1100.
- [16] S. O’Sullivan, B. Reville, A. M. Taylor, Mon. Not. R. Astron. Soc. 2009, 400: 248.
- [17] R. Beck et al., Astron. Astrophys. 77, 25 (1979).
- [18] L. Stawarz, V. Petrosian, Astrophys. J. 2008, 681: 1725.
- [19] P. A. Becker, T. Le, C. D. Dermer, Astrophys. J. 2006, 647: 539.
- [20] G. R. Blumenthal, R. J. Gould, Rev. Mod. Phys. 1970, 42: 237.
- [21] T. A. Porter, A. W. Strong, Proc. 29th Int. Cosmic Ray Conf., Pune, 2005, 4: 77.
- [22] K. S. Cheng et al., [arXiv:1103.1002].
- [23] D. P. Finkbeiner, [astro-ph/0409027].
- [24] B. Gold et al., Astrophys. J. Suppl. 2011, 192: 15.
- [25] P. Mertsch, S. Sarkar, JCAP, 2010, 1010: 019.
- [26] G. Dobler, D. P. Finkbeiner, Astrophys. J. 2008, 680: 1222-1234
- [27] C. G. T. Haslam, C. J. Salter, H. Stoffel, W. E. Wilson, Astron. Astrophys. Suppl. Ser. , 1982, 47: 1-142
- [28] N. Jarosik, C. L. Bennett, J. Dunkley, B. Gold, M. R. Greason, M. Halpern, R. S. Hill, G. Hinshaw et al., Astrophys. J. Suppl. 2011, 192: 14