The young B-star quintuple system HD 155448††thanks: Based on observations collected at the European Southern Observatory (programme IDs 075.C-0091(B) and 075.C-0091(C), together with archival and technical data)
Until now, HD 155448 has been known as a post-AGB star and listed as a quadruple system. In this paper, we study the system in depth and reveal that the B component itself is a binary and that the five stars HD 155448 A, B1, B2, C, and D likely form a comoving stellar system. From a spectroscopic analysis we derive the spectral types and find that all components are B dwarfs (A: B1V, B1: B6V, B2: B9V, C: B4Ve, D: B8V). Their stellar ages put them close to the ZAMS, and their distance is estimated to be 2 kpc. Of particular interest is the C component, which shows strong hydrogen and forbidden emission lines at optical wavelengths. All emission lines are spatially extended in the eastern direction and appear to have a similar velocity shift, except for the [O i] line. In the IR images, we see an arc-like shape to the northeast of HD 155448 C. From the optical up to 10 m, most circumstellar emission is located at distances between 1.0″ and 3.0″ from HD 155448 C, while in the band the arc-like structure appears to be in contact with HD 155448 C. The Spitzer and VLT/VISIR mid-IR spectra show that the circumstellar material closest to the star consists of silicates, while polycyclic aromatic hydrocarbons (PAH) dominate the emission at distances 1″ with bands at 8.6, 11.3, and 12.7 m. We consider several scenarios to explain the unusual, asymmetric, arc-shaped geometry of the circumstellar matter. The most likely explanation is an outflow colliding with remnant matter from the star formation process.
Key Words.:
Stars: circumstellar matter – Stars: emission-line – Stars: individual: HD 155448 – Stars: pre-MS – Techniques: spectroscopic – ISM: general1 Introduction
HD 155448 (alias SAO 208540, or HIP 84228) was described as a B9 object in the “Catalogue of two-dimensional spectral types for the HD stars, Vol. 3” (Houk Houk (1982)). Three other members of this system are known according to the “Catalogue of the components of double and multiple stars (CCDM)” (Dommanget & Nys Dommanget (1994)). The system’s Hipparcos parallax of 1.65 mas (Perryman et al. Perryman (1997)) would correspond to a distance of roughly pc, but the uncertainty of the parallax is large (1.99 mas).
Up to now, all studies have described this system as old and evolved. In their sample of 42 IRAS point source objects, Van der Veen et al. (Veen (1989)) considered IRAS 170973210 (alias HD 155448) – based on its IRAS colours – as a transition object from the AGB to the planetary nebula (PN) stage. These authors also speculated about PAH emission at 7.8 m. However, in a survey of 2703 IRAS point sources at Dwingeloo, Effelsberg, and Parkes, examining the 1612 MHz OH-transition – which is one of the strongest lines for AGB stars, but decreases towards the PN stage – Te Lintel Hekkert et al. (TeLintel (1991)) did not detect emission from HD 155448.
Malfait et al. (Malfait (1998)) points out that, in order to distinguish between Herbig Ae/Be stars and post-AGB stars, one should also consider the ([],[])-colour diagram, since post-AGB stars show an important Balmer discontinuity, while the regions populated by both classes overlap in infrared colour-colour diagrams. They also show that several other currently well-accepted Herbig Ae/Be stars had previously been classified as transition objects between the AGB and the planetary-nebula stage. From the absence of a prominent near-IR excess (the excess only starts beyond 4.5 m), these authors consider HD 155448 to be a Vega-type candidate. Spectral energy distributions for the integrated fluxes have been given by Van der Veen et al. (Veen (1989)) and Malfait et al. (Malfait (1998)).
| Passband | Instrument | Date | Pixel scale | Airmass | |
| of night’s begin | [′′] | [sec] | |||
| EFOSC2 | Feb 26, 2006 | 0.157 | 8 | 1.3 | |
| EFOSC2 | Feb 26, 2006 | 0.157 | 8 | 1.2 | |
| EFOSC2 | Feb 26, 2006 | 0.157 | 8 | 1.2 | |
| SOFI | May 07, 2004 | 0.144 | 100 | 1.0 | |
| ADONIS | Jun 08, 2000 | 0.100 | 600 | 1.0 | |
| SOFI | May 07, 2004 | 0.144 | 100 | 1.0 | |
| NB 1.64 m | NACO | Sep 09, 2005 | 0.027 | 420 | 1.1–1.5 |
| ADONIS | Jun 08, 2000 | 0.100 | 600 | 1.0 | |
| SOFI | May 07, 2004 | 0.144 | 100 | 1.0 | |
| NB 2.12 m | NACO | Sep 09, 2005 | 0.027 | 435 | 1.1–1.5 |
| PAH2 (11.25 m) | VISIR | Apr 27 – Aug 05, 2005 | 0.075 | 5425 | 1.0–1.5 |
| PAH2_ref (11.88 m) | VISIR | Apr 27 – Aug 05, 2005 | 0.075 | 5425 | 1.0–1.6 |
| (18.72 m) | VISIR | Aug 26 – Sep 01, 2005 | 0.075 | 7948 | 1.0–1.2 |
| Passband | Instrument | Date | Slit | Spec. res. | Airmass | |
| of night’s begin | orientation | [sec] | ||||
| Grism 5 (5200–9350 Å) | EFOSC2 | Aug 19, 2007 | East-West | 300 | 1700 | 1.3 |
| Grism 11 (3380–7520 Å) | EFOSC2 | Mar 01, 2006 | A-C, B-C, C-D | 400 | 240 | 1.2 |
| Grism 11 (3380–7520 Å) | EFOSC2 | Apr 20, 2006 | East-West | 400 | 2700 | 1.0 |
| Grism 18 (4700–6770 Å) | EFOSC2 | Aug 19, 2007 | East-West | 600 | 2000 | 1.1 |
| Grism 19 (4441–5114 Å) | EFOSC2 | Aug 12, 2008 | A-C, B-C, C-D | 3000 | 420–1800 | 1.0–2.0 |
| Grism 20 (6047–7147 Å) | EFOSC2 | Aug 12, 2008 | A-C, East-West | 2500 | 420–1800 | 1.3–1.8 |
| 8–13 m | VISIR | Apr 15 – Sep 03, 2005 | East-West | 350 | 1800 | 1.0–1.4 |
| SL (5.5–14 m) | Spitzer/IRS | March 22, 2005 | see Fig. 3 | 160 | 12 | n/a |
| SH (10–20 m) | Spitzer/IRS | March 22, 2005 | see Fig. 3 | 160 | 60 | n/a |
| LH (19–38 m) | Spitzer/IRS | March 22, 2005 | see Fig. 3 | 160 | 24 | n/a |
Several important issues remain unclear:
-
•
What is the evolutionary status of this system? Does the excess emission point towards a pre-main sequence stage in which the star is surrounded by a disk? What is the composition of the material causing the IR excess emission?
-
•
Up to now it has not been proven whether the components are physically related. Are there more members to be discovered?
-
•
What is the actual distance of this system?
In this paper, we present the first high-resolution, multi-wavelength photometry and spectroscopy of the HD 155448 system intended to address the above questions. In Sect. 2 we derive new spectral types for all components and constrain the system’s evolutionary status and distance. In Sect. 3 we show that the B component itself is a binary, uncover arc-shaped IR emission near the C component, and derive the composition of the material emitting in the IR. After a discussion in Sect. 5, we round off with conclusions in Sect. 6.
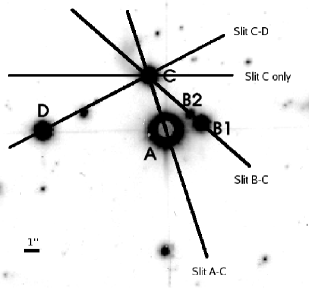
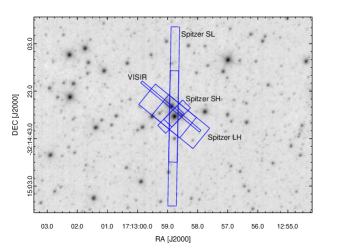
Tables 1 and 2 summarise the imaging and spectroscopic data presented in this work. A detailed description of the observations and data reduction is given in Appendix A. Tables LABEL:table:single-flux-1 and LABEL:table:single-flux-2 show the derived aperture photometry. The slit orientation of the spectroscopic data is illustrated in Fig. 1 for the optical spectra and in Fig. 3 for the infrared data.
2 Stellar properties derived from optical data
2.1 HD 155448 system members
In Table LABEL:table:single-flux-1, we give photometry of the individual components, apart from the B1 and B2 binary that was not resolved at optical wavelengths. Although HD 155448 was often referred to as a quadruple system, there is no clear proof of the membership of all components to this system. Could there be even more components among the neighbouring stars in the EFOSC2 field? Therefore, we plot all objects in a colour-magnitude diagram ( vs. ; see Fig. 4). We lack band data for an explicit extinction correction, so we did not deredden the data, but the resulting diagram is clearly different from an HRD, thus demonstrating that these stars are not at similar distances. A group of seven objects is separated from the broader distribution of field stars and appears to be at a similar distance. Four of these stars are HD 155448 A, B, C, and D. To account for the additional reddening of HD 155448 C caused by the CS material, we dereddened this component using = 3.7, a value chosen such that the remaining = 1.5 matches the mean reddening of the other components A, B1, B2 and D (see Table LABEL:table:spec-class). We derived the corresponding of HD 155448 C according to the interstellar extinction curve given in Savage & Mathis (Savage (1979)). The remaining three stars of the subgroup shown in the upper left of Fig. 4 are located 1–2′ away from HD 155448. Although they could be at a similar distance, they are separated too far to be part of the HD 155448 system (see also Sect. 2.5 for a discussion of the distance of the HD 155448 system). While we can exclude more system members by this test, the membership of HD 155448 C is not yet proven, although very likely: it is very unlikely to find five B-type stars of luminosity class V on such a small scale (60 arcsec2) by coincidence.
To estimate the likelihood of a chance grouping we considered galactic models. However, since the HD 155448 system is located in the direction towards the galactic centre (l353, b+04), we cannot apply common galactic models. Alternatively, we investigated the average distribution of B0V – B9V stars in this region in the SIMBAD database, and find two B-type main sequence stars per deg2 averaged over a 5 5 deg2 field, centred on the position of HD 155448. However, this census is incomplete due to the uncertain limiting magnitude in the SIMBAD database. More than 90% of the B-type stars found in this 5 5 deg2 field are from the HD catalogue, which according to Flynn & Freeman (Flynn (1993)) is complete down to a magnitude = 9.2 mag (but some objects in our SIMBAD test field are as faint as = 11.5 mag). The number of those B-type main sequence stars in the test field brighter than = 9.2 mag is one per deg2. We want to know how many B stars we can expect down to = 12.2 mag, corresponding to the faintest HD 155448 member, if we do not consider component C because of its extra extinction. In a standard assumption the number of stars multiplies on average by a factor 2.5 for each magnitude (see also, e.g., Table 3 in Roach Roach (1964)). Based on the count of one B-type star brighter than = 9.2 mag per deg2, this would result in about 16 B-type stars with luminosity class V brighter than = 12.2 mag that could be expected per deg2. The HD 155448 components cover an area of 60 arcsec2. Therefore, the probability that the entire HD 155448 system is a chance alignment is 10-5. We return to a discussion of the membership status in Sect. 4.
2.2 Derivation of spectral types
To derive the spectral type and luminosity class of the HD 155448 candidate members, we carefully compared our EFOSC2 spectra with high-resolution (R80000) spectra from the UVES Paranal Observatory Project spectral library111http://www.sc.eso.org/santiago/uvespop/ (Bagnulo et al. Bagnulo (2003)), the ELODIE (R42000) spectral library222http://atlas.obs-hp.fr/elodie/ (Soubiran et al. Soubiran (1998)), and the theoretical high-resolution (R500000) spectral library BLUERED333http://www.inaoep.mx/modelos/bluered/bluered.html by Bertone et al. (Bertone (2008)). We proceed in a similar way to Carmona et al. (Carmona (2010)). First, the template spectra were degraded down to the EFOSC2 resolution. We then used a dedicated interactive IDL-based software444Available from A. Carmona: andres.carmona@unige.ch that allowed us to compare the normalised target spectrum simultaneously (i.e., over-plotted) with a normalised template spectrum at a user-selected spectral feature. Target and template spectra were normalised either by the median or by a polynomial fit of second order to the flux in the windows used for the spectral comparison.
We compared our EFOSC2 spectra with the spectral templates spectral feature by spectral feature, employing a window of 20–100 Å width around the central wavelength of each feature. The selected spectral features used for comparison are taken from the “Atlas of stellar spectra” by Ginestet et al. (Ginestet (1992)) and the features recommended by Morgan, Keenan, & Kellman (Morgan (1943)) from “An atlas of stellar spectra with an outline of spectral classification”. To determine the luminosity class, we mainly employed the diagnostics of Ginestet et al. (Ginestet (1992)), described in the plates that show the effect of the luminosity for each sub-spectral type. In summary, the procedure consisted in the use of the Ginestet et al. (Ginestet (1992)) and Morgan, Keenan, & Kellman (Morgan (1943)) works to guide the choice of which spectral diagnostics to analyse, and to use the UVES, ELODIE, or BLUERED spectral library templates to compare the strengths and shapes of the lines to our spectra. Visually it is relatively straightforward to determine which spectral template matches the spectrum under analysis best. However, in cases of degeneracy (especially due to rotation), the template spectrum that exhibited the smallest residuals (square root of the summed square of the difference between the normalised template and target spectrum) was adopted as best match of the target spectrum.

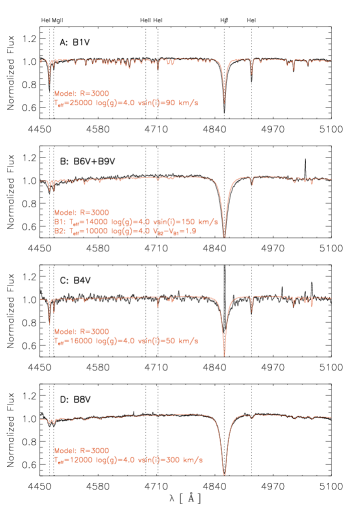
In Table LABEL:table:spec-class we present the derived spectral types. We find that all objects have spectral type B. In Fig. 5, we show the EFOSC2 spectra, together with BLUERED synthetic spectra with and of the derived spectral type. In the following paragraphs, we describe in detail the spectral classification of each source.
| Filter | A | B1 | B2 | C | D | Instrument |
| [mag] | [mag] | [mag] | [mag] | [mag] | ||
| 9.1 0.1 | 13.0 0.1 | 17.5 0.1 | 11.80 0.05 | EFOSC2 | ||
| (1) | 12.4 0.1 | 16.1 0.1 | 11.60 0.05 | EFOSC2 | ||
| (1) | 12.2 0.1 | 15.0 0.1 | 11.45 0.05 | EFOSC2 | ||
| 8.7 0.1 | 11.6 0.1 | (2) | 11.9 0.1 | 11.1 0.1 | SOFI | |
| 8.8 0.1 | 11.7 0.1 | (2) | 10.8 0.1 | 11.1 0.1 | SOFI | |
| NB_1.64 | 8.5 0.1 | 11.6 0.1 | 13.4 0.1 | 10.7 0.1 | 11.0 0.1 | NACO |
| 8.7 0.1 | 11.7 0.1 | (2) | 9.7 0.1 | 11.1 0.1 | SOFI | |
| NB_2.12 | 8.5 0.1 | 11.5 0.1 | 13.1 0.1 | 9.4 0.1 | 10.9 0.1 | NACO |
HD 155448 A:
The presence of He i in absorption lines and the lack of He ii indicates that HD 155448 A has a spectral type B. The lack of the He ii line at 4686 Å indicates that the star has a spectral type later than B0. Since the Mg ii line at 4481 Å is much weaker than the He i line at 4471 Å, the spectral type of HD 155448 A should be earlier than B5. The presence of the Si iii lines at 4553, 4568, and 4575 Å, the N ii line at 4631 Å, the O ii lines at 4639 and 4642 Å, and the C iii lines at 4650 Å indicate that HD 155448 A has a spectral type earlier than B1 if it has luminosity class V, and spectral type earlier than B2 if it is a giant. The strength of the O ii, N ii, and C iii lines is too weak, and the width of the He i lines and hydrogen lines (H) is too broad to be consistent with luminosity classes I and II. While the strength of O ii, N ii, and C iii lines is consistent with luminosity classes III and V, the width of the He i lines and H is broader than observed in stars of luminosity class III of spectral types B1 to B2. Therefore, HD 155448 A has a luminosity class V. Altogether, HD 155448 A has a spectral type B1V. We checked several values of , while the model spectrum giving the best fit suggested a = 905 km/s. The error represents the range of values that provide a comparable fit to the line profile shapes. The mean value given is the one displaying the smallest residuals, but there are a few values that are consistent with the observed spectrum.
HD 155448 B (B1+B2):
Because the components B1 and B2 are spatially unresolved, we consider them first as a single source. Given that component B1 is at least one magnitude brighter than component B2, the spectrum of HD 155448 B is dominated by B1. Since He i lines are present at 4471 and 4923 Å, and no He ii lines are observed, HD 155448 B should have a spectral type B. Very few He i lines in the range 4450–5100 Å are present. Therefore, HD 155448 B should be a late B-type star. The He i line at 4471 Å is just slightly stronger than the Mg ii line at 4481 Å. This indicates that HD 155448 B should have an earlier spectral type than B7 but later than B4. The (weak) strength of the He i lines at 4923 Å and the barely visible He i line at 4713 and 5015 Å indicate that HD 155448 B has spectral type B6 or later. Therefore, HD 155448 B most likely has the spectral type B6. The broad wings of the H line are not consistent with the luminosity classes I, II, III, and IV, even when considering a as high as 300 km/s. In consequence, HD 155448 B is a dwarf star. We conclude that HD 155448 B is a star of spectral type B6V. The 3000 model spectrum with the best fit suggests a = 15050 km/s.
| Filter | C | C + Arc | Instrument |
|---|---|---|---|
| [Jy] | [Jy] | ||
| PAH2 (11.25 m) | 0.51 10% | 0.92 10% | VISIR |
| PAH2_ref (11.88 m) | 0.44 10% | 0.55 10% | VISIR |
| (18.72 m) | 0.73 10% | 1.46 10% | VISIR |
The light of HD 155448 B is dominated by B1. The near-IR images show that the B2 component is 1–2 magnitudes fainter than B1. In the EFOSC2 spectrum, we notice that the wings of the H line and the He I line at 4471 Å are slightly broader than expected for a B6V star even when including a large (200 km/s). These spectral characteristics allow us to set constraints on the spectral type of the B2 component. Assuming the same distance towards B1 and B2 – and the same extinction – the difference in brightness of 1–2 magnitudes indicates that B2 can have a spectral type ranging from B8 to A5. Employing the BLUERED templates degraded at the EFOSC2 resolution, we constructed synthetic binary star spectra with a B6V primary and a B8V to A5V secondary, taking care of scaling the fluxes of each component conforming to their absolute magnitude. Using our software for spectral comparison, we visually compared the synthetic binary spectra and our EFOSC2 spectrum of HD 155448 B. We found that the spectrum B6V+B8V is ruled out because the resulting Mg ii line at 4481 Å is stronger than the He i line at 4471 Å. The spectra B6V+A1V to B6V+A5V were ruled out because the secondary is too faint to have a noticeable effect on the wings of the H line. We found that the combinations B6V+B9V and B6V+A0V offered the best fits to the H line and the relative strengths of the Mg ii and He i lines. As the smallest residuals were displayed by the B6V+B9V binary spectrum, we suggest that the spectral type of the B2 component is B9V. Several values of between 100 and 200 km/s gave similar solutions, so we assumed for component B2 a of 15050 km/s as derived for component B1.
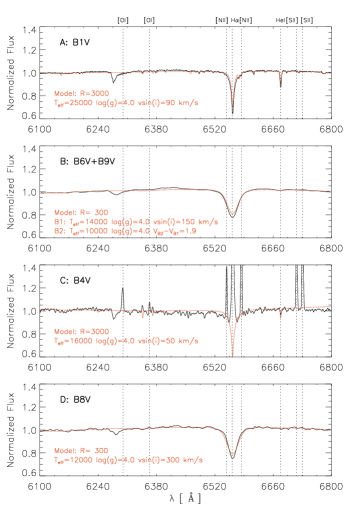
HD 155448 C
exhibits He i lines in absorption but no He ii lines. Therefore, HD 155448 C has a spectral type B. As the He i lines have an FWHM of 240 km/s, HD 155488 C is likely rotating fast, at least at of 150 km/s. Emission lines are observed most notably H, a narrow emission component inside the H line, and [O i], [N ii], and [S ii] forbidden emission (see Table LABEL:table:emission-lines). The lack of a strong He i line in absorption at 4713 Å indicates that HD 155448 C should be later than B1. At our there is no evidence of strong Si iii lines at 4553, 4568, and 4575 Å, and C iii lines at 4647 and 4651 Å. Therefore, HD 155448 C should have a spectral type later than B2. As the Mg ii at 4481 Å line is weaker than the He i line at 4471 Å, HD 155448 C has a spectral type earlier than B7. In addition, the relative strength between these two lines indicates a spectral type later than B3. The strength of the He i, Mg ii, and the H line are best matched with the spectral type B4. The lack of Si iii lines at 4553 and 4568 Å and the broad H line wings rule out the luminosity classes I, II, and III. The lack of a strong He i line at 5047 Å is not consistent with luminosity classes III and IV. Considering all these characteristics, we conclude that HD 155448 C has a spectral type B4Ve. The model exhibiting the best fit suggests a = 5010 km/s.
HD 155448 D:
The spectra of HD 155448 D display broad He i lines ( 370 km/s). Given that no He ii absorption lines are present, HD 155448 D has a spectral type B. The He i line at 4471 Å and the Mg ii line at 4481 Å have a very similar strength (with Mg ii just slightly stronger). This indicates that HD 155448 D has a spectral type later than B6 but earlier than B8. The strength of the He i lines at 4923 and 5015 Å is too weak to be consistent with the spectral types B6 and B7, thus HD 155448 D should have a spectral type B8. Taking the rotational broadening into account, the width of the wings of the H line is too large to be consistent with luminosity classes I, II, III, and IV. As the luminosity class V is the one that matches the observed spectrum best, we conclude on a spectral type B8V for HD 155448 D. The 3000 model with the best fit suggests a = 30015 km/s.
| Star | Type | (kpc) | |||
|---|---|---|---|---|---|
| Aa | B1V | 3.2 | 0.27 | 1.00.5 | 1.7 |
| B1b | B6V | 0.9 | 0.15 | 2.30.9 | 1.9 |
| B2c | B9V | 0.2 | 0.08 | 2.30.9 | 1.9 |
| C | B4Ve | 1.4 | 0.19 | 5.20.5 | 2.8 |
| D | B8V | 0.3 | 0.11 | 0.60.5 | 1.8 |
2.3 Emission lines in HD 155448 C
Emission lines are only seen in the C component. Their intensity, in general, is stronger for the slit orientation covering the full extent of the arc, slit B-C (see Fig. 1), indicating that the circumstellar matter to the northeast is also a source of the emission lines. H (single-peaked) represents the strongest line, while the forbidden lines [S ii], [N ii], and [O i] are fainter. In the following analysis of the emission lines and their spatial extension, we focus on the highest resolution EFOSC2 data, observed in August 2008 with Grism 20 in an east-west slit orientation, because a contamination by the brighter component cannot be excluded for the A-C slit orientation.
As is unknown, the spectrum is centred such that He i at 6678 Å – the only photospheric line in Grism 20 – lies at v = 0 km/s. This results in a velocity shift of () = +28 km/s. The error in the fit of a Gaussian to the He i line was 9 km/s. Together with the general wavelength calibration uncertainty of 4 km/s, the absolute error in the line position is then 10 km/s, while the relative error between two lines is , with a typical error in the line centre of 2 km/s, resulting in a relative error of 4 km/s.
To analyse the spatial extension of the emission lines in the eastern direction, we calculated position-velocity diagrams, from which we subtracted the continuum PSF (see Fig. 7). The derived line velocities, widths, and their spatial offset and extension in the eastern direction are given in Table LABEL:table:emission-lines. We summarise our analysis of the HD 155448 C emission lines as follows.
-
•
All emission lines are spatially extended in the eastern direction up to 4″. The [O i] line at 6300 Å is significantly less extended than the other lines, while the [O i] line at 6363 Å is unresolved.
-
•
All emission lines appear to have a similar velocity shift of 10 km/s, except [O i] at 6300 Å, which is around 0 km/s. Given that the error on the relative position of the emission lines is less than the observed shift (see details above), this shift in the forbidden emission lines is most likely real. Within their errors, [S ii], [N ii], and H are at the same velocity.
-
•
The [O i] line at 6363 Å shows a large error in its velocity, caused by the weakness of this line. We do not discuss this line in the following, and often refer to the [O i] 6300 Å line as [O i] instead.
The analysis of the line velocities and spatial offsets suggests two components in the circumstellar material. One extended component, traced by the [N ii], [S ii], and H lines, may be receding from us, possibly in the form of a wind or outflow towards the arc, but a full interpretation of the system geometry is difficult (see the end of Sect. 5.3). A second, less extended component, traced by the [O i] line, is close to 0 km/s, but a motion in our direction may also be possible within the error (cf. Table LABEL:table:emission-lines). As the projected velocities are much lower than 100 km/s, which would be a characteristic value for a massive outflow or jet, the gas may be moving in a direction close to the plane of the sky, but the low velocities could also be intrinsic. We return to a discussion of the forbidden emission lines in Sect. 5.2.
| Line | EW | FWHM | Centre | Offset | Extension in E | |
|---|---|---|---|---|---|---|
| (Å) | (Å) | [km/s] | [km/s] | [] | [] | |
| 6300 | [O i] | 1.0 | 100 6 | 4 10 | 0.24 0.06 | 2.0 |
| 6363 | [O i] | 0.3 | 100 19 | +13 14 | 0.24 0.06 | unresolved |
| 6548 | [N ii] | 1.7 | 91 6 | +13 10 | 0.60 0.06 | 3.0 |
| 6563 | H | 23 | 95 4 | +13 10 | 0.60 0.06 | 4.5 |
| 6583 | [N ii] | 4.3 | 91 4 | +11 10 | 0.84 0.06 | 3.5 |
| 6716 | [S ii] | 4.0 | 88 4 | +9 10 | 0.36 0.06 | 3.5 |
| 6731 | [S ii] | 6.1 | 88 4 | +10 10 | 0.36 0.06 | 3.5 |
Could the arc matter have influenced the spectrum of HD 155448 C? As shown in Fig. 7 and in Table LABEL:table:emission-lines, we see that the peaks of most emission lines are inside a region corresponding to the PSF of HD 155448 C. At the given spatial resolution, this indicates that most of this emission is associated with the star. If the forbidden emission was dominated by the arc matter, we would have observed a clearly higher spatial offset of the emission line peaks. Nevertheless, some contribution of the arc matter can be expected as well. In particular, the arc’s inner border towards HD 155448 C cannot be defined clearly, and the forbidden emission lines seem to originate in a transition region.
High spatial and spectral resolution spectroscopy is required to determine the contribution of arc matter and to better constrain the velocities of the gas.
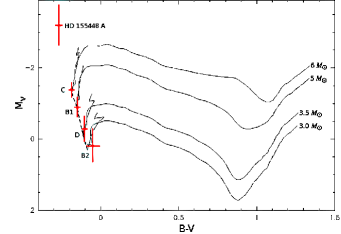
2.4 Age
In Fig. 6 we plot the derived and colours from Table LABEL:table:spec-class in a colour-magnitude diagram with PMS and main sequence evolution tracks from Siess et al. (Siess (2000)). Only the tracks for the initial masses corresponding to spectral types of the HD 155448 system are shown, which is 3.0 (B2), 3.5 (D), 5 (B1), and 6 (C). Because the Siess models are only available up to 7 , corresponding to spectral type B3, HD 155448 A would be located above these tracks, as its mass is higher than 7 . Within the errors, all stars are very close to the ZAMS, thus showing that the system is not a post-AGB or pre-PN object, as stated in the literature.
2.5 Distance
The error on the Hipparcos parallax (1.651.99 mas; Perryman et al. Perryman (1997)) is too large to derive a meaningful distance, which nominally would correspond to 606 pc, with an open upper distance limit. Therefore, to constrain the distance of the HD 155448 components, we have to rely on the derived spectral types and photometry. In Table LABEL:table:spec-class, we list the appropriate absolute magnitudes for the corresponding spectral classification, obtained from Schmidt-Kaler (Schmidt (1982)). The estimated reddening was derived from the observed colours, the intrinsic colours given by Schmidt-Kaler (Schmidt (1982)), and it assumes a standard reddening law ()
The distance follows from the classical distance modulus:
Since the band image is saturated for component HD 155448 A, to estimate for component A we used as given in SIMBAD, and derived from our EFOSC2 data. Using the Hipparcos would result in a 0.3 kpc closer distance for HD 155448 A. The components B1 and B2 are not resolved in the EFOSC2 images, but only separated in the infrared. We estimate their individual and magnitudes from the observed combined magnitude, by using the difference in the expected absolute magnitudes between spectral types B6V and B9V (, ). For example, to derive the magnitude of each component we used
.
In this way, we obtained mag and mag for the component B1, and for component B2, mag and mag.
We summarise the results of the distance determination in Table LABEL:table:spec-class. The distances to all components are consistent within their errors, with a mean distance of 2.2 kpc. While the uncertainty in the distance estimate seems large, we emphasise that these error ranges are mainly caused by an uncertainty of only one subclass in the spectral type derivation.
3 Results derived from infrared data
3.1 A fifth component in the HD 155448 system
 |
 |
 |
 |
To our knowledge, this paper offers the first high-resolution, adaptive optics observations of the HD 155448 system. The ADONIS data reveal that the component HD 155448 B can be resolved into two stars (cf. Fig. 1) with a separation of 1.210.04′′. This additional companion is also visible in NACO and SOFI data. In NACO data, the separation is 1.160.01′′, and 1.140.05′′ for SOFI. Subpixel accuracy was applied in calculating the component separations. We do not want to speculate about whether we see any motion during the five years between these data sets, because all results (marginally) overlap within their error ranges. The photometry is given in Table LABEL:table:single-flux-1.
3.2 Imaging and photometry
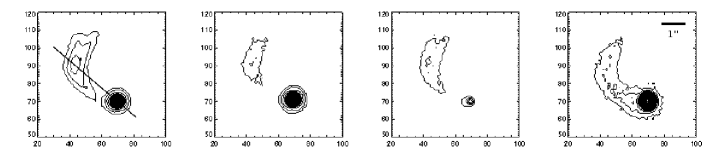
In the images we found arc-shaped emission, curving from HD 155448 C towards the northeast. This feature is seen both in the near- and mid-IR, and is also visible in optical data. The extension is up to 3″ from HD 155448 C in all the observed passbands. A difference in length of 0.2″ between the filters may depend on the sensitivity of the individual data sets. The inner end of the arc, facing towards HD 155448 C, is not clearly constrained. At optical wavelengths, in the near-IR and in the mid-IR around 10 m, little extra emission is seen very close to the star, while significant emission starts at distances beyond 1.0″ from HD 155448 C. In the mid-IR PAH band filter and at shorter wavelengths, the intensity is maximal in the arc’s centre. The appearance in the band filter is clearly different, where the arc extends all the way towards the star. Moreover, the peak of the emission is now located close to the star, in an area that shows nearly no emission in the near-IR or at visual wavelengths.
Tables LABEL:table:single-flux-1 and LABEL:table:single-flux-2 list the photometry for all passbands used in this work. Only for adaptive optics data was it possible to obtain resolved photometry for the B2 companion. The SOFI and NACO magnitudes agree well within their errors, despite the problems calibrating the NACO data (see Appendix A.4). For VISIR we performed PAH-on (11.25 m) and PAH-off differential imaging (continuum around 11.88 m), and subtracted both frames after a re-centring with 0.1 pixel accuracy. For a description of the errors in the photometry, we refer to Appendix A.5.1. In Table LABEL:table:single-flux-2 we also give for VISIR the total flux of HD 155448 C plus the circumstellar matter in the arc, because resolving both is not accurately possible in the band, as is recognisable in Fig. 8.
3.3 Mid-IR spectroscopy
3.3.1 VISIR

We used VISIR low-resolution spectra to study the composition of the circumstellar matter close to HD 155448 C and in the arc. None of the other stellar components is detected in the mid-IR, what was also seen in our previous test observations using the TIMMI2 mid-IR camera at ESO La Silla Observatory, which has a larger field of view than VISIR. However, our mid-IR narrow-band filters used cover only a small – although representative – range of the band. An eventual mid-IR emission originating in the remaining HD 155448 components at other band wavelengths cannot be fully excluded. The slit orientation and the procedure for disentangling the emission near the star from that of the arc is explained in Appendix A.5.2.
HD 155448 C
: The spectrum of HD 155448 C is dominated by silicate emission between 8–12 m (Fig. 9, left panel). For a description of silicate emission features at these wavelengths, we refer, e.g., to Schütz et al. (Schuetz (2009)) and references therein. The silicate feature of HD 155448 C can be interpreted as emission mainly from small, amorphous silicate grains located in the hot surface layer of a circumstellar disk. A smaller peak at 11.3 m indicates either the presence of crystalline silicates or of polycyclic aromatic hydrocarbons (PAHs), which both exhibit an emission peak around this wavelength. We provide more details on the dust composition in Sect. 3.3.2.
Arc
: Unlike for the spectrum of the stellar component, we see no silicate features related to the arc. Here, the spectrum is dominated by strong PAH bands at 8.6, 11.3, and 12.7 m. We also see fainter PAH features at 11.0 and 12.0 m. In Table LABEL:tab:pah we give a detailed list of the measured properties of the observed features and of the bending modes that can cause them (from Hony et al. Hony (2001)). Based on the spectral appearance of PAH bands, Peeters et al. (Peeters (2002)) define characteristic PAH classes A / B / C, which represent different stages of PAH processing. By comparing the peak position of the PAH bands in our spectrum to these classes, it is clear that the arc’s PAH features do not belong to the highest processed class C, as there is a strong feature at 8.6 m that is absent in class C sources (Peeters et al. Peeters (2002)). To decide on class A or B, we need to also consider the PAH bands between 6–8 m, and refer to the Spitzer spectrum in the next section. In Fig. 10, we compare the PAH spectrum of the arc with that of the mean ISM and that of HD 169142, a prototype of PAH features observed in Herbig Ae/Be stars (see Acke et al. Acke2010 (2010)). It is clear that the arc spectrum is more like that of the ISM than of the Herbig Ae star, especially when focussing on the region near 11 m. The small feature at the base of the 11.3 m band towards shorter wavelengths is the 11.0 m PAH band, which is attributed to the out-of-plane bending of CH in PAH cations. Therefore, its emission is an excellent tracer of ionised interstellar PAHs. Indeed, in a large sample of isolated Herbig Ae/Be stars, the 11.0 m feature is absent (Acke et al. Acke2010 (2010)). This suggests that the arc-shaped, PAH emitting region is not directly related to the disk around HD 155448 C, but rather an ISM remnant of the stellar formation process.


3.3.2 Spitzer
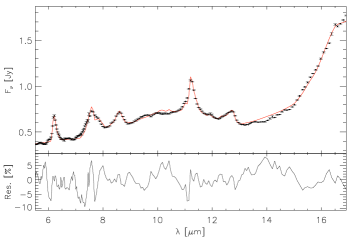
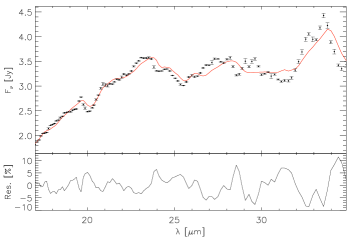
As described in Sect. 3.3.1, we see the emission from HD 155448 C and the arc in the mid-IR. However, in the Spitzer spectra the emission from both sources is not spatially resolved. To derive the composition and physical parameters of the dust grains, whose emission features are clearly visible at mid-IR wavelengths, we used the two-layer temperature distribution (TLTD) method. For details of the spectral analysis method, as well as for the applied optical constants of the dust species used, we refer to Juhász et al. (Juhasz (2009)). The spectrum was fitted in two wavelength regions: short (5–17 m) and long (17–35 m), with five dust components: amorphous silicates with olivine and pyroxene stoichiometry, crystalline forsterite and enstatite, and amorphous silica. Three different grain sizes were used for the amorphous silicate and silica components (0.1, 1.5, and 6.0 m), while only two for the crystals (0.1 and 1.5 m), as no evidence was found for large crystals in the spectrum. A mean ISM PAH template from Hony et al. (Hony (2001)) was used to derive the individual PAH band profiles for the fits. The results are shown in Fig. 11 and Table LABEL:tab:spitzer.
Silicates
: The absolute flux level in the Spitzer IRS spectrum is higher in the 8–13 m interval than in the VISIR spectrum, indicating that the Spitzer spectra may include more emission from the surrounding material due to the wider slit. The dust composition in the 10 m region is dominated by small (0.1 m) amorphous grains. The low peak-to-continuum ratio of the 10 m silicate feature, which is usually explained by the presence of large grains, is probably caused by the high extinction towards HD 155448 C. Crystalline silicates represent only about 13 % of the total silicate mass in the short interval. This is a normal value among Herbig Ae/Be stars (see, e.g., Juhász et al. Juhasz2010 (2010) or van Boekel et al. Boekel05 (2005)). The crystal population is dominated by forsterite, whereas the contribution of enstatite is negligible. When comparing the fit of the short interval with that of the long interval, we see that the forsterite-to-enstatite mass ratio decreases with wavelength (i.e. with radius in the disk), similar to what is observed in other Herbig Ae/Be systems (Juhász et al. Juhasz2010 (2010)), and even T Tauri stars (Meeus et al. Meeus (2009)). We note that, although the general quality of the fit is good, there are mismatches between the observed and the model spectrum. In the short region these mismatches are related to the PAH features, because their shape was not perfectly reproduced by our model templates. In the long wavelength interval, the crystalline silicate bands in our model seem to be systematically shifted towards longer wavelengths than in the observed positions. These uncertainties in band positions are likely related to grain shape effects and/or to the dependence of the mass-absorption coefficients on the temperature that is not included in our analysis (see also Juhász et al. Juhasz2010 (2010) for a discussion on this topic).
PAH features
: The observed shape and positions of the PAH bands in the spectrum of HD 155448 C are consistent with that of a Class A profile in Peeters et al. (Peeters (2002)), typically found in the ISM (cf. also Sect. 3.3.1, paragraph on the arc).
-
•
The dominance of the 7.6 m sub-band over that of the 7.8 m sub-band in the 7.7 m PAH feature complex suggests that the emitting molecules are small (number of carbon atoms 90–100) and ionised (Bauschlicher et al. Bauschlicher (2008)).
-
•
Acke et al. (Acke2010 (2010)) find decreasing aliphatic over aromatic line strength ratios with increasing stellar effective temperature. This correlation is explained by the higher stability of the aromatic bonds against the destructive UV photons compared to the aliphatic bonds. Given that no evidence was found for aliphatic emission features (at 6.8 m and 7.2 m) in its spectrum, HD 155448 seems to follow this trend.
-
•
Hony et al. (Hony (2001)) and Keller et al. (Keller (2008)) interpret the 6.2/11.2 m and 12.7/11.2 m line strength ratios as indicators of the ionisation state and irregularity of the molecules. Comparing the calculated line strength ratios of HD 155448 (F6.2/F11.2 = 1.52 0.12, F12.7/F11.2 = 0.42 0.04) to Fig. 5 in Hony et al. (Hony (2001)), the PAH molecules in the arc near HD 155448 C are probably ionised and irregular, pointing to PAH processing by the relative intensive UV field in the HD 155448 environment.
4 Position and motion
We do not aim to give absolute astrometry, since the coordinates were not derived by means of astrometric standard stars. At the time of our observations, both ADONIS and EFOSC2 data had not yet been offered with a world coordinate system, which we were able to fix for the EFOSC2 files. Obviously, the NACO adaptive optics data permit a much more precise calculation of positions and angles than the SOFI frames, but the rather short time in between these two data sets (one year) does not permit calculating component motions at the distance of the HD 155448 system. Therefore, we focus only on the NACO data in Table LABEL:table:positions. The errors in our RA and Dec can be determined from the positional uncertainty in the data sets of various nights, which were taken with different guide stars. (The astrometric accuracy is limited by the accuracy of the guide star coordinates.) We do not quote RA and Dec for the literature data, as the VizieR web interface points out that their accuracy could be low.
| Feature | Bending Mode | Peak Position | Central Wavelength |
|---|---|---|---|
| (m) | (m) | (m) | |
| 6.2 | CC stretching | 6.21 | 6.23 |
| 7.6 | CC stretching | 7.58 | 7.58 |
| 7.8 | CC stretching | 7.82 | 7.85 |
| 8.6 | CH in plane | 8.64 | 8.66 |
| 11.0 | CH out of plane | 11.03 | 11.02 |
| 11.3 | CH out of plane | 11.25 | 11.26 |
| 12.0 | CH out of plane | 12.01 | 12.01 |
| 12.7 | CH out of plane | 12.75 | 12.63 |

| Parameter | Grain | Mass fraction/ | Mass fraction/ |
|---|---|---|---|
| size [m] | PAH intensity | PAH intensity | |
| (5–17m) | (17–35m) | ||
| 61.8 | 91.1 | ||
| Amorph. Olivine | 0.1 | 71.2 | 32.1 |
| Amorph. Olivine | 1.5 | 8.2 | 53.1 |
| Amorph. Olivine | 6.0 | - | - |
| Amorph. Pyroxene | 0.1 | - | - |
| Amorph. Pyroxene | 1.5 | - | - |
| Amorph. Pyroxene | 6.0 | - | - |
| Cryst. Forsterite | 0.1 | 2.8 | 5.2 |
| Cryst. Forsterite | 1.5 | 10.3 | - |
| Cryst. Enstatite | 0.1 | - | 1.9 |
| Cryst. Enstatite | 1.5 | - | - |
| Amorph. Silica | 0.1 | 5.3 | - |
| Amorph. Silica | 1.5 | 1.0 | 5.3 |
| Amorph. Silica | 6.0 | - | 2.3 |
| PAH 6.2 | 0.285 | - | |
| PAH 7.6 | 0.227 | - | |
| PAH 7.8 | 0.189 | - | |
| PAH 8.6 | 0.226 | - | |
| PAH 11.3 | 0.352 | - | |
| PAH 12.7 | 0.137 | - |
Can we see evidence for a gravitationally bound motion of the HD 155448 components? The proper motion of RA 2.77 mas/yr and Dec 0.85 mas/yr, together with their uncertainties of the same order (Perryman et al. Perryman (1997); the catalogue entry refers only to HD 155448 A), could – during the past 80 years – have caused a change in up to 0.4″ for unbound stars, depending on how the mean proper motion and its uncertainty would coadd. This value could eventually be doubled, when the random motion of two stars would be in the opposite direction. Such a large motion is not seen between the components A, B, and C. On the other hand, the mean proper motion and its uncertainties could also result in lower values. Without knowledge of the precise coordinates from the years 1911 and 1928, respectively, we cannot analyse the precise trajectories of the components. However, no significant angular motion is seen between now and 80 years ago.
5 Discussion
5.1 SED of the HD 155448 system
Our analysis shows that HD 155448 is a young quintuple system, in contrast to earlier descriptions in the literature referring to it as a post-AGB star. This earlier classification was, however, only based on IRAS colours, which does not permit a unique classification (cf. Sect. 1).
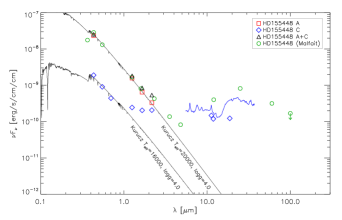
Based on the interpretation of the SED, Malfait et al. (Malfait (1998)) derived the presence of a large inner hole in the disk of HD 155448 A. However, due to missing spatial resolution in the photometry, their SED merged the fluxes of HD 155448 A, dominating the visual wavelengths, and the mid-IR emission from HD 155448 C. In Fig. 12, we plot resolved SEDs for both components. Our photometry is dereddened and plotted in comparison to a Kurucz atmosphere model (Kurucz Kurucz (1994)). The sum of the spatially resolved photometry of HD 155448 A and C agrees well with the spatially unresolved data of Malfait et al. (Malfait (1998)). This means that, instead of a single transitional disk, the HD 155448 system hosts four stars with very little or no circumstellar material and one with a disk. Substantial NIR excess emission is seen for HD 155448 C. If this emission indeed originates in a circumstellar disk, there is no reason to assume an inner hole, but rather a hot inner rim.
Besides the quintuple, we uncovered an arc-shaped emission region northeast of HD 155448 C. We exclude the possibility that the arc could be a chance alignment because in the band, we see that the circumstellar matter is connected with the star (Fig. 8). But what is the origin of this circumstellar matter and what causes the observed elongated curved emission?
5.2 Origin of the forbidden emission lines
For late-B and A-type Herbig stars, the formation of a circumstellar disk during the stellar formation process is theoretically predicted. The observed geometry of the circumstellar matter is less clear for early-B stars, where the material may be present both in spherical (envelope) and disk-like geometries. The classical Be star phenomenon is explained by ejected gaseous matter in an equatorial disk around a rapidly rotating star (see, e.g., Porter & Rivinius Porter (2003)). In this model, line emission other than from hydrogen is typically much weaker. Neither the strong forbidden lines nor the arc-shaped circumstellar matter could be explained with this scenario.
| Observation | Source | Component | RA | Dec | ||
| (year) | [′′] | [∘] | [J2000.0] | [J2000.0] | ||
| 1928 | DN2002 | A | 0 | 0 | ||
| 1928 | DN2002 | B | 2.9 | 280 | ||
| 1928 | DN2002 | C | 4.2 | 16 | ||
| 1911 | DN2002 | D | 9.9 | 91 | ||
| 2005 | NACO | A | … | … | 17:12:58.79 0.01 s | 32:14:33.7 0.1 s |
| 2005 | NACO | B1 | 2.84 0.01 | 279.8 0.3 | 17:12:58.57 0.02 s | 32:14:33.2 0.1 s |
| 2005 | NACO | B2 | 2.26 0.01 | 302.7 0.3 | 17:12:58.64 0.01 s | 32:14:32.5 0.1 s |
| 2005 | NACO | C | 4.39 0.01 | 16.6 0.3 | 17:12:58.89 0.02 s | 32:14:29.5 0.1 s |
| 2005 | NACO | D | 9.43 0.01 | 90.4 0.3 | 17:12:59.54 0.02 s | 32:14:33.8 0.1 s |
The forbidden [O i] emission line is observed in a wide range of astrophysical objects, and seen around both young and evolved stars. For Herbig Ae/Be systems, Acke et al. (Acke (2005)) find a correlation between the strength of the [O i] line at 6300 Å and the far-IR excess and show that stars with a flared disk geometry are more likely to exhibit the [O I] line than self-shadowed disks. In these objects, the [O i] line observed is centred at the star’s velocity and is double peaked, therefore indicating that the emission arises from the circumstellar disk. The appearance of [O i] together with [S ii] in emission is commonly observed for accretion phenomena and outflows both in massive and low-mass stars (e.g., Hartmann & Raymond Hartmann (1989); Hartigan et al. Hartigan (1995)), while both lines are quite common in Herbig Ae/Be systems. Vieira et al. (Vieira (2003)) find the forbidden [O i] lines (6300 and 6363 Å) and [S ii] lines (6716 and 6731 Å) for 46% of their 131 Herbig Ae/Be candidate stars, and find a higher occurrence of those lines among B-type stars and those objects that have stronger circumstellar emission.
We see indications of a wind or outflow from HD 155448 C. The velocities of the [S ii] and [N ii] lines, which are spatially extended in direction towards the arc, point to a wind that is receding from us (cf. Sect. 2.3) and that probably may interact with remnant matter of the star formation process located in the arc. Indeed, jets and collimated outflows from early B-type stars are observed for objects on the ZAMS (see, e.g., Shepherd Shepherd (2005)).
Why is the [O i] emission not part of this receding wind? In a study of forbidden emission lines in T Tauri and Herbig Ae/Be stars, Hamann et al. (Hamann (1994)) found that the different lines are formed at distinct densities and temperatures in the circumstellar environment. While [O i] needs a relatively high density, this is much lower for [N ii] and even lower for [S ii]. If an outflow exists from HD 155448 C, it implies a radial decrease in density with distance from the star. This agrees with our observation, where [O i] is found closer to the star than the other two forbidden lines (cf. Table LABEL:table:emission-lines). These regions overlap to some extent, but each one is dominated by a different transition.
Multicomponent winds were also found in, e.g., DG Tau and HL Tau (Solf & Boehm Solf (1993)), where the low-velocity [O i] 6300 Å components coincide with the star, while the high-velocity components [N ii] and [S ii] are distributed along the jet direction. No high-velocity components exist in HD 155448 C, but within the different velocities, this system might be a similar scenario. The low wind velocities may be intrinsic or caused by a projection effect. Some of the observed [O i] emission might also originate in the disk around HD 155448 C, but the link to a wind origin relies on the fact that the [O i] line is observed slightly extended to the east (see Fig. 7).
We note that the interpretation by means of a wind or outflow is not a unique solution of the HD 155448 system geometry, and discuss an alternative possibility at the end of Sect. 5.3.
5.3 The arc
We could not find a scenario that perfectly explains the emission pattern observed around HD 155448 C. The silicates and PAHs represent remnant interstellar matter, the first one probably located in a disk around HD 155448 C, the latter in the more extended, asymmetric arc. There are two possible scenarios:
-
•
A circumstellar disk or envelope exists around HD 155448 C, with the MIR flux dominated by emission from hot silicate grains. The arc to the northeast constitutes remnant matter from the stellar formation process. The PAHs in the arc are excited by the irradiation of all close B-type stars. The wind or outflow originating in HD 155448 C impacts the ISM and thus creates its arc-shaped form.
-
•
In an alternative scenario we may speculate on the formation of another, so far undetected, late-type protostar in the HD 155448 system, located at the central part of the arc. As the stellar formation timescales are much larger for lower masses, typically 107 vs. 104 years, this protostar could still be embedded in its parental cloud. Indeed, in the mid-IR we see a knot in the central part of the arc, which is less prominent in the near-IR and not observed at optical wavelengths. The arc’s shape may have been caused by the interaction of the wind with the envelope of this hypothetical low-mass object.
We favour the first scenario, because, although the other alternative is plausible, we were not able to provide more support for it with this work. Altogether, we suggest the following interpretation: there is an outflow from HD 155448 C in the direction of the arc. The latter is composed of remnant material of the star-forming process and illuminated by the radiation of the stars. Its PAHs are partly ionised and resemble ISM material. The forbidden emission lines trace several wind components along the outflow, with [O i] centred on the star, where the outflow density is highest and the velocity component close to zero, while [N ii] and [S ii] are formed at greater distances from HD 155448 C, where the outflow density is lower and the wind velocity higher.
An important limitation of the outflow interpretation is that only the receding (redshifted) outflow component is seen. Because in our observations we do not have evidence of material blocking the preceding (blueshifted) outflow component, we must conclude that the outflow in HD 155448 C has only the single component receding from us. There may be the following explanations.
-
•
Lovelace et al. (Lovelace (2010)) show that an intrinsically one-sided wind can indeed occur for a rapidly rotating protostar with a magnetosphere in the propeller regime and with a magnetic field consisting both of a dipole and a quadrupole component. Whether such a configuration may apply to HD 155448 C is not known, since additional data would be needed for a detailed investigation of the magnetic field.
-
•
Alternatively, we may also interpret the redshifted forbidden line emission as originating in infalling remnant matter of the star-forming process. In this case the arc material will be situated in the foreground of HD 155448 C.
With the data presented in this work, we cannot decide which of these explanations is the more likely one. Spectra with both higher spectral and spatial resolution, ideally obtained with an integral field unit, are needed to better understand the physical interactions between HD 155448 C and its surrounding matter. To set constraints on a magnetic field of HD 155448 C, spectropolarimetric observations at a high spatial resolution are required. Given the rather faint magnitude of HD 155448 C, these follow-up observations will be ambitious.
6 Conclusions
We presented multi-wavelength photometry of the HD 155448 system, covering the optical and near- and mid-IR ranges, from the to the bands. From the optical spectra we derived the spectral types of all five components. HD 155448 C shows strong emission lines, while circumstellar matter in an unusual, arc-shaped form is seen within 3″ northeast of HD 155448 C. The main results of this study follow.
-
1.
Near-IR images obtained with ADONIS, SOFI, and NACO revealed that HD 155448 B is a binary. Including this discovery, the system now comprises five objects within 12″. Our distance estimate from spectral parallaxes indicates that all stars are at a similar distance of 2 kpc, but the error of 0.7 kpc is rather large, stemming from the fact that B star luminosities vary strongly with one subclass uncertainty in the spectral classification.
-
2.
From EFOSC2 optical spectroscopy of all five sources, we determined their spectral types as B1V (HD 155448 A), B6V (HD 155448 B1), B9V (HD 155448 B2), B4Ve (C), and B8V (D).
-
3.
In a colour-magnitude diagram with stellar evolutionary tracks from Siess et al. (Siess (2000)), the HD 155448 components B1, B2, C, and D are located very close to the ZAMS (while the mass of HD 155448 A has no corresponding track in the Siess models). Earlier classifications of HD 155448 as a transition object from post-AGB to pre-PN are not consistent with this location.
-
4.
HD 155448 C exhibits strong emission lines of H and [S ii], as well as lines of [N ii] and [O i]. All emission lines in HD 155448 C are spatially extended in the eastern direction up to 4″and appear to have a similar velocity shift, except the [O i] line, which is significantly less extended in spatial direction and close to the rest velocity of the star.
-
5.
No significant orbital motion in the HD 155448 system was observed, neither in the time span of our data sets between the year 2000 to 2005 nor when considering literature data from 80 years ago, though the uncertainties in the latter data did not permit an exact comparison.
-
6.
Only HD 155448 C is detected in the mid-IR. From VISIR 10 m spectroscopy, we see that the C component is surrounded by small, warm silicate grains, suggesting the presence of a circumstellar disk. In contrast, the emission features in the arc are entirely of PAHs. Their PAH band signature is more characteristic of ionised matter than of a circumstellar disk.
-
7.
We find no scenario that could satisfactorily explain the shape and nature of the arc. A wind or outflow originating in HD 155448 C may impact the ISM, thereby creating its arc-shaped form. Alternatively, we may speculate about an interaction of the wind with the envelope of a hypothetical low-mass object.
-
8.
High spatial and spectral resolution observations of gas lines are needed to further study and understand this enigmatic system.
Acknowledgements.
We wish to express our thanks to the following people who helped us during this project: Hermann Böhnhardt for sharing the ADONIS image of HD 155448 with us, Marc Audard and Linda Podio for very helpful discussions of the interpretation of the forbidden lines in HD 155448 C, and the anonymous referee for helpful suggestions. GM is partially supported by the Spanish Project AYA 2008-01727. AC acknowledges support from a Swiss National Science Foundation grant (PP002–110504). We thank the ESO observatory staff and telescope operators for support during the observations. This work made use of the SIMBAD astronomical database, operated at the CDS, Strasbourg, France.References
- (1) Acke, B., van den Ancker, M. E., & Dullemond, C. P. 2005, A&A, 436, 209
- (2) Acke, B., Bouwman, J., Juhász, A., et al. 2010, ApJ, 718, 558
- (3) Bagnulo, S., Jehin, E., Ledoux, C., et al. 2003, Messenger, 114, 10
- (4) Bauschlicher, C. W., Peeters, E., & Allamandola, L. J. 2008, ApJ, 678, 316
- (5) Bertone, E., Buzzoni, A., Chávez, M., & Rodríguez-Merino, L. H. 2008, A&A, 485, 823
- (6) Beuzit, J.-L., Demailly, L., Gendron, E., et al. 1997a, Experimental Astronomy, 7, 285
- (7) Beuzit, J.-L., Mouillet, D., Lagrange, A. M., & Paufique, J. 1997b, A&AS, 125, 175
- (8) Buzzoni, B., Delabre, B., Dekker, H., et al. 1984, Msngr, 38, 9
- (9) Carmona, A., van den Ancker, M. E., Audard, M., et al. 2010, A&A, 517, A67
- (10) Cohen, M. 1998, AJ, 115, 2092
- (11) Dommanget, J., & Nys, O. 1994, CoORB, 115, 1 (VizieR Online Data Catalog, I/211)
- (12) Dommanget, J., & Nys, O. 2002, Observations et Travaux 54, 5 (VizieR Online Data Catalog, I/274)
- (13) Flynn, C., & Freeman, K. C. 1993, A&AS, 97, 835
- (14) Ginestet, N., Carquillat, J. M., Jaschek, M., et al. 1992; “Atlas de spectres stellaires de standards de classification MK, binaires spectroscopiques, étoiles particuliéres” (Observatoire Midi-Pyrénées, Toulouse; Observatoire Astronomique, Strasbourg; CRDP, Toulouse)
- (15) Hamann, F. 1994, ApJS, 93, 485
- (16) Hamuy, M., Walker, A. R., Suntzeff, N. B., et al. 1992, PASP, 104, 533
- (17) Hamuy, M., Suntzeff, N. B., Heathcote, S. R., et al. 1994, PASP, 106, 566
- (18) Hartigan, P., Edwards, S., & Ghandour, L. 1995, ApJ, 452, 736
- (19) Hartmann, L., & Raymond, J. C. 1989, ApJ, 337, 903
- (20) Hony, S., Van Kerckhoven, C., Peeters, E., et al. 2001, A&A, 370, 1030
- (21) Houck, J. R., Roellig, T. L., van Cleve, J., et al. 2004, ApJ Supp., 154, 18
- (22) Houk, N. 1982, MSS, C03, 0
- (23) Juhász, A., Henning, Th., Bouwman, J., et al. 2009, ApJ, 695, 1024
- (24) Juhász, A., Bouwman, J., Henning, Th., et al. 2010, ApJ, 721, 431
- (25) Keller, L. D., Sloan, G. C., Forrest, W. J., et al. 2008, ApJ, 684, 411
- (26) Kurucz, R. L. 1994, “Solar abundance model atmospheres for 0, 1, 2, 4, 8 km/s”, CD-ROM No. 19. (Smithsonian Astrophysical Observatory, Cambridge, Mass.)
- (27) Lagage, P. O., Pel, J. W., Authier, M., et al. 2004, Msngr, 117, 12
- (28) Lahuis, F., & Boogert, A. 2003, in “Chemistry as a Diagnostic of Star Formation”, proceedings of a conference held August 21-23, 2002 at University of Waterloo, Ontario, Canada. Eds.: C. L. Curry & M. Fich (NRC Press, Ottawa, Canada), p. 335
- (29) Landolt, A. U. 1992, AJ, 104, 340
- (30) Lenzen, R., Hartung, M., Brandner, W., et al. 2003, SPIE, 4841, 944
- (31) Lovelace, R. V. E., Romanova, M. M., Ustyugova, G. V., Koldoba, A. V. 2010, MNRAS, 408, 2083
- (32) Malfait, K., Bogaert, E., & Waelkens, C. 1998, A&A, 331, 211
- (33) Meeus, G., Juhász, A., Henning, Th. et al. 2009, A&A 497, 379
- (34) Morgan, W. W., Keenan, P. C., & Kellman, E. 1943, “An atlas of stellar spectra, with an outline of spectral classification” (The University of Chicago press, Chicago)
- (35) Moorwood, A., Cuby, J. G., & Lidman, C. 1998, Msngr, 91, 9
- (36) Peeters, E., Hony, S., Van Kerckhoven, C., et al. 2002, A&A, 390, 1089
- (37) Perryman, M. A. C., Lindegren, L., Kovalevsky, J., et al. 1997, A&A, 323, L49
- (38) Porter, J. M., & Rivinius, T. 2003, PASP, 115, 1153
- (39) Roach, F. E. 1964, Space Science Reviews, Vol. 3, Issue 4, p. 512
- (40) Rousset, G., Lacombe, F., Puget, P., et al. 2003, SPIE, 4839, 140
- (41) Savage, B. D., & Mathis, J. S. 1979, ARA&A, 17, 73
- (42) Schmidt-Kaler, Th. 1982, in Landolt-Börnstein, Vol. 2 “Astronomy and Astrophysics”, Subvol. b “Stars and Star Clusters” (Springer-Verlag, Berlin)
- (43) Schütz, O., Meeus, G., Sterzik, M. F., & Peeters, E. 2009, A&A, 507, 261
- (44) Shepherd, D. 2005, IAUS, 227, 237
- (45) Siess, L., Dufour, E., & Forestini, M. 2000, A&A, 358, 593
- (46) Solf, J., & Boehm, K. H. 1993, ApJ, 410, L31
- (47) Soubiran, C., Katz, D., & Cayrel, R. 1998, A&AS, 133, 221 (VizieR Online Data Catalog, 413, 30221)
- (48) Te Lintel Hekkert, P., Caswell, J. L., Habing, H. J., et al. 1991, A&AS, 90, 327
- (49) van Boekel, R., Min, M., Waters, L. B. F. M., et al. 2005, A&A, 437, 189
- (50) Van der Veen, W. E. C. J., Habing, H. J., & Geballe, T. R. 1989, A&A, 226, 108
- (51) Vieira, S. L. A., Corradi, W. J. B., Alencar, S. H. P., et al. 2003, AJ, 126, 2971
Appendix A Details on the observations and data reduction
A.1 ADONIS NIR imaging
The ESO Adaptive Optics Near Infrared System (ADONIS; Beuzit et al. 1997a ) was available on the 3.6 m telescope at ESO La Silla until September 2002. Typical Strehl ratios were around 0.1 in band and 0.3 in band. ADONIS was coupled with the near-IR camera SHARPII+ which operates in the to band. Our data were acquired on June 8, 2000 in the and (short ) filter with total exposure times up to 600 seconds. We attached a fully opaque coronographic mask in front of the Lyot (pupil) stop to reject the peak of the PSF for the brightest source, to increase the integration time and sensitivity in order to reveal fainter structures. Details on the coronograph and its performance are given in Beuzit et al. (1997b ). For HD 155448, a mask of 1.4′′ and a lens scale with 0.1′′/pix were used. We co-added ten exposures of 60 seconds in both filters. The mask’s fixed position meant that no jitter offsets were possible. Data cube clean-up, dark and flatfield correction, as well as sky subtraction were performed in standard ways. Figure 1 shows an ADONIS band exposure. No PSF subtraction was applied in this case.
Despite the high sensitivity of the ADONIS data, no reliable photometry could be obtained. There were problems both with the calibrator stars and with the camera’s ADU conversion factor during this night, and weather conditions were not very stable.
A.2 EFOSC2 optical imaging & spectroscopy
A.2.1 Photometry
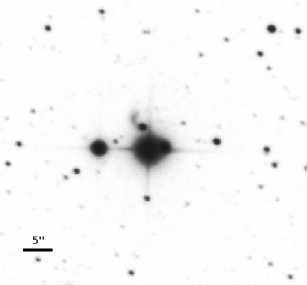
Broadband photometry in the , , and filters was obtained on February 26, 2006 with EFOSC2 (Buzzoni et al. Buzzoni (1984)) at the 3.6m telescope in La Silla. These imaging data have a binning of 1 (i.e. 0.157′′/pix). To better resolve the emission between the components, the data were re-sampled to 0.079′′/pix. Eight frames of 1 sec integration time were co-added for each filter. Despite the short exposures, the A component was saturated in the and filters. The B2 source is not resolved from B1 in the optical filters. Components A, B, and C have a flux error of 0.1 mag due to the problem in resolving their fluxes. The aperture photometry of source C does not include the arc-shaped emission region. Landolt standard fields (Landolt Landolt (1992)) for zero points were observed just prior to the science data. In addition, we used SExtractor to extract the photometry and colour determination of all 2000 sources in the EFOSC2 field (about 5.5′ 5.5′), in order to check whether more objects belong to the HD 155448 system. An band EFOSC2 image is shown in Fig. 2.
A.2.2 Spectroscopy
EFOSC2 spectra were obtained on March 1 and April 20, 2006, as well as on August 19, 2007 and August 12, 2008. The spectra obtained in 2006 were taken with grism 11 and a 1.0″ slit, covering 3380–7520 Å at a dispersion of 2.04 Å/pix and a mean resolution 400. Slit orientations were applied as shown in Fig. 1, to avoid a contamination by the neighbouring components as much as possible and to resolve the C source and the arc individually. In 2007, we re-observed the C component with a 1.0″ slit and EFOSC2 grisms 5 (5200–9350 Å, 2.06 Å/pix, 300) and 18 (4700–6770 Å, 1.0 Å/pix, 600), to obtain higher resolution and a redder spectral coverage. The slit orientation during the 2007 campaign was east-west, to cover only the C component (“Slit C only” in Fig. 1). When the high-resolution holographic grisms 19 (4441–5114 Å, 0.34 Å/pix, 3000) and 20 (6047–7147 Å, 0.55 Å/pix, 2500) became available, we observed the system again with a 0.5″ slit in orientations as shown in Fig. 1 and Table 2. Spectrophotometric standard stars were taken from the list of Hamuy (Hamuy92 (1992), Hamuy94 (1994)) and observed with a wider 5.0″ slit. Bias and flats were taken in a standard way. The wavelength calibration was done by correlating to a HeAr lamp spectrum. The calibrated final spectra were averaged for consecutive exposures in each setting and the continuum normalised.
Further data processing was performed for the 3000 spectra. The 3 error in the wavelength calibration obtained is 4 km/s ( = 1.2 km/s). To produce the position velocity diagrams discussed in Sect. 2.3, the two-dimensional wavelength calibrated spectra were corrected for the curvature induced by the instrument along the spatial direction and the trace in the PSF along the dispersion direction. The curvature along the spatial direction was determined by fitting a second degree polynomial to the centre position (determined by a Gaussian fit) of the bright sky [O i] emission line near 6300 Å along the spatial axis. Then the spectra at each spatial position was shifted such that the centre of the sky [O i] emission is always at the same pixel. The reference pixel was the pixel in which the [O i] sky line crosses the peak of the star’s continuum. The PSF trace was determined by fitting Gaussians to the PSF at several positions in the continuum and then fitting a second degree polynomial to the PSF centre positions. The spectra then were shifted such that the centre of the PSF is always located at the same pixel. The reference pixel is the median of the PSF centre positions.
A.3 SOFI NIR imaging
We acquired broadband images with SOFI (Moorwood et al. Moorwood (1998)) at the La Silla NTT during May 7, 2004. SOFI’s small field scale with 0.144′′/pix was used. For each filter, ten exposures with random jitter box width of 20″ were coadded. The total integration time in each passband amounts to 100 sec. Darks and dome flats were taken in a standard way. Unfortunately, it was not possible to get separate photometry for the B1 and B2 components, owing to the low spatial resolution. The photometry of the C component is derived without the arc, placing the aperture – as closely as possible – only around the star. The derived magnitudes of source C might be slightly fainter than they really are, since with circular apertures it cannot be avoided that the very closely located arc contributes partly to the 2 pixel thin sky annulus, thus resulting in a higher value for the sky. This uncertainty is considered in the corresponding magnitude errors. Zero points (ZPs) were derived from NICMOS photometric standard stars, which were observed two hours after HD 155448. We estimate a final photometric accuracy of 0.1 mag, as we do not accurately know the quality of sky transparency during these observations that were obtained from the ESO science archive. The estimate of 0.1 mag is derived from the maximal difference in our ZPs to those of a photometric SOFI night.
A.4 NACO NIR imaging
Additional adaptive optics data were obtained with NAOS-CONICA (NACO; Lenzen et al. Lenzen (2003), Rousset et al. Rousset (2003)) at the Paranal Observatory in service mode during ESO period 75 (i.e. between April and September 2005). We acquired images in narrow band filters (NB) at the central wavelengths 1.64 m, 2.12 m, 3.74 m, and 4.05 m, with a spatial resolution of 0.027′′/pix and total integration times up to 435 sec. Dark, flatfield, and sky correction were made in the standard way. Ten individual exposures for each filter, with a jitter box width of 10″, were shifted and co-added.
We think that some problems must have occurred during these observations, because we observed strong flux losses when comparing the derived photometry to the expected values, as could already be recognised from the raw data. We immediately see that the exposures are not very sensitive, so that even the arc northeast of the C component is not seen in any of the NACO images. Nevertheless, we could derive useful relative photometry and astrometry for the narrow band filters NB_1.64 and NB_2.12. Unfortunately, no standard star was observed for this service mode programme. Therefore, we first derived relative photometry and then scaled it to the 2MASS and band flux of the D component, since this component likely has the most accurate 2MASS flux, which is recognisable from the flags in the 2MASS catalogues, while its larger distance to the neighbouring stars will avoid contamination. The resulting NACO photometry matches that of SOFI within the error ranges.
A.5 VISIR MIR imaging & spectroscopy
A.5.1 Photometry
We observed the HD 155448 system between 8 and 19 m with the mid-IR instrument VISIR (Lagage et al. Lagage (2004)) at Paranal in service mode in period 75. In the band, dual imaging around the wavelength of PAH emission was performed with the VISIR filters PAH2 (11.25 m), and PAH2_ref2 (11.88 m) as the nearest continuum reference. The band exposures were taken with the filter (18.72 m), which – for VISIR – has the best band sensitivity. The spatial resolution at both wavelengths is 0.075′′/pix in the VISIR small field. All mid-IR exposures were performed with a standard chopping and nodding technique with a throw of 10′′. Mid-IR standard stars for flux calibration were selected by the observatory staff from a list of mid-IR standard stars by Cohen (Cohen (1998)), and were observed close in time and airmass to the science observations.
Data cube chop and nod co-addition was done in the standard ways. Where necessary, we corrected for known artifacts (in the form of stripes) of the VISIR detector. The co-added exposure time for each PAH observation amounts to 1085 sec. For the final image, we selected the five best out of six observations, spread over several months, resulting in 5425 sec (1.5 hours) total integration. The resulting PAH on/off images have the same exposure time and . Both images were re-centred with an accuracy of 0.1 pix before subtraction. In the band, each co-added observation sums to 1987 sec. For the final image, the four best observations (out of five) were selected, resulting in a total exposure time of 7948 sec (2.2 hours).
The photometric accuracy is limited by the following uncertainties: (1) uncertainty in the aperture, which is negligible in our case with errors smaller than 5 mJy, (2) uncertainty in background subtraction: by co-addition of many exposures this influence got also strongly suppressed, and (3) uncertainty in the flux calibration. The latter may be significant, because the atmospheric transmission often varied in the short time between observation of the science target and the consecutively observed standard star. Since several calibrated images are co-added, this effect may be neutralised, but nevertheless we estimate the photometric accuracy to be only within 10%.
A.5.2 Spectroscopy
Low-resolution band spectra (350 at 10 m) were obtained between 8 and 13 m with a 1.0′′ slit. We aimed at having both the signal of the star and its arc-shaped circumstellar matter in the slit, so we rotated the slit to an orientation of 50∘ position angle (cf. Figs. 3 and 8). Our three VISIR spectral settings, centred at 8.8 m, 11.4 m, and 12.4 m, cover approximately the wavelength ranges 8.0–9.4 m and 10.4–13.1 m, after removing the outer range of each setting.
The spectroscopic frames were debiased and checked for a correct alignment of the spectrum with the x-axis of the frame. Two peaks are distinguishable in the spectral profile: the position of the star and that of the circumstellar arc. We extracted the signal separately for both regions, with ”a neutral zone” left in between, and coadded the signal of corresponding nod positions. In addition, data from various observations between June and September 2005 were averaged. An initial ad-hoc wavelength calibration, derived from the central wavelength of each spectral setting and the spectral resolution per pixel, was refined by cross-correlating with atmospheric lines. The final error in wavelength accuracy is .
Mid-IR standard stars for telluric correction were selected by the observatory staff and executed immediately before or after the science data. Flux was calibrated in the standard way by dividing the target through the calibrator spectrum and multiplying the result with a profile of the standard star taken from Cohen (Cohen (1998)). Due to the varying atmospheric transparency in the time between observation of the science target and the standard star (typically less than 1 hour), the flux calibration is not accurate so we need to cross-correlate the spectral flux to our aperture photometry. Moreover, we have wavelength dependent slit losses: while we covered the entire stellar neighbourhood (silicate-dominated), the emission of the outer part of the circumstellar arc (PAH-dominated) was not included in the 1.0″ slit. Therefore, we scaled the 11.4 m silicate spectrum of the stellar vicinity to the aperture photometry of 0.44 Jy at 11.88 m (cf. Table LABEL:table:single-flux-2), motivated by the dominance of this spectrum by silicates. Similarly, we scaled the 11.4 m spectrum of the PAH-dominated circumstellar arc to the photometry for the arc of 0.41 Jy at 11.25 m, which was obtained as the difference of the total flux and the flux in the vicinity of the star (cf. Table LABEL:table:single-flux-2). We corrected most of the slit losses in the PAH emitting wing by this approach. Finally, the 12.4 m settings, which overlap with the 11.4 m ones, were scaled to match the flux of the latter. We note that this flux calibration is not a unique solution, but the best effort possible for this data. We estimate a possible deviation from the actual flux within 10%. More difficult is the adjustment of the 8.8 m settings, which do not overlap with the more longward settings and for which we do not have aperture photometry at shorter wavelengths. In the absence of other calibration options, the 8.8 m settings are adjusted to match the longward spectra. The approximate error in flux calibration for the 8.8 m silicate spectrum is another 10%, while the absolute intensity of the 8.6 m PAH band remains uncertain.
A.6 Spitzer MIR spectroscopy
HD 155448 was observed with the infrared spectrograph (IRS, Houck et al. Houck (2004)) onboard the Spitzer Space Telescope on March 22, 2005 (PID: 3470, PI: Jeroen Bouwman). The source was measured using Short Low (5.2–14.5 m), Short High (9.9–19.5 m), and Long High (18.7–37.2 m) modules. The integration time was 30 seconds for the Short High module and six seconds for the other modules, respectively, and at least two cycles were used for redundancy. A high-accuracy PCRS peak-up was used to acquire the target in the spectrograph slit. The spectra are based on the droopres and rsc products, processed through the S18.7.0 version of the Spitzer data pipeline for the low- and high-resolution modules, respectively. For the details of the data reduction procedure we refer to Juhász et al. (Juhasz2010 (2010)) and Acke et al. (Acke2010 (2010)). The brief description of the data reduction steps is as follows. For the Short Low spectrum the associated pairs of imaged spectra were subtracted in order to correct for the background emission, stray-light contamination and anomalous dark currents. For the high-resolution spectra the background has been removed by fitting a local continuum underneath the source profile. Pixels flagged by the data pipeline as being “bad” were replaced with a value interpolated from an 8-pixel perimeter surrounding the flagged pixel. In the case of the Short Low module, the spectra were extracted using a 6.0-pixel fixed-width aperture in the spatial dimension. For the high-resolution modules, spectral extraction was done by fitting the source profile with the known PSF in the spectral images. Low-level fringing at wavelengths 20 m was removed using the irsfringe package (Lahuis & Boogert Lahuis (2003)). The spectra were calibrated using a spectral response function derived from IRS spectra and MARCS stellar models for a suite of calibrators provided by the Spitzer Science Centre. To remove any effect of pointing offsets, we matched orders based on the point spread function of the IRS instrument, correcting for possible flux losses.