Search for the disappearance of muon antineutrinos in
the NuMI neutrino beam
P. Adamson
Fermi National Accelerator Laboratory, Batavia, Illinois 60510, USA
D. J. Auty
Department of Physics and Astronomy, University of Sussex, Falmer, Brighton BN1 9QH, United Kingdom
D. S. Ayres
Argonne National Laboratory, Argonne, Illinois 60439, USA
C. Backhouse
Subdepartment of Particle Physics, University of Oxford, Oxford OX1 3RH, United Kingdom
G. Barr
Subdepartment of Particle Physics, University of Oxford, Oxford OX1 3RH, United Kingdom
M. Bishai
Brookhaven National Laboratory, Upton, New York 11973, USA
A. Blake
Cavendish Laboratory, University of Cambridge, Madingley Road, Cambridge CB3 0HE, United Kingdom
G. J. Bock
Fermi National Accelerator Laboratory, Batavia, Illinois 60510, USA
D. J. Boehnlein
Fermi National Accelerator Laboratory, Batavia, Illinois 60510, USA
D. Bogert
Fermi National Accelerator Laboratory, Batavia, Illinois 60510, USA
S. V. Cao
Department of Physics, University of Texas at Austin, 1 University Station C1600, Austin, Texas 78712, USA
S. Cavanaugh
Department of Physics, Harvard University, Cambridge, Massachusetts 02138, USA
D. Cherdack
Physics Department, Tufts University, Medford, Massachusetts 02155, USA
S. Childress
Fermi National Accelerator Laboratory, Batavia, Illinois 60510, USA
B. C. Choudhary
Fermi National Accelerator Laboratory, Batavia, Illinois 60510, USA
J. A. B. Coelho
Universidade Estadual de Campinas, IFGW-UNICAMP, CP 6165, 13083-970, Campinas, SP, Brazil
S. J. Coleman
Department of Physics, College of William & Mary, Williamsburg, Virginia 23187, USA
L. Corwin
Indiana University, Bloomington, Indiana 47405, USA
D. Cronin-Hennessy
University of Minnesota, Minneapolis, Minnesota 55455, USA
I. Z. Danko
Department of Physics and Astronomy, University of Pittsburgh, Pittsburgh, Pennsylvania 15260, USA
J. K. de Jong
Subdepartment of Particle Physics, University of Oxford, Oxford OX1 3RH, United Kingdom
N. E. Devenish
Department of Physics and Astronomy, University of Sussex, Falmer, Brighton BN1 9QH, United Kingdom
M. V. Diwan
Brookhaven National Laboratory, Upton, New York 11973, USA
M. Dorman
Department of Physics and Astronomy, University College London, Gower Street, London WC1E 6BT, United Kingdom
C. O. Escobar
Universidade Estadual de Campinas, IFGW-UNICAMP, CP 6165, 13083-970, Campinas, SP, Brazil
J. J. Evans
Department of Physics and Astronomy, University College London, Gower Street, London WC1E 6BT, United Kingdom
E. Falk
Department of Physics and Astronomy, University of Sussex, Falmer, Brighton BN1 9QH, United Kingdom
G. J. Feldman
Department of Physics, Harvard University, Cambridge, Massachusetts 02138, USA
M. V. Frohne
Holy Cross College, Notre Dame, Indiana 46556, USA
H. R. Gallagher
Physics Department, Tufts University, Medford, Massachusetts 02155, USA
R. A. Gomes
Instituto de Física, Universidade Federal de Goiás, CP 131, 74001-970, Goiânia, GO, Brazil
M. C. Goodman
Argonne National Laboratory, Argonne, Illinois 60439, USA
P. Gouffon
Instituto de Física, Universidade de São Paulo, CP 66318, 05315-970, São Paulo, SP, Brazil
N. Graf
Department of Physics, Illinois Institute of Technology, Chicago, Illinois 60616, USA
R. Gran
Department of Physics, University of Minnesota – Duluth, Duluth, Minnesota 55812, USA
N. Grant
Rutherford Appleton Laboratory, Science and Technologies Facilities Council, OX11 0QX, United Kingdom
K. Grzelak
Department of Physics, University of Warsaw, Hoża 69, PL-00-681 Warsaw, Poland
A. Habig
Department of Physics, University of Minnesota – Duluth, Duluth, Minnesota 55812, USA
J. Hartnell
Department of Physics and Astronomy, University of Sussex, Falmer, Brighton BN1 9QH, United Kingdom
Rutherford Appleton Laboratory, Science and Technologies Facilities Council, OX11 0QX, United Kingdom
R. Hatcher
Fermi National Accelerator Laboratory, Batavia, Illinois 60510, USA
A. Himmel
Lauritsen Laboratory, California Institute of Technology, Pasadena, California 91125, USA
A. Holin
Department of Physics and Astronomy, University College London, Gower Street, London WC1E 6BT, United Kingdom
C. Howcroft
Lauritsen Laboratory, California Institute of Technology, Pasadena, California 91125, USA
X. Huang
Argonne National Laboratory, Argonne, Illinois 60439, USA
J. Hylen
Fermi National Accelerator Laboratory, Batavia, Illinois 60510, USA
G. M. Irwin
Department of Physics, Stanford University, Stanford, California 94305, USA
Z. Isvan
Department of Physics and Astronomy, University of Pittsburgh, Pittsburgh, Pennsylvania 15260, USA
D. E. Jaffe
Brookhaven National Laboratory, Upton, New York 11973, USA
C. James
Fermi National Accelerator Laboratory, Batavia, Illinois 60510, USA
D. Jensen
Fermi National Accelerator Laboratory, Batavia, Illinois 60510, USA
T. Kafka
Physics Department, Tufts University, Medford, Massachusetts 02155, USA
S. M. S. Kasahara
University of Minnesota, Minneapolis, Minnesota 55455, USA
G. Koizumi
Fermi National Accelerator Laboratory, Batavia, Illinois 60510, USA
S. Kopp
Department of Physics, University of Texas at Austin, 1 University Station C1600, Austin, Texas 78712, USA
M. Kordosky
Department of Physics, College of William & Mary, Williamsburg, Virginia 23187, USA
A. Kreymer
Fermi National Accelerator Laboratory, Batavia, Illinois 60510, USA
K. Lang
Department of Physics, University of Texas at Austin, 1 University Station C1600, Austin, Texas 78712, USA
G. Lefeuvre
Department of Physics and Astronomy, University of Sussex, Falmer, Brighton BN1 9QH, United Kingdom
J. Ling
Brookhaven National Laboratory, Upton, New York 11973, USA
Department of Physics and Astronomy, University of South Carolina, Columbia, South Carolina 29208, USA
P. J. Litchfield
University of Minnesota, Minneapolis, Minnesota 55455, USA
Rutherford Appleton Laboratory, Science and Technologies Facilities Council, OX11 0QX, United Kingdom
L. Loiacono
Department of Physics, University of Texas at Austin, 1 University Station C1600, Austin, Texas 78712, USA
P. Lucas
Fermi National Accelerator Laboratory, Batavia, Illinois 60510, USA
W. A. Mann
Physics Department, Tufts University, Medford, Massachusetts 02155, USA
M. L. Marshak
University of Minnesota, Minneapolis, Minnesota 55455, USA
M. Mathis
Department of Physics, College of William & Mary, Williamsburg, Virginia 23187, USA
N. Mayer
Indiana University, Bloomington, Indiana 47405, USA
R. Mehdiyev
Department of Physics, University of Texas at Austin, 1 University Station C1600, Austin, Texas 78712, USA
J. R. Meier
University of Minnesota, Minneapolis, Minnesota 55455, USA
M. D. Messier
Indiana University, Bloomington, Indiana 47405, USA
D. G. Michael
Deceased.
Lauritsen Laboratory, California Institute of Technology, Pasadena, California 91125, USA
W. H. Miller
University of Minnesota, Minneapolis, Minnesota 55455, USA
S. R. Mishra
Department of Physics and Astronomy, University of South Carolina, Columbia, South Carolina 29208, USA
J. Mitchell
Cavendish Laboratory, University of Cambridge, Madingley Road, Cambridge CB3 0HE, United Kingdom
C. D. Moore
Fermi National Accelerator Laboratory, Batavia, Illinois 60510, USA
L. Mualem
Lauritsen Laboratory, California Institute of Technology, Pasadena, California 91125, USA
S. Mufson
Indiana University, Bloomington, Indiana 47405, USA
J. Musser
Indiana University, Bloomington, Indiana 47405, USA
D. Naples
Department of Physics and Astronomy, University of Pittsburgh, Pittsburgh, Pennsylvania 15260, USA
J. K. Nelson
Department of Physics, College of William & Mary, Williamsburg, Virginia 23187, USA
H. B. Newman
Lauritsen Laboratory, California Institute of Technology, Pasadena, California 91125, USA
R. J. Nichol
Department of Physics and Astronomy, University College London, Gower Street, London WC1E 6BT, United Kingdom
J. A. Nowak
University of Minnesota, Minneapolis, Minnesota 55455, USA
J. P. Ochoa-Ricoux
Lauritsen Laboratory, California Institute of Technology, Pasadena, California 91125, USA
W. P. Oliver
Physics Department, Tufts University, Medford, Massachusetts 02155, USA
M. Orchanian
Lauritsen Laboratory, California Institute of Technology, Pasadena, California 91125, USA
R. Pahlka
Fermi National Accelerator Laboratory, Batavia, Illinois 60510, USA
J. Paley
Argonne National Laboratory, Argonne, Illinois 60439, USA
Indiana University, Bloomington, Indiana 47405, USA
R. B. Patterson
Lauritsen Laboratory, California Institute of Technology, Pasadena, California 91125, USA
G. Pawloski
Department of Physics, Stanford University, Stanford, California 94305, USA
G. F. Pearce
Rutherford Appleton Laboratory, Science and Technologies Facilities Council, OX11 0QX, United Kingdom
S. Phan-Budd
Argonne National Laboratory, Argonne, Illinois 60439, USA
R. K. Plunkett
Fermi National Accelerator Laboratory, Batavia, Illinois 60510, USA
X. Qiu
Department of Physics, Stanford University, Stanford, California 94305, USA
J. Ratchford
Department of Physics, University of Texas at Austin, 1 University Station C1600, Austin, Texas 78712, USA
B. Rebel
Fermi National Accelerator Laboratory, Batavia, Illinois 60510, USA
C. Rosenfeld
Department of Physics and Astronomy, University of South Carolina, Columbia, South Carolina 29208, USA
H. A. Rubin
Department of Physics, Illinois Institute of Technology, Chicago, Illinois 60616, USA
M. C. Sanchez
Department of Physics and Astronomy, Iowa State University, Ames, Iowa 50011 USA
Argonne National Laboratory, Argonne, Illinois 60439, USA
Department of Physics, Harvard University, Cambridge, Massachusetts 02138, USA
J. Schneps
Physics Department, Tufts University, Medford, Massachusetts 02155, USA
A. Schreckenberger
University of Minnesota, Minneapolis, Minnesota 55455, USA
P. Schreiner
Argonne National Laboratory, Argonne, Illinois 60439, USA
R. Sharma
Fermi National Accelerator Laboratory, Batavia, Illinois 60510, USA
A. Sousa
Department of Physics, Harvard University, Cambridge, Massachusetts 02138, USA
M. Strait
University of Minnesota, Minneapolis, Minnesota 55455, USA
N. Tagg
Otterbein College, Westerville, Ohio 43081, USA
R. L. Talaga
Argonne National Laboratory, Argonne, Illinois 60439, USA
M. A. Tavera
Department of Physics and Astronomy, University of Sussex, Falmer, Brighton BN1 9QH, United Kingdom
J. Thomas
Department of Physics and Astronomy, University College London, Gower Street, London WC1E 6BT, United Kingdom
M. A. Thomson
Cavendish Laboratory, University of Cambridge, Madingley Road, Cambridge CB3 0HE, United Kingdom
G. Tinti
Subdepartment of Particle Physics, University of Oxford, Oxford OX1 3RH, United Kingdom
R. Toner
Cavendish Laboratory, University of Cambridge, Madingley Road, Cambridge CB3 0HE, United Kingdom
D. Torretta
Fermi National Accelerator Laboratory, Batavia, Illinois 60510, USA
G. Tzanakos
Department of Physics, University of Athens, GR-15771 Athens, Greece
J. Urheim
Indiana University, Bloomington, Indiana 47405, USA
P. Vahle
Department of Physics, College of William & Mary, Williamsburg, Virginia 23187, USA
B. Viren
Brookhaven National Laboratory, Upton, New York 11973, USA
J. J. Walding
Department of Physics, College of William & Mary, Williamsburg, Virginia 23187, USA
A. Weber
Subdepartment of Particle Physics, University of Oxford, Oxford OX1 3RH, United Kingdom
Rutherford Appleton Laboratory, Science and Technologies Facilities Council, OX11 0QX, United Kingdom
R. C. Webb
Physics Department, Texas A&M University, College Station, Texas 77843, USA
C. White
Department of Physics, Illinois Institute of Technology, Chicago, Illinois 60616, USA
L. Whitehead
Brookhaven National Laboratory, Upton, New York 11973, USA
S. G. Wojcicki
Department of Physics, Stanford University, Stanford, California 94305, USA
T. Yang
Department of Physics, Stanford University, Stanford, California 94305, USA
R. Zwaska
Fermi National Accelerator Laboratory, Batavia, Illinois 60510, USA
Abstract
We report constraints on antineutrino oscillation parameters that were
obtained by using the two MINOS detectors to measure the muon
antineutrino component of the NuMI neutrino beam. In the Far Detector,
we select events in the charged-current muon
antineutrino sample, compared to a prediction of events under the assumption ,
. Assuming no oscillations occur at the Near Detector
baseline, a fit to the two-flavor oscillation approximation constrains
at the 90% confidence level with
.
The phenomenon of neutrino oscillations has been well established by
experimental
observations ref:minos2006 ; ref:sk ; ref:borexino ; ref:soudan2 ; ref:macro ; ref:k2k ; ref:sno ; ref:kamland . The
underlying quantum-mechanical mixing between the neutrino flavor and
mass eigenstates is governed by the elements of the PMNS
matrix ref:pmns , usually parameterized by three mixing angles
and a CP-violating phase. Oscillations are governed by the ratio of
the distance traveled by the neutrino to its energy () and the
two independent neutrino mass-squared differences. CPT symmetry
constrains the allowed differences between a particle and its
antiparticle ref:weinberg and requires their masses to be
identical. Differences between the measured neutrino and antineutrino
oscillation parameters would indicate new physics. For example, as
neutrinos propagate through matter, nonstandard
interactions ref:NSI could alter the disappearance
probabilities of neutrinos relative to antineutrinos and thus the
inferred oscillation parameters ref:minosNSIfits . Such models
of new physics predict a different energy dependence and so probing
the standard oscillation hypothesis to greater precision across a wide
range of energies is valuable.
The MINOS long-baseline experiment has made the most precise
measurements to date of the larger (atmospheric) mass-squared
splitting for both neutrinos ref:minosCC2010 and
antineutrinos ref:rhc . With the NuMI facility ref:NuMI
configured to provide a neutrino-dominated beam, a measurement of
disappearance resulted in a mass-squared splitting of
eV2 and mixing angle
(90% confidence limit
[C.L.]) ref:minosCC2010 ; comment:dmbar . From direct
observations of disappearance, using a smaller exposure
to the beam optimized for antineutrinos, MINOS measures the
antineutrino oscillation parameters
and
ref:rhc . Prior
to the measurement of by MINOS the strongest
constraints on antineutrino oscillation parameters came from a
fit ref:maltoni to global data dominated by
Super-Kamiokande results where the sum of atmospheric and
interaction rates was measured.
This paper describes an analysis of the 7% component of
the NuMI beam, optimized to produce neutrinos, with an exposure of
protons on target. The MINOS detectors are magnetized,
allowing event-by-event separation of and charged-current (CC) events using the curvature of the muon track.
The sample presented here provides a new test of the
oscillation hypothesis for muon antineutrinos at the atmospheric
scale. With substantially increased statistics in the 5–15 GeV energy
range relative to the sample obtained with the beam configured for
antineutrinos ref:rhc the oscillation probability can
be probed to greater precision in this region.
The NuMI beam uses 120 GeV/c protons incident on a graphite target to
produce secondary hadrons, in particular pions and kaons of both
charges. Depending on the sign of the applied current, two magnetic
horns focus either positively or negatively charged hadrons for a
neutrino or antineutrino beam, respectively. A 675 m long iron-walled
decay pipe — evacuated during the first half of the data taking
period but later filled with 0.9 atm helium for structural reasons —
allows the hadrons and tertiary muons to decay in flight, producing
neutrinos and antineutrinos. The antineutrino component of the
neutrino beam arises from four main sources: decays of hadrons
traveling along the axes of the horns where the focusing field is
negligible; partially defocused hadrons decaying close to the horns;
decays of hadrons produced from interactions with the helium and walls
of the decay pipe; and decays of tertiary muons that arise mainly from
decays of the focused hadrons. Muon antineutrinos from neutral kaons
are estimated from simulation to comprise 0.6% of events across the
spectrum. The combined energy spectrum of the CC events
arising from these sources is broadly distributed and peaks at
approximately 8 GeV, whereas the energy spectrum resulting from the
focused hadrons is narrowly-peaked at approximately 3 GeV.
The two MINOS detectors ref:NIM are located
1.04 km [Near Detector (ND)] and 735 km
[Far Detector (FD)] from the target. Both detectors are segmented
steel/scintillator tracking calorimeters. The detector fiducial
masses are 23.7 tons and 4.2 kilotons at the ND and FD
respectively. In CC interactions,
, a hadronic
shower () and a muon track may be observed. The reconstructed
neutrino energy is the sum of the reconstructed muon and hadron
energies. Hadronic energy is measured by calorimetry. Muon energy
is measured by range for contained tracks or by curvature in a
1.4 T toroidal magnetic field for exiting tracks. For
this data set, the fields in both detectors have been set so that
they focus and defocus , allowing the separation
of and CC interactions.
The inclusive CC interaction rate as a function of
reconstructed energy is measured in each detector. The
measured FD spectrum is compared to the projection of the ND data to
the FD, taking into account the different geometric acceptances of the
two detectors. In this comparison, many sources of systematic
uncertainty largely cancel due to the similarities of the two
detectors. Antineutrino oscillations would cause an energy-dependent
deficit at the FD compared to the projection from the ND; the
survival probability in the two-flavor approximation is
(1)
where [km] is the distance from the point of antineutrino
production, [GeV] the antineutrino energy, the
antineutrino mixing angle, and [] the
antineutrino mass-squared difference.
Selected events must contain at least one reconstructed track; the
longest track is identified as the muon candidate. This muon candidate
must originate inside the fiducial volume and have a positive charge
determined from track curvature. However, the track finding algorithm
can occasionally form a track out of hadronic activity, or misidentify
the curvature of a muon track. A simple charge-sign selection based on
this track-fit information yields a sample that is highly contaminated
with both CC and neutral current (NC) events as shown in
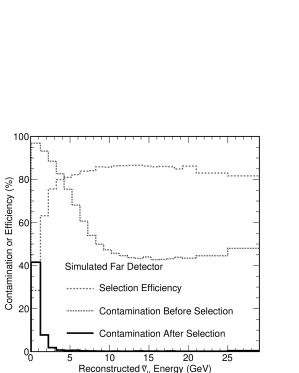
Fig. 1. Monte Carlo studies show that about
half of NC events with a reconstructed track and 7% of CC
events with a track are misidentified as candidates. Most of
the misidentified CC events are high-inelasticity interactions
in which the soft is obscured by the hadronic shower. In
addition, higher momentum muons follow a less curved trajectory,
increasing the probability of charge misidentification. With the beam
consisting of about 92% muon neutrinos, the initial signal to
background ratio is inherently much lower for muon antineutrinos than
it is for neutrinos and the development of further selection cuts was
necessary.
Figure 1: Efficiency of the selection of CC candidate
events reconstructed with a positive charge-sign track in the Far
Detector. The contamination due to misidentified NC and CC
interactions is also shown (assuming no oscillations), both before
and after all other selection criteria are applied.
To reduce the misidentified NC and CC background events, three
selection variables are used. The first is a likelihood-based
separation parameter based on event topology. The second variable is a
measure of the confidence of charge-sign determination from the track
fitting. The third variable provides an additional measure
of the direction of curvature of the muon track by comparing the local
track direction at the vertex to that at the end point of the
track ref:RustemThesis . The likelihood-based separation
parameter was originally developed to distinguish NC background from
CC events in the MINOS analysis of
oscillations ref:minos2006 but it is also effective in removing
the misidentified high-inelasticity CC background. This
discriminator uses probability density functions constructed from
three variables: the event length, the fraction of the total event
signal in the reconstructed track, and the average signal per plane of
the reconstructed track. These quantities are related to the muon
range, the event inelasticity and the average energy loss
of the muon track and are distributed
differently for CC events compared to NC and misidentified
CC events.
The selection was optimized ref:DavidThesis for statistical
sensitivity to oscillation parameters equal to those measured for
ref:minos2008 . Figure 1 shows the
efficiency of the full selection and the remaining contamination as a
function of energy in the FD. Assuming no oscillations, the
efficiency of the selection is 85% and the purity of the CC
sample is 98%, integrated over all energies in the FD.
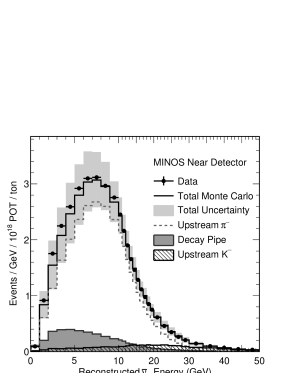
Figure 2: Reconstructed energy spectra of CC candidate events
at the Near Detector. The solid line shows the Monte Carlo
simulation, which is broken into three sources of parent
particles. The upstream pion decay contribution originates primarily
from the target but also includes antineutrinos from muons whose
parents decayed in the upstream region. The decay pipe component
corresponds to all parents (other than muons, which
contribute about 3% of the ND spectrum) produced 45 m or more
downstream of the target. The contribution from kaon decay is shown
by the hatched histogram. The shaded band on the simulation shows
the size of the systematic error on the absolute ND spectrum
prediction.
The measured ND energy spectrum, shown in Fig. 2, is used
to predict the FD spectrum, as in previous MINOS
analyses ref:minos2006 ; ref:minos2008 ; ref:minosCC2010 ; ref:JustinThesis . This effectively mitigates sources of
mismodeling, such as uncertainties in the neutrino flux or neutrino
cross sections, which affect both detectors in similar ways.
Hadron production in the NuMI target and beam line is simulated with
FLUKA ref:fluka by using FLUGGref:flugg as an interface to the GEANT4ref:G4 based geometry. Additionally, hadron
production in the target is constrained by a fit to ND
spectra ref:minos2006 , which correct the and
distributions as a function of their transverse and longitudinal
momenta at production, and respectively. The fit is performed
simultaneously for several different beam configurations, which
permits the constraint of a wide range of - space for parent particles. The ratio measured by
NA49 ref:NA49 , together with the spectral shape from the
fit, constrains the parent spectral shape, while a
fit to the ND energy spectrum provides overall normalization
and shape information. These fit parameters have been applied to
the flux in obtaining the simulated ND spectrum shown in
Fig. 2. The errors obtained in the fit provide an
estimate of the uncertainty on the hadron production from the target;
the corresponding error on the FD event rate, extrapolated from ND
data, is less than 1% for the beam component that arises directly
from hadrons produced in the target.
Figure 2 shows the contribution of different beam flux
components to the CC interaction rate in the ND as a function
of energy. A significant fraction of ND events originate from parent
particles produced in the decay pipe, predominantly from interactions
of primary and secondary hadrons with the decay pipe walls and the
helium (muons are not included in our decay pipe component definition
as they are constrained by the ND CC events). For these events
the relative acceptance of the ND compared to the FD is larger than
for particles produced in upstream interactions. Consequently, the
contribution from decay pipe parent particles as a fraction of the
total spectrum is larger at the ND (12%) compared to the FD (7%,
assuming no oscillations). A systematic uncertainty on the size of the
decay pipe component was assessed by scaling this component in the
Monte Carlo simulation and comparing with the ND data. Conservative
scale factors of 100% are applied to the decay pipe component,
introducing an uncertainty on the total CC interaction rate
predicted at the FD of .
Further systematic uncertainties include a 4% relative normalization
uncertainty between the ND and FD to account for uncertainties in the
reconstruction efficiencies, exposure and fiducial masses of both
detectors ref:minos2008 . A comparison of momentum measurement
from curvature vs. range in stopping muon tracks constrains the
uncertainty in track momentum determination from curvature to be
. The 50% uncertainty on the misidentified NC and CC
events was estimated by scaling those components in the ND until the
MC matched the data for the set of events that narrowly failed the
selection on the likelihood-based separation parameter. The total
systematic uncertainty on the predicted number of events at the FD is
82% of the total statistical uncertainty, assuming oscillation
parameters equal to those measured for ref:minosCC2010 .
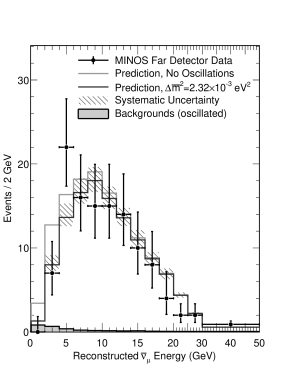
At the FD a total of selected CC candidate
events are observed. Figure 3 shows the energy spectrum
of the FD data overlaid with two predicted spectra obtained from the
ND data: one without oscillations and one with oscillation parameters
of ,
ref:minosCC2010 . The predicted backgrounds
are 1.8 CC events, 1.2 NC events and 0.2 CC events (in
the oscillated case). The integrated number of events observed and
expected are detailed in Table 1. The number of FD events
measured in run periods \@slowromancapi@ and \@slowromancapii@ is smaller than the
prediction. In run period \@slowromancapiii@, which differs due to the helium
in the decay pipe, a larger number of events are measured compared
with the prediction. The probability of observing a comparable or
larger difference in event rate between the two periods, evaluated
using mock Monte Carlo experiments, is 8.4%.
Run
POT
Events
Events
Events
period
()
observed
expected
expected
(oscillated)
(no osc.)
\@slowromancapi@ & \@slowromancapii@
3.21
43
\@slowromancapiii@
3.88
87
Total
7.09
Table 1: Candidate CC events observed and expected in the Far
Detector, broken down into two periods of approximately equal
exposure. The expected number of events in the oscillated case uses
the parameters measured with the CC
sample ref:minosCC2010 .
Figure 3: Energy spectra of CC candidate events observed in
the Far Detector. The predicted spectrum with no oscillations and
with oscillation parameter values of
,
are overlaid. The hatched band indicates
the total systematic uncertainty on the prediction. The estimated
background includes oscillations at the best-fit values determined
by the MINOS CC disappearance analysis ref:minosCC2010
for the CC events.
The measured FD energy spectrum is compared to that predicted from the
ND assuming oscillations, following
Eq. (1). This comparison is made by minimizing a binned
log-likelihood with respect to and . The
Feldman-Cousins approach ref:FeldCous is used to obtain
confidence limits on the oscillation parameters with systematic
uncertainties included ref:NickThesis ; ref:AlexThesis . The
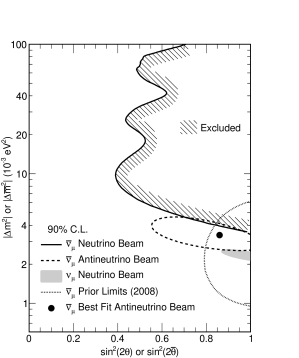
confidence limits thus obtained are shown in
Fig. 4. Values of greater than
1 eV2 are not considered in this analysis, since above that point
oscillations with maximal mixing would cause more than 1% of the
to disappear in the ND. Figure 4 also
shows the recent MINOS result using the beam configured for
antineutrinos ref:rhc , the MINOS allowed region for
neutrinos ref:minosCC2010 , and a fit ref:maltoni to all
global data available prior to all MINOS data. The MINOS data
presented in this paper are consistent with both the previous MINOS
neutrino and antineutrino limits, and with the limits from a global
fit ref:maltoni . A goodness-of-fit test using the
oscillation parameters from ref:minosCC2010 yields a
probability of 18%. Under the assumption these data
constrain (90% C.L.) in the
two-flavor approximation.
Figure 4: Allowed regions for oscillation parameters from a
fit to the data in Fig. 3. The region indicated by
the hashing is excluded. Shown alongside are contours for: the MINOS
result from the NuMI beam optimized for antineutrino
production ref:rhc ; the MINOS allowed region for
neutrinos ref:minosCC2010 ; and limits from a
fit ref:maltoni prior to all MINOS data.
In summary, a high-purity sample of muon antineutrino charged-current
events was selected in the MINOS data from the 7% component
of the NuMI neutrino beam. At the Far Detector, event candidates were observed, which is consistent with the
predicted rate in the case of oscillations of under
the assumption ,
. These data provide a new probe of the oscillation
hypothesis for muon antineutrinos at the atmospheric
scale. Significantly increased statistics in the 5–15 GeV energy
range, compared to the sample obtained with the NuMI beam
configured for antineutrinos, have allowed the oscillation probability
to be measured with greater precision in this region and have added to
constraints on antineutrino oscillation parameters.
This work was supported by the U.S. DOE; the United Kingdom STFC; the
U.S. NSF; the State and University of Minnesota; the University of
Athens, Greece; and Brazil’s FAPESP and CNPq. We are grateful to the
Minnesota Department of Natural Resources, the crew of the Soudan
Underground Laboratory, and the personnel of Fermilab for their
contribution to this effort.
References
(1) D. G. Michael et al. (MINOS),
Phys. Rev. Lett. 97, 191801 (2006); P. Adamson et
al. (MINOS), Phys. Rev. D 77, 072002 (2008).
(2) Y. Ashie et al. (Super-Kamiokande),
Phys. Rev. Lett. 93, 101801 (2004); Phys. Rev. D 71, 112005 (2005).
(3) B. Aharmin et al. (SNO), Phys. Rev. C 72, 055502 (2005).
(4) T. Araki et al. (KamLAND),
Phys. Rev. Lett. 94, 081801 (2005).
(5) C. Arpesella et al. (Borexino),
Phys. Rev. Lett. 101, 091302 (2008).
(6) W. W. M. Allison et al. (Soudan-2),
Phys. Rev. D 72, 052005 (2005).
(7) M. Ambrosio et al. (MACRO), Eur. Phys. J. C
36, 323 (2004).
(8) M. H. Ahn et al. (K2K), Phys. Rev. D 74, 072003 (2006).
(9) B. Pontecorvo, JETP 34, 172 (1958);
V. N. Gribov and B. Pontecorvo, Phys. Lett. B 28, 493 (1969);
Z. Maki, M. Nakagawa, and S. Sakata, Prog. Theor. Phys. 28,
870 (1962).
(10) See, for example, S. Weinberg, The Quantum
Theory of Fields (Cambridge University Press, Cambridge, England,
1995), Vol. I.
(11) L. Wolfenstein, Phys. Rev. D 17, 2369 (1978);
J. W. F. Valle, Phys. Lett. B 199, 432 (1987);
M. C. Gonzalez-Garcia et al., Phys. Rev. Lett. 82, 3202
(1999); A. Friedland, C. Lunardini, and M. Maltoni, Phys. Rev. D
70, 111301 (2004).
(12) Recent papers have discussed the
compatibility of such nonstandard interactions with MINOS data:
W. A. Mann et al., Phys. Rev. D 82, 113010 (2010);
J. Kopp, P. A. N. Machado, and S. J. Parke, Phys. Rev. D 82,
113002 (2010).
(13) P. Adamson et al. (MINOS),
Phys. Rev. Lett. 106, 181801 (2011).
(14) P. Adamson et al. (MINOS), Phys. Rev. Lett. 107, 021801 (2011).
(15) K. Anderson et al., FERMILAB-DESIGN-1998-01
(1998).
(16) The experiment measures an unresolved mixture
of and , which is
referred to as for brevity. The parameter
is likewise an admixture, dominated by
. Similarly for and
.
(17) M. C. Gonzalez-Garcia and M. Maltoni,
Phys. Rept. 460, 1 (2008). The contour shown in
figure 4 was received through private
communication.
(18) D. G. Michael et al. (MINOS),
Nucl. Instrum. and Meth. A 596, 190 (2008).
(19) R. Ospanov, Ph.D. thesis, University of Texas at
Austin, 2008.
(20) D. J. Auty, D.Phil. thesis, University of Sussex, 2010.
(21) P. Adamson et al. (MINOS),
Phys. Rev. Lett. 101, 131802 (2008).
(22) J. J. Evans, D.Phil. thesis, University of Oxford,
2008.
(23) A. Ferrari, P. R. Sala, A. Fasso, and J. Ranft
(2005), CERN-2005-10.
(24) G. Battistoni et al., AIP Conf. Proc. 896, 31 (2007).
(25) S. Agostinelli et al., Nucl. Instrum. and
Meth. A 506, 250 (2003).
(26) C. Alt et al. (NA49), Eur. Phys. J. C 49, 897 (2007).
(27) G. J. Feldman and R. D. Cousins, Phys. Rev. D
57, 3873 (1998).
(28) N. E. Devenish, D.Phil. thesis, University of Sussex,
2011.