THE CONTINUING OUTBURST OF V1647 ORIONIS: WINTER/SPRING 2011 OBSERVATIONS
Abstract
We present optical and near-IR observations of the young eruptive variable star V1647 Orionis which illuminates McNeil’s Nebula. In late 2003, V1647 Ori was observed to brighten by around 5 mags to r’=17.7. In early 2006 the star faded back to its quiescent brightness of r’23, however, in mid-2008 it brightened yet again by 5 mags. Our new observations, taken in early 2011, show V1647 Ori to be in an elevated photometric state with an optical brightness similar to the value found at the start of the 2003 and 2008 outbursts. Optical images taken between 2008 and 2011 suggest that the star has remained in outburst from mid 2008 to the present. H and the far-red Ca II triplet lines remain in emission with H possessing a significant P Cygni profile. A self-consistent study of the accretion luminosity and rate using data taken in 2004, 2007, 2008, and 2011, indicates that when bright, V1647 Ori has values of 162 L⊙ and 4210-6 M⊙ yr-1, respectively. We support the premise that the accretion luminosity and rate both declined by a factor 2–3 during the 5 mag fading in 2007. However, a significant parts of the fading was due to either variable extinction or dust reformation. We discuss these new observations in relation to previous published data and the classification schemes for young eruptive variables.
1 INTRODUCTION
Photometric variability is often present in young low-mass stars and can take the form of either periodic or stochastic brightness modulations. They are generally associated with such physical processes as stellar rotation, changes in overlying circumstellar obscuration, or variable mass accretion. However, the most dramatic variability seen is that of an eruptive nature when large amplitude photometric changes occur over relatively short periods of time, resulting in optical brightness increases of 100 fold or more. Such outbursts are thought to be an integral part of a young star’s pre-main sequence life being times when the accretion rate dramatically increases, and hence, they are phases when a large fraction of the star’s final mass is accreted. We refer the reader to the review articles by Hartmann & Kenyon (1996) and Reipurth & Aspin (2010) for more significant background on eruptive variables. Two varieties of eruptive variables have previously been found. These are colloquially termed FUors (Ambartsumian 1971) and EXors (Herbig 1989). FUor outbursts are named after the first young star seen to exhibit such a dramatic brightness increase, namely FU Orionis (Wachmann 1954; Herbig 1966). In the mid-1930s, FU Ori optically brightened by over 5 mags and has remained in this elevated state to the present day (i.e., over 70 years). EXors, named after the progenitor of the class EX Lup, are similarly energetic, however, their outbursts typically result in a brightening of 1–4 mags. In addition, EXor events generally last weeks to months rather than years to decades as in FUors. The spectral characteristics of FUors and EXors are also significantly different. In outburst, FUors exhibit optical absorption features indicative of a F–G supergiant star (Herbig 1966, 1977) and NIR absorption features typical of an M giant (Mould et al. 1978; Reipurth & Aspin 1997). They typically show H absorption with an associated blue-shifted component creating a P Cygni profile (Herbig 1966, 1977). Little to no H emission is observed. In outburst, EXors show an optical and NIR emission spectrum and often possess emission in the NIR CO overtone bandheads (see for example EX Lup, Aspin et al. 2010). Such a dichotomy is peculiar since, in both cases, the outbursts are thought to be driven by enhanced mass accretion. It remains a mystery how young star outbursts driven by the same physical mechanism can exhibit such different photometric and spectroscopic characteristics.
An alternative model for FUor outbursts that warrants consideration was proposed by Larson (1980) and subsequently further investigated by Herbig (1989), Petrov & Herbig (1992), Herbig et al. (2003), and Petrov & Herbig (2008). In this model a rapidly rotating young star develops a bar-like deformation that causes the outer layers of the star to heat up resulting in the observed increase in luminosity. Although not as popular as the accretion disk model, this model does have several attractive characteristics, none less than providing separate outburst mechanisms for FUors and EXors.
It is clearly important to find and study in detail new examples of both FUors and EXors. To date, out of the tens of thousands of young stars known, only a dozen or so of both types are known. One recent discovery was V1647 Ori. This young star is located near M 78 in Orion and was discovered by amateur astronomer Jay McNeil (McNeil 2004) when he found a previously unidentified nebula in the region. This nebula, now known as McNeil’s Nebula, is illuminated by V1647 Ori, which appears at the apex of its monopolar geometry. In quiescence, V1647 Ori is a faint young star (r’23) located near the Herbig-Haro (HH) objects HH 22, 23, and 24 (Herbig 1974). Since its discovery in late 2003, soon after it had brightened by 5 mags, it was the subject of numerous observational studies at wavelengths spanning the electromagnetic spectrum from X-rays to radio. Rather than explicitly mention each of the 50+ papers published from 2004 to the present day, we refer the reader to Aspin & Reipurth (2009) for both a more comprehensive list and a discussion of the optical photometric and spectroscopic variability during the period 2003–2006.
Soon after discovery, V1647 Ori exhibited a strong emission spectrum in both the optical and NIR. This eruption (henceforth referred to as the first outburst) lasted around 2 years, after which the star faded back to its pre-outburst quiescent brightness. All indications were that V1647 Ori was an example of the EXor class of eruptive variables especially in light of the presence of a previous outburst in 1966 (Aspin et al. 2006). However, it was subsequently shown that at high spectral resolution, the source possessed unique 2 m spectral structure only found in FUors (Aspin et al. 2008). It was somewhat surprising that in 2008 V1647 Ori again optically brightened by 5 mags (Kun 2008; Aspin et al. 2009). Observations taken during the new eruption (below referred to as the second outburst) showed almost identical features to the earlier event (Aspin et al. 2009), from a similarly illuminated McNeil’s Nebula to an optical emission spectrum with a P Cygni profile H, and CO overtone bandhead emission. In the period 2008 to 2010, it is unclear what changes occurred in the optical and NIR brightness of V1647 Ori. Few observations of the source were reported during this period, however, Teets et al. (2011) found that throughout the period 2002 to 2009, the X-ray flux from V1647 Ori was well correlated with its optical and NIR brightness. Additionally, in the period 2008 September to 2009 April, its X-ray flux varied on short-timescales between 2 and 81030 ergs s-1 111Pre-outburst, V1647 Ori had an X-ray luminosity of 31029 ergs s-1 while during the 2004 outburst it rose to 1031 ergs s-1 (Kastner et al. 2004).. This result implies that V1647 Ori was highly active during the above period and suggests that it was likely bright at optical and NIR wavelengths.
In this paper, we detail the status of the source in the period 2011 February to April, finding that it has remained in an highly active eruptive state.
2 OBSERVATIONS & DATA REDUCTION
The complete observing log for the V1647 Ori observations presented below is shown in Table 1. Observations were acquired on three different telescopes, all located on Mauna Kea, Hawai’i. The “Fredrick C. Gillett” Gemini-North 8m telescope was used on five different occasions to obtain optical and NIR imaging and spectroscopy (under queue observing programs GN-2010A-Q-10 and GN-2011A-Q-37). Additional NIR spectroscopy was obtained in engineering time on the NASA IRTF 3m telescope. Optical images of V1647 Ori were also obtained at four different epochs on the University of Hawai’i 2.2m telescope (from 2008 to 2009). Below we detail the observations acquired and briefly comment on their subsequent reduction and analysis.
2.1 Optical Imaging
The Gemini-North instrument used for optical imaging was GMOS (Davies et al. 1997; Hook et al. 2004). Data were acquired on UT 2011 February 2. Photometric calibration was achieved using the field star sequence defined in Aspin & Reipurth (2009). We used the SDSS r’ filter with a 014 pixel scale, and a total exposure time of 60s. All images were reduced using the Gemini GMOS iraf package (v1.10). Photometry was extracted from the images using the Starlink GAIA package. Similar imaging observations were obtained with Gemini-North/GMOS in 2004 and 2007 (Aspin & Reipurth 2009).
The University of Hawai’i 2.2m telescope and the thinned back-side illuminated Tektronix 20482048 optical CCD camera, Tek, were used to obtain optical imaging on UT 2008 August 31 and October 9, and 2009 January 23 and September 11. At all three epochs, a Johnson-Cousins RC filter was used with a detector-defined pixel scale of 021. The exposure time in each case was 60s. Photometric calibration again used the field star sequence mentioned above. Transformations to the SDSS r’ filter system was performed as outlined in Aspin & Reipurth (2009). The images were reduced using the Starlink package CCDPACK in a standard manner. The Starlink GAIA package was again used to perform photometry extraction.
2.2 Optical Spectroscopy
As in the case of the Gemini-North imaging above, the instrument used for optical spectroscopy was GMOS. Data were acquired on UT 2011 February 2 using the B600 grating with a central wavelength 7500 Å. A 075 wide long-slit was used resulting in a resolving power, R, of 1200 (0.45 Å pixel-1). This value of R gives a full-width half maximum (FWHM) of unresolved lines of 130 km s-1. The total on-source exposure time for the spectroscopy was 300s. Identical observations of the spectrophotometric standard star G191-B2B were also taken to allow flux calibration and sensitivity function definition. All spectra were reduced using the Gemini GMOS iraf package (v1.10). Feature extraction was performed using the iraf task splot.
2.3 Near-IR Imaging
Our NIR imaging observations were taken using the Gemini-North facility NIR camera, NIRI (Hodapp et al. 2003). Data were acquired on UT 2011 February 6 using the f/32 camera due to the intrinsic brightness of the source (thus allowing shorter exposure times) in standard “Mauna Kea” J, H, K’, and L’ filters. For each filter, four dithered images were taken to allow for both sky subtraction and uncertainty estimation. Total exposure times of 20s were used for J, H, and K’, and 48s for L’. Similar observations of the NIR faint standard star FS 150 were taken for flux calibration purposes. The images were reduced using the Gemini NIRI iraf package (v1.10). Extraction of photometry from the reduced images was performed using the Starlink GAIA program. Flux from V1647 Ori was extracted using 5′′ diameter circular apertures with sky values determined from regions of blank sky close to the source. Similar analysis was performed on the standard star. This technique gave us the star+nebula photometry within the aperture used and it is this we present below.
2.4 Near-IR Spectroscopy
Our first of two epochs of NIR spectroscopic observations were acquired using the Gemini-North facility integral-field unit (IFU) spectrograph, NIFS (McGregor et al. 2003) using the J, H, and K-band gratings. Data were obtained on UT 2011 February 15 using total exposure times of 120s per waveband, resulting in spectra with a spectral resolution of R5000. Sky observations, taken using an ’ABA’ offset sequence (where A is on-source and B is sky), were also acquired to facilitate accurate sky subtraction. Similar observations of the A0 V star HIP 103222 were taken to allow the removal of telluric features from the target spectra. The data were reduced using the Gemini NIFS iraf package (v1.10). The final spectra of the target and telluric standard are the sum of the IFU pixels lying within an 05 diameter software aperture centered on the targets. Telluric correction was performed using the IDL SpeX procedure xtellcor_general (Vacca et al. 2003;Cushing, Vacca, & Rayner 2004). Conditions were clear and the seeing stable during the target and standard observations and hence, since this is IFU data, we consider the flux calibration good to the 5% level.
Our second epoch NIR spectroscopy was acquired on the NASA IRTF telescope on UT 2011 April 19 using the facility NIR spectrograph SpeX (Rayner et al. 2003). The cross-dispersed (XD) mode was used and observations were acquired using the short–XD settings resulting in a spectral resolution of R1500. The data were reduced using the SpeX IDL package (Cushing, Vacca, & Rayner 2004). Telluric correction and flux calibration were performed using the A0 V telluric standard star HD 35656. Conditions were again clear and the seeing stable during the target and standard observations and we consider the flux calibration good to the 10% level.
3 RESULTS
3.1 The Recent Photometric Behavior of V1647 Ori
V1647 Ori was originally observed to go into outburst in the fall of 2003 (Briceño et al. 2004). This phase lasted about two years and by the fall 2005 had faded back to its pre-outburst quiescent brightness (r’23, Aspin Beck, & Reipurth 2008). This behavior was very similar to the previously documented outburst of the source in 1966 (Aspin et al. 2006). However, to the surprise of the variable star community, in the summer months of 2008 (while Orion was behind the Sun) V1647 Ori yet again flared to a similar outburst brightness (r’17). Between 2008 and 2011 the photometric behavior of V1647 Ori remains unclear with little to no new data being published. The AAVSO database of amateur astronomer observations contains a few V-band and “clear” observations of the source from 2008 September to 2011 February, however, they are somewhat disparate in nature (some observations within a few days of each other have V of over 4 mag) and we cannot consider them a truly reliable source for the recent photometric history of the young star. In Table 2 we have compiled several observations of V1647 Ori from data acquired by cooperative observers on the University of Hawai’i 2.2m telescope. Although sporadic in nature, these R-band observations suggest that between the second outburst of V1647 Ori in mid-2008 and the early months of 2011, V1647 Ori remained in an elevated photometric state with an optical r’ brightness between 16.9 and 17.8. Even though the gaps in our photometry are relatively large (ranging from 1 to 9 months), we believe that the temporal range, sampling frequency, and random nature of the observations all support the hypothesis that from 2008 August to 2011 February (i.e., around 32 months), V1647 Ori remained in outburst.
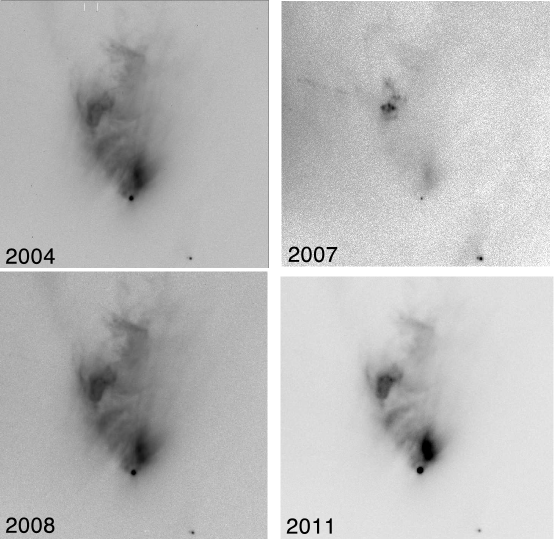
Figure 1 shows r’ band images of V1647 Ori and McNeil’s Nebula from four different epochs ranging from early 2004 to early 2011. The data from 2004 (first outburst, top-left), 2007 (quiescent phase between outbursts, top-right), 2008 (second outburst, bottom-left) and 2011 (bottom-right) all appear morphologically similar with all nebulous features seen in the original outburst image from 2004 repeating in 2008 and 2011. The 2007 image, showing the source after the first outburst had faded (hence McNeil’s Nebula is only faintly visible), shows well the HH 22 object/jet which is present in all images but difficult to see due to the presence of the bright reflection nebulosity. The nature of the structure in the nebula is interesting in that over a period of 7 years, the physical material which is reflecting the light from V1647 Ori appears static. The distance from V1647 Ori to the northern almost horizontal section of nebulosity is 55′′ (directly north, sloping down from east to west). Assuming a distance of 450 pc and a nebula axis inclination with respect to the plane of the sky of 2914∘ (Acosta-Pulido et al. 2007), this corresponds to 0.14 pc (and hence the light travel time between the two locations is 164 days). If the nebulous structures are located on the walls of an evacuated cavity (created by an earlier molecular outflow as generally assumed) and are moving at typical CO flow values of 10 km s-1, then even in 7 years the expected motion of the material along the cavity walls would be only 15 AU or, at the above distance, 004. This would clearly not be detected in our natural seeing images.
3.2 NIR Color Variations
The compilation of NIR photometry of V1647 Ori in Table 3 shows observations from five epochs ranging from 2004 March to 2011 April. The purpose of this Table is to show the relative consistency in photometry from the time of the original outburst (2004 March) to soon after the second outburst (2008 September) and onto the current observations (2011 February and April). Data from the quiescent phase between the first and second outburst are also shown (2007 February). Clearly, V1647 Ori has maintained its optical and NIR outburst brightness and colors subsequent to its second outburst.
The NIR J–H, H–K’, and K’-L’ colors of the sources, and their variability, are shown in Figures 2 and 3. The J–H vs. H–K’ color–color (henceforth JHK’ c–c) diagram (Figure 2) shows the location of V1647 Ori at 10 different epochs (including the five shown in Table 3). These points, labeled #1 through #10, are in chronological order and show significant color variability during the period 1998 (2MASS) to 2011. Other than points #8–10, the values were compiled from other sources (listed in the figure caption). Aspin, Beck, & Reipurth (2008) interpreted the color variation seen in Figure 2 (points #1–7) as due to changes in overlying extinction caused by either the sublimation of dust in the outburst, or denser material moving into the line-of-sight e.g. similar to what occurred in KH 15D (see Kusakabe et al. 2005 and references therein) since the variations were directly along standard reddening vectors. The additional photometric points (#8–10) are all consistent with the values of the JHK’ colors at the time of the first outburst in 2004 March. Point #8 is from soon after the second outburst phase. Points #9 and #10 are from 2011 February and April, respectively. This behavior is consistent with the optical brightness of V1647 Ori at these times; the infrared colors are smaller during the outburst while they are larger colors in quiescence.
In Figure 2 we have plotted loci of varying contributions of a stellar photosphere at a black-body temperature of 4000 K and dust emission from black-body temperatures of 800–2000 K (dotted lines). At position “A” the contribution is 100% from the stellar photosphere while at position “B” it is 100% from the heated dust. The simple model used generated black-body fluxes using the IDL routine PLANCK which takes as input the required wavelength and temperature. We generated fluxes at the central wavelengths of the NIR filters for both the stellar temperature and the heated dust temperature and then divided both by the corresponding values from an A0 star (at 10,000 K). These scaled fluxes were then normalized to unity at the middle wavelength (i.e. the H-band for J, H, and K filters) and the results used to calculate the NIR colors in the standard manner. Although the generated fluxes are not integrated over specific filter profiles, we consider that the values at the central wavelengths of the filters are sufficiently accurate for our needs. The contributions to the derived colors from the stellar photospheric and heated dust fluxes vary from 0 to 1 and 1 to 0, respectively. This results in the (dotted) lines shown in Figure 2.
One interesting fact is that the line joining points A and B is close to being parallel to the reddening vector from the extreme of the Meyer et al. (1997) classical T Tauri star locus (dotted line). One could therefore interpret the change in colors of V1647 Ori as being the result of changing black-body dust temperature from 900 K at point #7 to 1200 K close to the group of points centered on point #9. However, this interpretation would assume that all the emission from the source originates as black-body dust emission with no stellar photospheric contribution. This seems unreasonable for three reasons i) the source is optically bright, ii) Aspin, Beck, & Reipurth (2008) found photospheric absorption features in the NIR spectrum of V1647 Ori during quiescence (in 2007), and iii) the low inclination of the outflow cavity (2914∘ with respect to the plane of the sky) and the lack of a southern counterpart outflow lobe suggests we are not looking through dust dominated material (i.e., through the disk) along our line-of-sight to the circumstellar regions. We therefore consider that our new data supports the interpretation of the change in JHK’ colors as due to extinction changes resulting from the outburst event as proposed earlier by Aspin & Reipurth (2009).
In Figure 3 we show the H–K’ vs K’–L’ (henceforth HK’L’) color variations for V1647 Ori. Three points from different epochs are plotted (#7–9), specifically, 2007 February, 2008 September, and 2011 February222The point numbering corresponds to those in Figure 2.. These three points lie parallel to the reddening vectors consistent with the suggestion that the changes observed are due to variations in overlying extinction. Point #7 has the largest colors in both the JHK’ and HK’L’ c–c diagrams and was taken in 2007 February, between the first and second outbursts. Point #8 has the smallest colors in both diagrams and at that time (2008 September), V1647 Ori was in a bright phase just after its second outburst. Point #9 represents the latest observation (2011 February) and, within the associated uncertainties, is very similar to the 2008 elevated state value (#8). The AV difference between point #8 and #9 amounts to only a few mags in both c–c diagrams (1.5 in JHK’ and 3 in HK’L’). The AV differences between points #7 and #8 is 8 mags in both diagrams.
3.3 Optical Spectroscopic Features
During the two recent outburst phases (i.e., 2004 March and 2008 September), V1647 Ori typically showed an optical emission spectrum which included a strong H line with associated sub-continuum blueshifted absorption (i.e., a P Cygni profile) and strong far-red Ca II triplet emission. Examples of these spectra can be found in Aspin & Reipurth (2009). In its faint phase between the above outbursts (i.e., in 2007 February), the source also exhibited an optical emission spectrum but with significantly weaker H emission (with no sub-continuum blueshifted absorption) plus, as in outburst, Ca II triplet line emission. Our 2011 February optical spectrum of V1647 Ori is shown in Figure 4. The line fluxes extracted from this spectrum are shown in Table 4. The top panel shows the complete GMOS spectrum covering the wavelength range 6000–9000 Å. This spectrum has been continuum subtracted to enhance the visibility of the spectral features present333The optical continuum simply rises to the red through the above wavelength region.. In this spectrum, H is, as expected, in emission and, like the aforementioned outburst phase spectra, shows a strong sub-continuum blueshifted absorption component.
Closer views of the region surrounding H and Ca II triplet lines are shown in the middle and bottom panels of Figure 4. The wings of H extend out to –800 and +540 km s-1, on the blue and red side, respectively, and the absorption minimum occurs at –240 km s-1. The Ca II triplet lines are also in emission and it seems they are marginally resolved with deconvolved FWHM values of 90 km s-1. The ratios of the EW values for the three lines (i.e., –8.6, –9, and –7.7 Å) are 1.9:2:1.7. This places V1647 Ori in the highly optically thick region of Figure 3 from Herbig & Soderblom (1980) and Figure 8 of Hamann & Persson (1992).
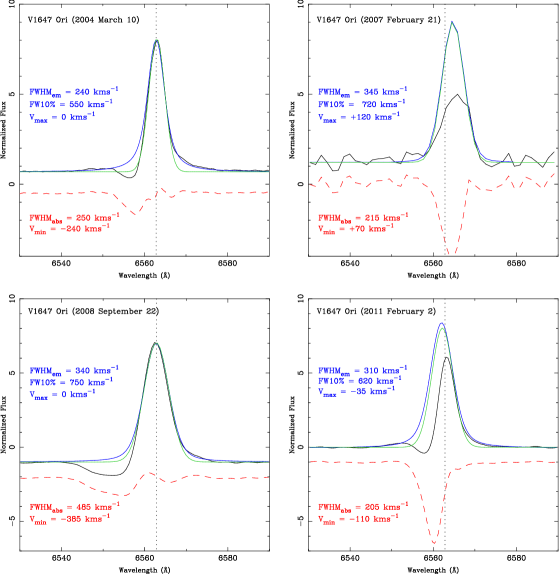
Since H is clearly a composite of emission and absorption components, we have fit an emission profile to the red wing of the H emission (the wing not effected by the blueshifted absorption component) and attempt to determine the underlying structure of the emission. Figure 5 shows the result of this analysis together with similar analysis for H in 2004, 2007, and 2008. Due to the high velocity wings of the emission, the 2004, 2008, and 2011 spectra are best fit with a composite Voigt profile (Gaussian + Lorentzian). For the 2007 spectrum, a simple Gaussian suffices. In all four panels, the black line is the observed H profile, the blue line is the best-fit Voigt emission profile, the green line is the best-fit Gaussian, and the red dashed line is the difference (observed–model). In 2004, 2008, and 2011, the model emission component peak occurs very close to the nominal H wavelength of 6562.8 Å. In 2007 (between the outbursts), the peak is redshifted by 120 km s-1. Similarly, in 2004, 2008, and 2011, the absorption component minimum, resulting from (observed–model) emission profiles, is significantly blueshifted (–240, –385, and –110 km s-1, respectively) while in 2007, the absorption minimum is slightly redshifted (+70 km s-1). This implies that in 2004, 2008, and early 2011, there was both significant mass accretion from disk to stellar surface and significant mass outflow from a stellar/disk wind. In 2007, the redshifted nature of both emission and absorption suggests that both the H emitting and absorbing gas is associated with infalling material.
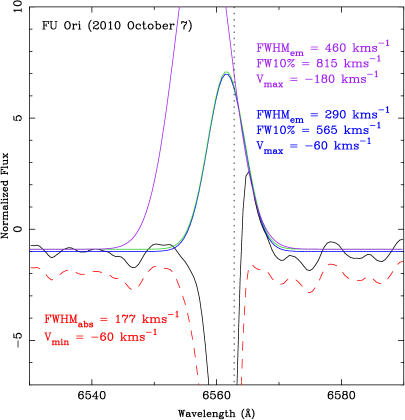
For comparison with the above V1647 Ori profiles, in Figure 6 we show a similar analysis of the H profile of FU Orionis from Gemini/GMOS B600 grating spectrum444i.e., the same setup as used for the acquisition of the V1647 Ori GMOS spectrum. taken on UT 2010 October 7. We note that here, both emission and absorption components are slightly blueshifted (by –60 km s-1). The emission component (blue/green line) is reproduced with a simple Gaussian with a FWHM of 290 km s-1 and full-width 10% intensity, FW10%, of 580 km s-1. The absorption component (red dotted line) has a FWHM=177 km s-1, and is skewed with an extended blue-wing. The fact that the peak emission and minimum absorption components have very similar velocity offset results in an absorption dominated observed profile with only weak redshifted emission. The purple line will be discussed further below.
Table 5 details the velocity structure present in H during the two outbursts (2004 and 2008), in the quiescent phase between them (2007), and in our latest spectrum (2011). Also included is the same information for FU Ori. The velocity information for V1647 Ori compares well with that from FU Ori. Comparing these values suggests that in 2011, V1647 Ori was very similar in characteristics to when it was observed in 2004 and 2008. This, coupled with the suggestions that the source has remained bright since the second outburst implies that V1647 Ori has remained in an elevated eruptive state for at least the last 3 yrs.
3.4 NIR Spectroscopic Features
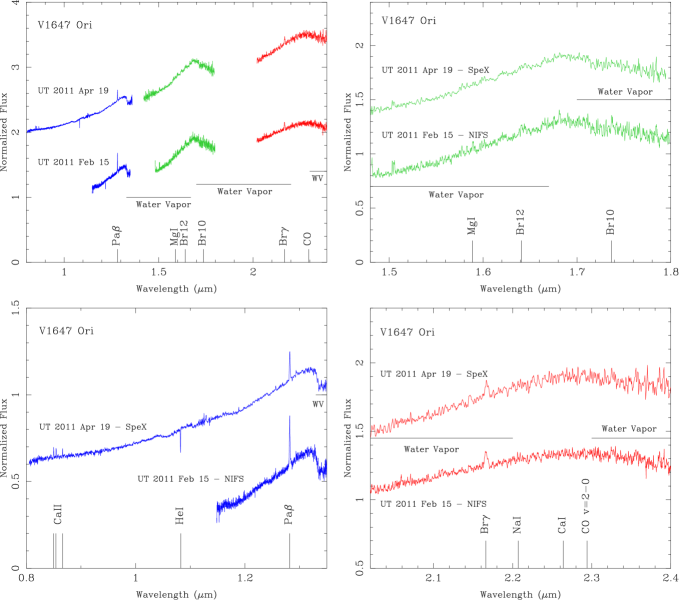
Our two epochs of NIR spectroscopic observations of V1647 Ori are shown in Figure 7. The four panels show the full wavelength range of the data (top-left), plus individual panels for the J (bottom-left, blue), H (top-right, green), and K (bottom-right, red) bands. The Gemini/NIFS spectra from UT 2011 February 15 is the bottom of the two spectra while the IRTF/SpeX spectra from UT 2011 April 19 is at the top. The SpeX spectrum extends to shorter wavelengths than that from NIFS although the NIFS spectrum is of somewhat higher spectral resolution. The spectra from the two epochs are very similar, both being dominated by strong water vapor absorption bands extending over the wavelength ranges 1.3–1.65 m, 1.7–2.2 m, and 2.3 m to the long wavelength extreme of the K-band555The water vapor bands are intrinsic to the source and not telluric features.. The individual passband plots show that the spectra from the two epochs exhibit almost identical spectral details. The main atomic features present are Pa (1.208 m) and Br (2.166 m), both in emission. The SpeX spectrum includes both the He I (1.082 m) line, which is in absorption, and the far-red Ca II triplet lines, which are in emission (as they were in our optical spectra presented above). Line fluxes from both the above NIR spectra are shown in Table 6. In the SpeX spectrum, the Ca II triplet lines have ratios of 2.4:2:1.5 (or in the units of Hamann & Persson 1992, 1.2:0.7). These values are somewhat different from the values encountered 2.5 months earlier (see above). In these data, the location of V1647 Ori, in Figure 8 of Hamann & Persson (1992) and Figure 3 of Herbig & Soderblom (1980), is close to the region occupied by classical T Tauri stars (henceforth CTTSs) with the nearest being CW Tau.
Conspicuously absent from the K-band spectra are the CO overtone bandheads that, when present, extend redward from 2.294 m. In both K-band spectra, no CO bandheads are observed with the spectra being featureless at those wavelengths. This is in contrast to the NIR spectra taken during the 2004 outburst (Reipurth & Aspin 2004) which showed strong CO overtone emission bands. In 2007 (between outbursts, Aspin, Beck, & Reipurth 2008) and in 2008 (during the second outburst, Aspin et al. 2009), the CO bandheads were weakly in absorption. Figure 8 shows an inter-comparison of the 1–2.5 m spectral structure in 2004, 2007, 2008, and 2011.
3.5 Accretion Luminosities and Rates
Several methods have been presented in the literature to allow estimation of accretion luminosities and rates from observed quantities. Almost all, however, rely on an accurate determination of overlying extinction so that true dereddened fluxes can be determined. Dahm (2008) presented a comprehensive discussion of the techniques involved and applied them to young solar mass stars in IC 348. He found that estimating accretion parameters from optical and NIR emission line fluxes (using predictions made by standard magnetospheric accretion models, e.g. Muzerolle et al. 1998, 2001; Kurosawa et al. 2006) and continuum excess emission determination (Valenti et al. 1993; Gullbring et al. 1998) were in reasonable agreement for the sample of quiescent young stars observed. It is unclear, however, if such an agreement can be obtained for eruptive variables such as V1647 Ori. The one method that does not rely on extinction is the measurement of the FW10% of the H emission as suggested by White & Basri (2003) and Natta et al. (2004). Using equation (1) from Natta et al. (2004) we can estimate the accretion rate from the H FW10% value. Below therefore, we derive values for accretion luminosity (Lacc) and rate (Ṁacc) for V1647 Ori in 2011 using both our NIR observations (since the effect of reddening is significantly smaller at these wavelengths than in the optical) and the FW10% value for H (which is not effected by extinction).
3.5.1 Using Pa and Br to derive Ṁacc
Muzerolle et al. (1998) demonstrated how dereddened Pa and Br emission line fluxes are correlated with mass accretion rate in CTTSs. The relationship determined by Muzerolle et al. (1998) was used by Aspin, Beck, & Reipurth (2008) and Aspin et al. (2009) to obtain estimates of Lacc and Ṁacc for V1647 Ori during the faint period between the two outbursts and soon after the start of the second outburst. Since both the correction to the observed line flux (to account for overlying visual extinction), and the stellar/disk parameter values used are of importance in such an analysis, we here detail a self-consistent analysis using a fixed set of stellar/disk characteristics and AV values obtained from the JHK’ c–c diagram shown in Figure 2. The JHK’ photometry of the source during the first outburst (epoch 2004 March, point #2 in the above figure), the second outburst (epoch 2008 August, point #8), and in early 2011 (points #9 and #10) all result in very similar NIR colors. If we dereddened their average location (along the reddening vector shown in Figure 2) to the CTTS locus of Meyer et al. (1997), we obtain an AV=82 mags. During the faint phase between the two outbursts (epoch 2007 February, point #7), a similar dereddening gives an AV=192 mags.
It was suggested by Aspin et al. (2009) that Pa emission (1.28 m) in V1647 Ori is very likely optically thick due to the significant deviation of the ratio Pa/Br from that obtained for Case B recombination theory (Hummer & Storey 1987). Subsequently, they only used the Br emission line flux for their estimate of Lacc and Ṁacc. In Table 7 we show the results of our analysis using both Pa and Br line fluxes from 2004 March, 2007 February, 2008 August, and 2011 February and April. Also shown are the AV value used in dereddening and the above line flux ratio values. Case B recombination theory results in a value of P/Br of 6 for temperatures in the range T=7500–20,000 K and electron densities in the range ne=104–1010 cm-3 (Hummer & Storey 1987, Table 6). The only value of Pa/Br that is close to this is from 2007 February when it had a value of 5. This date corresponds to the faint period between the first and second outbursts. At all other times (i.e., early in the first and second outburst and in early 2011), the ratio is much smaller with a typical value of 2. We interpret this as evidence that the Pa emission is optically thick during periods when the star is bright, and close to being optically thin during its fainter periods. This is supported by the similarity of the derived values for Lacc and Ṁacc using the Pa and Br line fluxes in 2007 February and the significantly different values at the other three epochs. The conclusion we can draw from Table 7 is that close to the start of the first and second outbursts, and in 2011, the accretion luminosity was L162 L⊙ and the accretion rate was Ṁ4210-6 M⊙ yr-1. In the faint phase between the first and second outbursts, the accretion luminosity and rate both declined by a factor 3. Although the statistical significance of this decline is relatively small, we postulate that it is real since something clearly changed in 2007 to cause the 5 mag fading of V1647 Ori. It is unlikely that this decline is a result of an incorrect AV value since it would require an A25 mags (instead of 192 mags) to give the factor 3 decline in the observed Lacc and Ṁacc.
3.5.2 Using H FW10% to derive Ṁacc
The relationship between the FW10% width of the H emission profile and the accretion rate derived by Natta et al. (2004) relies on the assumption that the H emission is generated by the accretion process. Under this assumption, the relationship is linear in nature, although the spread of values around their best-fit line is significant. The formula is reproduced below in Eqn (1).
| (1) |
The stars upon which the relationship was defined were a combination of young brown dwarfs of spectral type M6–M8.5 with accretion rates in the range 10-11–10-9 M⊙ yr-1, and young T Tauri stars (M0.3 M⊙) with accretion rates in the range 10-9–10-6 M⊙ yr-1. Over all the sources, the range of H emission FW10% values was 200–700 km s-1.
The above correlation has implicit uncertainties defined by both the errors on the observed quantities and the non-simultaneity of the measurement of H FW10% and the independent determination of Ṁacc. Natta et al. state that the derived value of Ṁacc should be “used with care” for individual objects. Nevertheless, it is informative to apply this analysis to the data on V1647 Ori and compare the results with those obtained from the Br line flux measurements.
Table 8 shows the results of this analysis for V1647 Ori for the four epochs all of which are close in time to those used to derive Ṁacc from the Pa and Br fluxes (and shown in Table 7). Comparing the derived values of Ṁacc in Table 8 with those in Table 7, we see significant differences, in all cases the Ṁacc values determined from the H FW10% value are considerably smaller than those estimated from the Br flux. For example, on 2004 March 9, the dereddened Br flux gives a value of Ṁacc=5.310-6 M⊙ yr-1. One day later, the H FW10% gave Ṁacc=210-8 M⊙ yr-1 some 265 smaller. Using the relationship of Natta et al. (2004), we would require a value of FW10% of 785 km s-1 (instead of the observed 530 km s-1) to obtain the Ṁacc value derived from the Br line flux. A similar situation occurs for all four epochs of H FW10% measurements. In addition, the FW10% value for FU Ori (580 km s-1) gives Ṁacc=510-8 M⊙ yr-1 which is significantly smaller than the expected value for a classical FUor666A classical FUor is one whose rise from quiescence to outburst was documented. Examples of classical FUors are FU Ori, V1057 Cyg, V1515 Cyg, and V1735 Cyg. of 10-5 M⊙ yr-1 (Hartmann & Kenyon 1996). To obtain an Ṁacc value of 110-5 M⊙ yr-1 would require a FW10% value of 815 km s-1. A best-fit profile for such an FW10% is shown in Figure 6 (purple line). Even if we consider the uncertainties inherent in Eqn (1), which result in a wide range of possible Ṁacc values (see Table 8), in all cases they do not include those values derived from the dereddened Br flux. Again using the 2004 March 10 FW10% value as an example, we find that the range of valid Ṁacc values, 410-9–810-8 M⊙ yr-1, does not include the one determined from the dereddened Br flux, (5.310-6 M⊙ yr-1).
We conclude, therefore, that the above derivation of Ṁacc for V1647 Ori using the H FW10% value as defined by Natta et al. (2004), tends to give considerably smaller values than those determined from dereddened Pa and Br emission line fluxes. Since this also appears to be the case for the classical FUor FU Orionis (when compared to the definitive values of 10-4 to 10-5 M⊙ yr-1) then perhaps using the H FW10% width to estimate Ṁacc is not valid for high accretion rate eruptive variables such as V1647 Ori and FU Ori. One possibility is that the strong star/disk wind present in FUors significantly contributes to or modifies the H emission observed (as suggested by Lima et al. 2010).
4 Discussion
From the data and analyses presented above, we support the hypothesis that V1647 Ori has remained in an elevated eruptive state since the time of the second outburst which occurred in mid 2008. Although the star likely underwent a decline in outburst activity in early 2007777We note that this decline is of relatively low significance with respect to the uncertainties on the derived values., its accretion luminosity and rate remained at the upper end of the range seen in CTTSs (Hartigan, Edwards, & Ghandour 1995; Gullbring et al. 1998). At that time, the decline in accretion characteristics was accompanied by a change in overlying visual extinction, caused by either the reformation of circumstellar dust or motion of dust into the line-of-sight. This resulted in an increase in extinction of over 10 mags. At the time of the second outburst, the enshrouding dust either re-sublimated or rotated out of the line-of-sight, and has remained absent.
Although both the optical/NIR line emission characteristics of V1647 Ori and the apparent decline in its optical brightness after 2 yrs more resemble those of the shorter period EXor variables, the source has several features in common with FUors e.g. the similarity of the NIR spectral absorption characteristics e.g. the presence of strong water absorption bands and the unique spectral structure, identified at high spectral resolution in FUors and V1647 Ori (Aspin, Greene, & Reipurth 2009). However, V1647 Ori exhibits several peculiarities that are not seen in the classical FUors. Specifically,
-
•
The characteristic optical absorption spectrum of a F–G type supergiant, which all four classical FUors (FU Ori, V1057 Cyg, and V1515 Cyg) exhibit, has not been seen. V1647 Ori has instead shown few absorption lines and strong emission features such as H and the far-red Ca II triplet (see Figure 4).
-
•
The four classical FUors exhibit deep and highly variable blueshifted H absorption with at most a weak emission component (Bastian & Mundt 1985). In addition, the far-red Ca II triplet lines can either be in emission or absorption (Welty 1991; Welty et al. 1992). During outburst, however, V1647 Ori showed strong H emission with associated blueshifted absorption and the far-red Ca II triplet lines are in emission.
-
•
The deep NIR CO overtone bandhead absorption features, typical of the four classical FUors (Reipurth & Aspin 1997; Connelley & Greene 2010), have not been observed in V1647 Ori, rather CO bandhead emission was seen soon after the first outburst. As the outburst subsided, the CO bandhead region became relatively featureless other than the weak CO absorption occurring in the quiescent period between the first and second outburst phases (see Figure 8).
-
•
The curving nebulous structure prototypical of classical FUors (Goodrich 1987) is replaced in V1647 Ori by an extensive monopolar structure, McNeil’s Nebula (see Figure 1).
One possibility to explain the dichotomy is that the viewing geometry of the young star/disk system plays a role in what spectral features are observed. High inclinations could easily result in selective illumination and/or obscuration. The telltale sign of a FUor, the presence of curving nebulosity extending away from the star (Goodrich 1987 presented several good example images) could be explained in terms of selective illumination of material located in either the walls of an evacuated cavity created by an earlier large-scale molecular outflow, or in the outer regions of the circumstellar disk. An earlier molecular outflow is very likely the origin of the monopolar nebula (McNeil’s nebula) in V1647 Ori which, as we have seen, has an estimated inclination (with respect to the plane of the sky) of 2914∘ (Acosta-Pulido et al. 2007). The opening angle of this cavity may also play a role in what nebulous structures are illuminated and hence observed. The lack of monopolar or bipolar structure associated with the classical FUors may well suggest that they are viewed at a much larger inclination (closer to 90∘). This interpretation would be unacceptable if the four classical FUors were the only FUors known, since statistically, this would be highly improbable. However, two sources postulated to be FUors, Par 21 (Staude & Neckel 1992; Kospal et al. 2008) and HH381 IRS (Reipurth & Aspin 1997; Magakian et al. 2011), both have bright monopolar cavities seen in reflected light and have inferred inclinations 30∘. Other FUor-like objects888FUor-like objects are those which possess many of the characteristics of classical FUors but for which the outburst was not documented. A current list of FUors and FUor-like objects is given in Reipurth & Aspin (2010). also possess well-defined outflow cavities e.g. PP 13S (Sandell & Aspin 1998; Aspin & Sandell 2001), L1551 IRS5 (Mundt et al. 1985), and V2495 Cyg (also known as the Braid Nebula Star, Movsessian et al. 2006). This means that a line-of-sight towards the four classical FUors with, say, i70∘ is not as unlikely as one might expect.
5 Conclusions
Our conclusions are:
-
1.
V1647 Ori has remained in an elevated photometric state since late 2008, which means that the current (second) eruption is now approaching 3 yrs old.
-
2.
McNeil’s Nebula has remained bright and has a morphology very similar to that seen during the 2004 and 2008 outbursts.
-
3.
CO overtone bandhead emission, seen in 2004 close to the beginning of the first eruption, is no longer present, with the spectral region from 2.9–2.4 m now being featureless.
-
4.
Water vapor absorption bands seen in the 1–2.5 m spectral region, which developed as the first eruption proceeded, remain strong.
-
5.
H still maintains a P Cygni profile indicative of the presence of a strong star/disk wind. The minimum in the absorption component is found to be at around –100 km s-1. The H FW10% value of 620 km s-1 implies that accretion rates are high although the value derived using the analysis of Natta et al. (2004), is at least a factor of 100 less than that obtained from the dereddened Br emission line fluxes.
-
6.
The accretion luminosity and rate in early 2011, derived from the dereddened Br flux, are 144 L⊙ and 3.8210-6 M⊙ yr-1, respectively. These are statistically similar to those found throughout the sources elevated photometric state. Although much of the 2007 fading of V1647 Ori was caused by the changes in line-of-sight extinction, we believe that the accretion luminosity and rate at that time declined by a factor of 2–3.
We wait with anticipation to track the changes occurring in V1647 Ori over the next few years.
Acknowledgments: We are extremely grateful to the anonymous referee for many constructive comments and suggestions on the manuscript. We wish to thank John Rayner for the IRTF engineering time during which some of the above data were obtained. We also thanks Eric Volquardsen for taking those observations on our behalf. We thank the University of Hawai’i observers who obtained optical imaging of V1647 Ori during their observing nights. Based on observations obtained at the Gemini Observatory, which is operated by the Association of Universities for Research in Astronomy, Inc., under a cooperative agreement with the NSF on behalf of the Gemini partnership: the National Science Foundation (United States), the Science and Technology Facilities Council (United Kingdom), the National Research Council (Canada), CONICYT (Chile), the Australian Research Council (Australia), Minist rio da Ci ncia e Tecnologia (Brazil) and SECYT (Argentina). This publication makes use of data products from the Two Micron All Sky Survey, which is a joint project of the University of Massachusetts and the Infrared Processing and Analysis Center/California Institute of Technology, funded by the National Aeronautics and Space Administration and the National Science Foundation. The authors wish to recognize and acknowledge the very significant cultural role and reverence that the summit of Mauna Kea has always had within the indigenous Hawaiian community. We are most fortunate to have the opportunity to conduct observations from this sacred mountain.
References
- Ambartsumyan (1971) Ambartsumyan, V. A. 1971, Astrophysics, 7, 331
- Acosta-Pulido et al. (2007) Acosta-Pulido, J. A., et al. 2007, AJ, 133, 2020
- Aspin et al. (2010) Aspin, C., Reipurth, B., Herczeg, G. J., & Capak, P. 2010, ApJ, 719, L50
- Aspin & Reipurth (2009) Aspin, C., & Reipurth, B. 2009, AJ, 138, 1137
- Aspin et al. (2009) Aspin, C., et al. 2009, ApJ, 692, L67
- Aspin et al. (2009) Aspin, C., Greene, T. P., & Reipurth, B. 2009, AJ, 137, 2968
- Aspin et al. (2008) Aspin, C., Beck, T. L., & Reipurth, B. 2008, AJ, 135, 423
- Aspin et al. (2006) Aspin, C., Barbieri, C., Boschi, F., Di Mille, F., Rampazzi, F., Reipurth, B., & Tsvetkov, M. 2006, AJ, 132, 1298
- Aspin & Sandell (2001) Aspin, C., & Sandell, G. 2001, MNRAS, 328, 751
- Bastian & Mundt (1985) Bastian, U., & Mundt, R. 1985, A&A, 144, 57
- Briceño et al. (2004) Briceño, C., et al. 2004, ApJ, 606, L123
- Connelley & Greene (2010) Connelley, M. S., & Greene, T. P. 2010, AJ, 140, 1214
- Cushing et al. (2004) Cushing, M. C., Vacca, W. D., & Rayner, J. T. 2004, PASP, 116, 362
- Dahm (2008) Dahm, S. E. 2008, AJ, 136, 521
- Davies et al. (1997) Davies, R. L., et al. 1997, Proc. SPIE, 2871, 1099
- Goodrich (1987) Goodrich, R. W. 1987, PASP, 99, 116
- Gullbring et al. (1998) Gullbring, E., Hartmann, L., Briceno, C., & Calvet, N. 1998, ApJ, 492, 323
- Hamann & Persson (1992) Hamann, F., & Persson, S. E. 1992, ApJS, 82, 247
- (19) Hartigan, P., Edwards, S., Ghandour, L. 1995, RMxAC, 3, 93
- (20) Hartmann, L. & Kenyon, S.J. 1996, ARAA, 34, 207
- (21) Herbig, G.H. 1966, Vistas in Astronomy, 8, 109
- (22) Herbig, G. H. 1974, Lick Observatory Bulletin, 658
- (23) Herbig, G.H. 1977, ApJ, 217, 693
- (24) Herbig, G.H. 1989, in ESO Workshop on Low Mass Star Formation and Pre-Main Sequence Objects, ed. B. Reipurth, p. 233
- Herbig & Soderblom (1980) Herbig, G. H., & Soderblom, D. R. 1980, ApJ, 242, 628
- Herbig et al. (2003) Herbig, G. H., Petrov, P. P., & Duemmler, R. 2003, ApJ, 595, 384
- Hodapp et al. (2003) Hodapp, K. W., et al. 2003, PASP, 115, 1388
- (28) Hook, I., Jorgensen, I., Allington-Smith, J.R., Davies, R.L., Metcalfe, N., Murowinski, R.G., & Crampton, D. 2004, PASP, 116, 425
- Hummer & Storey (1987) Hummer, D. G., & Storey, P. J. 1987, MNRAS, 224, 801
- (30) Kastner, J.H., Richmond, M., Grosso, N., Weintraub, D.A., Simon, T., Frank, A., Hamguchi, K., Ozawa, H., Henden, A., 2004, Nature, v430, 429
- Kóspál et al. (2008) Kóspál, Á., et al. 2008, MNRAS, 383, 1015
- Kun (2008) Kun, M. 2008, Information Bulletin on Variable Stars, 5850, 1
- Kurosawa et al. (2006) Kurosawa, R., Harries, T. J., & Symington, N. H. 2006, MNRAS, 370, 580
- Kusakabe et al. (2005) Kusakabe, N., et al. 2005, ApJ, 632, L139
- Larson (1980) Larson, R. B. 1980, MNRAS, 190, 321
- Lima et al. (2010) Lima, G. H. R. A., Alencar, S. H. P., Calvet, N., Hartmann, L., & Muzerolle, J. 2010, A&A, 522, A104
- Meyer et al. (1997) Meyer, M. R., Calvet, N., & Hillenbrand, L. A. 1997, AJ, 114, 288
- (38) McGregor, P.J. et al. 2003, SPIE, 4841.1581
- (39) Magakian, T-Yu. et al. 2011, in preparation
- McGehee et al. (2004) McGehee, P. M., Smith, J. A., Henden, A. A., Richmond, M. W., Knapp, G. R., Finkbeiner, D. P., Ivezić, Ž., & Brinkmann, J. 2004, ApJ, 616, 1058
- McNeil (2004) McNeil, J. W. 2004, IAU Circ., 8284
- Mould et al. (1978) Mould, J. R., Hall, D. N. B., Ridgway, S. T., Hintzen, P., & Aaronson, M. 1978, ApJ, 222, L123
- Movsessian et al. (2006) Movsessian, T. A., Khanzadyan, T., Aspin, C., Magakian, T. Y., Beck, T., Moiseev, A., Smith, M. D., & Nikogossian, E. H. 2006, A&A, 455, 1001
- Mundt et al. (1985) Mundt, R., Stocke, J., Strom, S. E., Strom, K. M., & Anderson, E. R. 1985, ApJ, 297, L41
- Muzerolle et al. (2001) Muzerolle, J., Calvet, N., & Hartmann, L. 2001, ApJ, 550, 944
- Muzerolle et al. (1998) Muzerolle, J., Calvet, N., & Hartmann, L. 1998, ApJ, 492, 743
- Muzerolle et al. (1998) Muzerolle, J., Hartmann, L., & Calvet, N. 1998, AJ, 116, 2965
- Muzerolle et al. (1998) Muzerolle, J., Hartmann, L., & Calvet, N. 1998, AJ, 116, 455
- Natta et al. (2004) Natta, A., Testi, L., Muzerolle, J., Randich, S., Comerón, F., & Persi, P. 2004, A&A, 424, 603
- Petrov & Herbig (1992) Petrov, P. P., & Herbig, G. H. 1992, ApJ, 392, 209
- Petrov & Herbig (2008) Petrov, P. P., & Herbig, G. H. 2008, AJ, 136, 676
- Rayner et al. (2003) Rayner, J. T., Toomey, D. W., Onaka, P. M., Denault, A. J., Stahlberger, W. E., Vacca, W. D., Cushing, M. C., & Wang, S. 2003, PASP, 115, 362
- Reipurth & Aspin (2004) Reipurth, B., & Aspin, C. 2004, ApJ, 606, L119
- Reipurth & Aspin (1997) Reipurth, B., & Aspin, C. 1997, AJ, 114, 2700
- (55) Reipurth, B. & Aspin, C. 2010, The Victor Ambartsumian Centennial Volume ”Evolution of Cosmic Objects through their Physical Activity”, eds. Hayk Harutyunyan, Areg Mickaelian and Yervant Terzian, Gitutyun Publishing House, Yerevan, Armenia, 2010
- Rieke & Lebofsky (1985) Rieke, G. H., & Lebofsky, M. J. 1985, ApJ, 288, 618
- Sandell & Aspin (1998) Sandell, G., & Aspin, C. 1998, A&A, 333, 1016
- Staude & Neckel (1992) Staude, H. J., & Neckel, T. 1992, ApJ, 400, 556
- (59) Teets, W.K., Grosso, N., Hamaguchi, K., Kastner, J.H., Principe, D., Richmond, M., Weintraub, D.A., 2011, BAAS, v43, abstract 21734030.
- Vacca et al. (2003) Vacca, W. D., Cushing, M. C., & Rayner, J. T. 2003, PASP, 115, 389
- Vacca et al. (2004) Vacca, W. D., Cushing, M. C., & Simon, T. 2004, ApJ, 609, L29
- Valenti et al. (1993) Valenti, J. A., Basri, G., & Johns, C. M. 1993, AJ, 106, 2024
- Wachmann (1954) Wachmann, A. 1954, ZAp, 35, 74
- (64) Welin, G. 1971, A&A, 12, 312
- Welty (1991) Welty, A. D. 1991, Ph.D. Thesis, University of Massachusetts, Amherst, MA
- Welty et al. (1992) Welty, A. D., Strom, S. E., Edwards, S., Kenyon, S. J., & Hartmann, L. W. 1992, ApJ, 397, 260
| UT Date | JD | Telescope/ | Details |
|---|---|---|---|
| Instrument | |||
| 2008 Aug 31 | 2454709 | UH 2.2m/Tek | optical imaging |
| 2008 Oct 09 | 2454748 | UH 2.2m/Tek | optical imaging |
| 2009 Jan 23 | 2454853 | UH 2.2m/Tek | optical imaging |
| 2009 Sep 11 | 2455084 | UH 2.2m/Tek | optical imaging |
| 2010 Jan 03 | 2455198 | Gemini-North/GMOS | optical imaging |
| 2011 Feb 02 | 2455593 | Gemini-North/GMOS | optical imaging |
| 2011 Feb 02 | 2455593 | Gemini-North/GMOS | optical spectroscopy |
| 2011 Feb 06 | 2455597 | Gemini-North/NIRI | NIR imaging |
| 2011 Feb 15 | 2455606 | Gemini-North/NIFS | NIR IFU spectroscopy |
| 2011 Apr 19 | 2455671 | IRTF/SpeX | NIR spectroscopy |
| UT Date | r’ |
|---|---|
| (mags) | |
| 2004 Mar 04 | 17.910.09 |
| 2007 Feb 22 | 23.260.15 |
| 2008 Aug 31 | 16.910.15 |
| 2008 Sep 22 | 17.530.07 |
| 2008 Oct 09 | 17.530.08 |
| 2009 Jan 23 | 17.380.12 |
| 2009 Sep 11 | 17.310.12 |
| 2010 Jan 03 | 17.510.06 |
| 2011 Feb 02 | 17.770.04 |
| Filter/Color | UT 2004 Mar 4/9aar’ data from Aspin & Reipurth (2009). J, H, K’ data from Acosta-Pulido et al. (2007). | 2007 Feb 22bbData presented in Aspin, Beck, & Reipurth (2008). | 2008 Sep 22ccData presented in Aspin et al. (2009). | 2011 Feb 2ddData from this paper (Gemini/NIRI.) | 2011 Apr 19eeData from this paper (IRTF/SpeX, SXD only). |
|---|---|---|---|---|---|
| (mags) | (mags) | (mags) | (mags) | (mags) | |
| r’ | 17.910.09 | 23.260.15 | 17.530.07 | 17.770.04 | – |
| J | 11.130.10 | 14.720.10 | 10.860.07 | 11.220.06 | 10.850.10 |
| H | 9.090.07 | 11.900.10 | 9.000.07 | 9.220.02 | 8.870.10 |
| K’ | 7.480.09 | 10.140.10 | 7.740.07 | 7.810.03 | 7.580.10 |
| L’ | – | 7.620.10 | 5.760.10 | 5.580.10 | – |
| J–H | 2.040.12 | 2.820.14 | 1.860.10 | 2.000.07 | 1.980.14 |
| H–K’ | 1.610.11 | 1.760.14 | 1.260.10 | 1.410.04 | 1.290.14 |
| K’–L’ | – | 2.520.14 | 1.980.14 | 2.230.14 | – |
| Line | EWaaEquivalent widths have associated uncertainties of 0.2 Å. | FWHMbbFull-Width Half Maximum line width. These values have associated uncertainties of 10 km s-1. | Line FluxccNumber in parentheses is exponent e.g. 9.24(–17) means 9.2410-17. | ContinuumccNumber in parentheses is exponent e.g. 9.24(–17) means 9.2410-17. | |
|---|---|---|---|---|---|
| (Å) | (Å) | (km s-1) | (ergs cm-2 s-1) | (ergs cm-2 s-1 Å-1) | |
| UT 2011 Feb 2 | |||||
| O I | 6300 | –0.9 | 170 | 1.19(–16) | 1.32(–16) |
| H | 6563 | –32.6 | 310ddFWHM measured on the model fit to the observed H profile. | 6.72(–15) | 2.02(–16) |
| O I | 7773 | +2.3 | 270 | 1.60(–15) | 7.04(–16) |
| Fe II | 8228 | +0.8 | 190 | 4.42(–16) | 7.37(–16) |
| Fe I | 8388 | –0.6 | 170 | 4.75(–16) | 7.91(–16) |
| O I | 8446 | –0.5 | 240 | 5.20(–16) | 8.17(–16) |
| Ca II | 8498 | –8.6 | 160 | 7.09(–15) | 8.15(–16) |
| Fe I | 8516 | –0.5 | 190 | 5.31(–16) | 8.25(–16) |
| Ca II | 8543 | –9.0 | 160 | 7.76(–15) | 8.41(–16) |
| Ca II | 8663 | –7.7 | 160 | 6.40(–15) | 8.47(–16) |
| UT 2011 Apr 19eeData from IRTF/SpeX spectrum that extends down to 8000 Å. | |||||
| Ca II | 8498 | –13.0 | 330 | 1.66(–14) | 1.24(–15) |
| Ca II | 8543 | –11.0 | 330 | 1.40(–14) | 1.31(–15) |
| Ca II | 8663 | –8.0 | 330 | 9.59(–15) | 1.43(–15) |
| Feature | UT 2004 Mar 10aaData taken soon after the first outburst. Line profile best-fit using a Voigt function. | 2007 Feb 21bbData taken between the first and second outburst. Line profile best-fit using a Gaussian function. | 2008 Sep 22ccData taken soon after the second outburst. Line profile best-fit using a Voigt function. | 2011 Feb 2ddData taken in 2011 February when the source was still optically bright. Line profile best-fit using a Voigt function. | 2010 Oct 7eeData taken in 2010 October. Line profile best-fit using a Gaussian function. |
|---|---|---|---|---|---|
| V1647 Ori | V1647 Ori | V1647 Ori | V1647 Ori | FU Ori | |
| H Emission | |||||
| Vmax (km s-1)ffVelocity of maximum H emission (with respect to the nominal H wavelength of 6562.8 Å) measured from the best-fit model. | 0ggTypical uncertainties in quoted velocities are 30 km s-1. | +120 | 0 | –35 | –60 |
| FW10% (km s-1)hhFull-Width 10% intensity of emission line measured on the model profile. | 530iiFW10%, and FWHM velocities have been deconvolved using a Gaussian with FWHM of an unresolved arc line (i.e., 130 km s-1). | 574 | 654 | 615 | 580 |
| FWHMem (km s-1)jjFull-Width Half Maximum of best-fit emission Gaussian measured on the model profile. | 240iiFW10%, and FWHM velocities have been deconvolved using a Gaussian with FWHM of an unresolved arc line (i.e., 130 km s-1). | 345 | 340 | 310 | 290 |
| H Absorption | |||||
| Vmin (km s-1)kkVelocity of the minimum in the blueshifted absorption component (with respect to the nominal H wavelength of 6562.8 Å) determined from the (observed–model) profile. | –240ggTypical uncertainties in quoted velocities are 30 km s-1. | +70 | –385 | –110 | –60 |
| FWHMabs (km s-1)llFull-Width Half Maximum of the (observed–model) absorption profile. | 250iiFW10%, and FWHM velocities have been deconvolved using a Gaussian with FWHM of an unresolved arc line (i.e., 130 km s-1). | 215 | 485 | 205 | 177 |
| Line | EWaaEquivalent widths have associated uncertainties of 0.2 Å. | Line FluxbbNumber in parentheses is exponent e.g. 3.45(–14) means 3.4510-14. | ContinuumbbNumber in parentheses is exponent e.g. 3.45(–14) means 3.4510-14. | |
|---|---|---|---|---|
| (m) | (Å) | (ergs cm-2 s-1) | (ergs cm-2 s-1 Å-1) | |
| UT 2011 Feb 15 | ||||
| Pa | 1.282 | –7.8 | 8.83(–14) | 1.14(–14) |
| Br | 2.167 | –5.5 | 2.02(–13) | 3.64(–14) |
| UT 2011 Apr 19 | ||||
| He I | 1.082 | +5.6 | 3.45(–14) | 6.75(–15) |
| Pa | 1.094 | –1.0 | 7.78(–15) | 7.21(–15) |
| 1.257 | –1.0 | 9.72(–15) | 1.43(–14) | |
| Pa | 1.282 | –6.0 | 1.01(–13) | 1.62(–14) |
| Br | 2.167 | –4.0 | 1.54(–13) | 4.52(–14) |
| UT | AVaaVisual extinction used to deredden line fluxes. Derived from dereddening J-H vs. H-K’ colors. | Pa/BrbbRatio of dereddened Pa and Br line fluxes. Case B recombination theory gives a value of 6. | LaccccDetermined from the dereddened Pa line flux. | ṀaccccDetermined from the dereddened Pa line flux. | LaccddDetermined from the dereddened Br line flux. | ṀaccddDetermined from the dereddened Br line flux. |
|---|---|---|---|---|---|---|
| Date | (mags) | (L⊙) | (10-6 M⊙ yr-1) | (L⊙) | (10-6 M⊙ yr-1) | |
| Pa | Br | |||||
| 2004 Mar 9eeFluxes from Vacca et al. (2004). | 82 | 2.20.3 | 5.12 | 1.30.6 (–5.88ffValues in parentheses are log10 of the preceding accretion rates.) | 206 | 5.33 (–5.28) |
| 2007 Feb 22ggFluxes from Aspin, Beck, & Reipurth (2008). | 192 | 4.90.3 | 3.42 | 0.90.3 (–6.06) | 52 | 1.21 (–5.92) |
| 2008 Aug 31hhFluxes from Aspin et al. (2009). | 82 | 1.40.3 | 2.41 | 0.60.2 (–6.19) | 165 | 4.03 (–5.39) |
| 2011 Feb 15iiFluxes from this paper. | 82 | 1.30.3 | 2.41 | 0.60.2 (–6.20) | 175 | 4.52 (–5.35) |
| 2011 Apr 19iiFluxes from this paper. | 82 | 1.90.3 | 2.81 | 0.70.2 (–6.13) | 124 | 3.22 (–5.50) |
| UT | FW10%aaH Full-Width 10% intensity measured on the best-fit model profile. | ṀaccbbAccretion rate derived using analysis of Natta et al. (2004). |
|---|---|---|
| Date | (km s-1) | (10-8 M⊙ yr-1) |
| V1647 Ori | ||
| 2004 Mar 10ccFrom Aspin & Reipurth (2009). | 530 | 2(0.4–8)ddValues in parentheses are the range of value defined by the uncertainties in the Natta et al. (2004) relationship. |
| 2007 Feb 21eeData from Aspin, Beck, & Reipurth (2008). | 574 | 5(1–24) |
| 2008 Sep 22ffData from Aspin et al. (2009). | 654 | 30(5–163) |
| 2011 Feb 2ggData from this paper. | 615 | 12(2–64) |
| FU Ori | ||
| 2011 Oct 7ggData from this paper. | 580 | 5(1–28) |