Mass growth and mergers: direct observations of the luminosity function of LRG satellite galaxies out to from SDSS and BOSS images
Abstract
We present a statistical study of the luminosity functions of galaxies surrounding luminous red galaxies (LRGs) at average redshifts and . The luminosity functions are derived by extracting source photometry around more than 40,000 LRGs and subtracting foreground and background contamination using randomly selected control fields. We show that at both studied redshifts the average luminosity functions of the LRGs and their satellite galaxies are poorly fitted by a Schechter function due to a luminosity gap between the centrals and their most luminous satellites. We utilize a two-component fit of a Schechter function plus a log-normal distribution to demonstrate that LRGs are typically brighter than their most luminous satellite by roughly 1.3 magnitudes. This luminosity gap implies that interactions within LRG environments are typically restricted to minor mergers with mass ratios of 1:4 or lower. The luminosity functions further imply that roughly 35% of the mass in the environment is locked in the LRG itself, supporting the idea that mass growth through major mergers within the environment is unlikely. Lastly, we show that the luminosity gap may be at least partially explained by the selection of LRGs as the gap can be reproduced by sparsely sampling a Schechter function. In that case LRGs may represent only a small fraction of central galaxies in similar mass halos.
Subject headings:
Galaxies: groups: general — Galaxies: evolution — Galaxies: interactions — Galaxies: elliptical and lenticular, cD1. Introduction
Massive galaxies in the nearby universe typically have very little cold gas, they host old stellar populations and exhibit extremely low specific star formation rates (e.g., Faber, 1973; Peletier, 1989; Worthey et al., 1992; Jørgensen, 1999; Trager et al., 2000; Kauffmann et al., 2003; Balogh et al., 2004; Hogg et al., 2004; Thomas et al., 2005). Therefore, studies of these galaxies typically find that essentially all of the stellar mass growth takes place through mergers and other gravitational interactions, with the relative importance of each process still debatable. For example, while some authors find that major dry mergers contribute significantly to the mass evolution of massive galaxies (e.g., van Dokkum et al., 1999; Tran et al., 2005; van Dokkum, 2005; Bell et al., 2006; Boylan-Kolchin et al., 2006; Naab et al., 2006; McIntosh et al., 2008; Bundy et al., 2009), others find only a mild contribution or none at all (e.g., Patton et al., 2002; Bundy et al., 2006; Masjedi et al., 2006; Wake et al., 2006, 2008; Masjedi et al., 2008; Tojeiro et al., 2011). Other studies argue that minor mergers and low mass accretion events contribute at least some of the stellar mass growth in massive galaxies over a longer timescale (e.g., Kormendy & Djorgovski, 1989; Schweizer & Seitzer, 1992; van Dokkum, 2005; Naab et al., 2007; Bournaud et al., 2007; Kaviraj et al., 2008; Naab et al., 2009; Bezanson et al., 2009; Tal et al., 2009; Ramos Almeida et al., 2011; Tal & van Dokkum, 2011). The unifying challenge of many of these analyses is that observations of ongoing mergers typically do not recover information regarding the mass ratio, and therefore implied growth, of the progenitor galaxies.
As an alternative to studying galaxy mergers many authors have turned to examining the environments in which these objects reside. For example, pair counts and clustering studies observe the progenitor galaxies prior to their merging. By studying the neighbors of massive galaxies one in effect probes the reservoir of objects with which mergers, and consequently mass growth, can occur. However, in studies of groups and clusters this technique typically relies on assigning environment membership to individual satellites using their inferred distances from the central galaxy (e.g., Ramella et al., 2000; Christlein & Zabludoff, 2003; Martini et al., 2006; Muzzin et al., 2009; Wilson et al., 2009; Chiboucas et al., 2010; Tanaka et al., 2010). This method requires that significant telescope time is devoted to spectroscopic measurements of all member candidates in order to properly assess their line-of-sight velocity and distance from the central galaxy. As a consequence, environments that are studied in this way are often restricted to the low redshift universe or to small statistical samples for which sufficiently deep data are available (such as the Coil et al., 2006 and Bolzonella et al., 2010 studies). Other techniques, such as the widely used friends-of-friends algorithms introduce another complication by explicitly assuming the size, and therefore inferred mass, of candidate groups (most of these algorithms are essentially a variation of the technique proposed and demonstrated in Huchra & Geller, 1982 and Geller & Huchra, 1983). Newer algorithms attempt to overcome the need for this assumption by iteratively measuring the light distribution within a given radius and adjusting it using the inferred mass from a halo density model (Yang et al., 2005, 2008).
Here we follow a different approach and detect satellite galaxies in a purely statistical manner, in practice measuring the average local overdensity of galaxies around massive red galaxies. This technique has been applied in studies of cluster galaxies by many authors utilizing various data sets (e.g., Driver et al., 1994; Gaidos, 1997; Lobo et al., 1997; Lumsden et al., 1997; Valotto et al., 1997; Wilson et al., 1997; Fairley et al., 2002; Goto et al., 2003; Lin et al., 2004; Wake et al., 2005; Loh et al., 2008; Lu et al., 2009). The main advantage of any statistical study of this nature is that it requires a minimal set of a-priori assumptions regarding the properties of the studied objects. Its main disadvantage is that no detailed information can be extracted regarding any single satellite.
Throughout the paper we adopt the following cosmological parameters: , and km s-1 Mpc-1.
2. Data
2.1. Sample selection
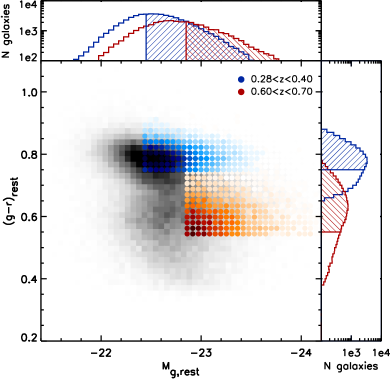
We selected galaxy images for this study from the seventh data release of the Sloan Digital Sky Survey (see York et al., 2000; Fukugita et al., 1996; Gunn et al., 1998; Smith et al., 2002; Pier et al., 2003; Gunn et al., 2006; Abazajian et al., 2009) and from the interim catalog of the SDSS-III Baryon Oscillation Spectroscopic Survey111As of January 20th 2011 (BOSS, Schlegel et al., 2009; Eisenstein et al., 2011). This version of the catalog covers an area of roughly 1620 deg2 on the sky (compared to 8200 deg2 in SDSS DR7) and it consists of more than 150,000 LRG candidates with spectra at . All selected objects were initially identified by the SDSS pipeline as luminous red galaxies from their central surface brightness and location on a rotated color-color diagram (for full details see Eisenstein et al., 2001, 2011). Roughly 90% of all LRGs are central halo galaxies, thought to be residing in groups with a typical halo mass of a few times (Wake et al., 2008; Zheng et al., 2009; Reid & Spergel, 2009). The full data set consists of galaxies in two redshift bins as determined spectroscopically in the surveys. The low redshift sample consists of SDSS LRGs in the redshift range 0.280.4. These are the reddest, most luminous galaxies in the nearby universe and they occupy the high mass end of the stellar mass spectrum between and a few times . The high redshift sample is comprised of BOSS “CMASS” galaxies, a selection aimed at finding objects at an approximately constant stellar mass (Eisenstein et al., 2011; White et al., 2011). The color distribution of these galaxies is broader and this sample includes objects that are bluer than the low redshift LRGs. We address this in the following subsection.
2.2. Number density and color matching
We constructed matched samples at and by requiring that galaxies in each redshift bin have the same number density and a similar color distribution (with an offset due to passive evolution). This selection allows us to follow the mass evolution of massive galaxies, assuming that the overall number density of these objects does not change significantly in the studied redshift range. The benefits of a number-density limited, rather than luminosity- or mass-limited, sample have been discussed by e.g., van Dokkum et al. (2010).
We started by K-correcting the SDSS extinction-corrected model magnitudes in the and bands and the BOSS magnitudes in the and bands to following the filter transformation technique given by van Dokkum & Franx (1996). This method finds the best-fit linear combination of galaxy templates to an observed color and calculates the transformation coefficients for a given rest-frame filter. We used the peak of the observed color distribution as input ( and for the low and high samples, respectively) and derived rest-frame magnitudes and colors for all galaxies in the two samples. The imaging bands used in this study were selected to minimize the necessary K-corrections as the band at and the band at roughly overlap with the restframe band. To test this, we compared the difference in derived K-correction values between the two redshifts with stellar population synthesis models (Bruzual & Charlot, 2003; Maraston et al., 2009) and found agreement to within a few hundredths of a magnitude.
Our initial selection included objects from the high-redshift sample that are brighter than mag. This selection minimizes the effects of incompleteness due to the BOSS detection limit as it excludes galaxies close to or fainter than the turnover point in . We then excluded the faintest galaxies from the low redshift sample until their overall number densities matched that of the high- sample to within 1%. Lastly, we fit a Gaussian curve to the color distribution of the resulting samples, redward of the distribution peak, and excluded all the galaxies that are bluer than the peak by more than 1. Put differently, we selected an identical fraction of the reddest galaxies from each sample, assuming a normal distribution for both. However, since this color selection slightly changed the overall number density of the high redshift sample, we iterated over the last two steps until both criteria were satisfied, resulting in a matched galaxy number density of Mpc-3.
The initial selection criteria of the BOSS “CMASS” sources aim at finding galaxies at a roughly constant mass. This implies that the BOSS pipeline selects galaxies with a wider range of properties compared to the SDSS pipeline, including galaxies of late type morphology (e.g., White et al., 2011; Masters et al., 2011). The color and luminosity that we apply on both BOSS and SDSS data sets minimize the contribution of such sources to our samples as the final selection only includes the reddest, most luminous galaxies at each redshift. We therefore refer to these galaxies as “LRGs” throughout the paper. We note that some contamination of dusty galaxies may still exist in the BOSS data set as simple color cuts likely do not completely exclude them (e.g., Bell et al., 2004; Labbé et al., 2003).
The color-magnitude distribution of the initial data sets can be seen in Figure 1 along with the selection cutoff values and resulting samples. The difference in cutoff restframe between the two redshift samples is less than 0.4 magnitudes and roughly corresponds to passive luminosity evolution. The final data set includes 12,813 galaxies at and 29,477 galaxies at .
3. Statistical derivation of the LRG satellite luminosity function
3.1. Region selection and object photometry
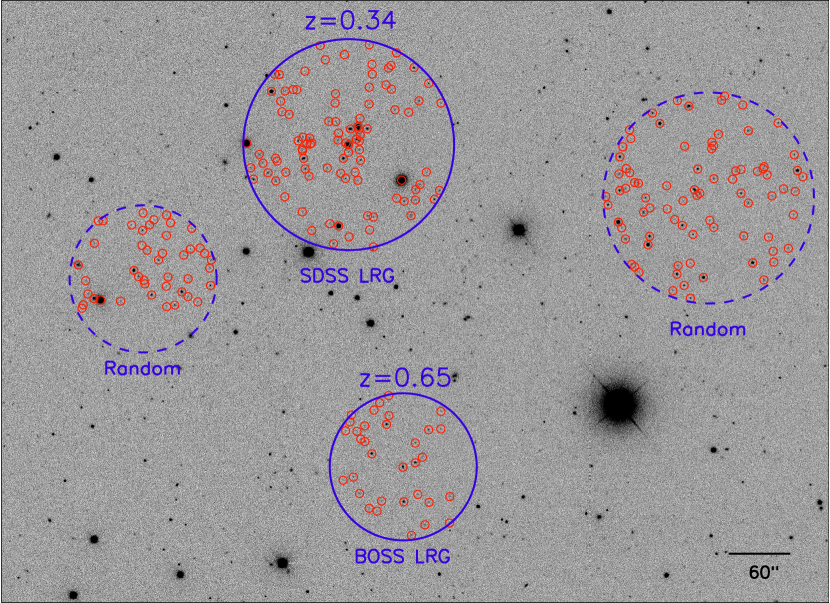
Each imaging field in SDSS is in angular size (see Stoughton et al., 2002 for a description of the SDSS image processing), corresponding to a physical scale of roughly 5.64.1 Mpc at and 3.92.8 Mpc at . We acquired and band images from the survey archives for the selected galaxies in the low and high redshift samples, respectively, and extracted source photometry using SExtractor (Bertin & Arnouts, 1996) in a 1000 kpc annulus around the LRGs ( at and at ). We utilized a low detection threshold of 1 above the background, as determined by SExtractor, resulting in a large number of spurious detections of nise peaks in the images. However, since the random field catalogs contain the same false detections, this contribution to the luminosity function will be taken into account. We then calibrated the luminosity of each object using the K-correction value and luminosity distance of its adjacent LRG, assuming that all sources in any given field are at the same redshift. Although this assumption is grossly incorrect for any object that is not physically associated with the LRG itself, the large numbers of studied sources around the LRGs and in random fields ensure that each luminosity bin is well sampled in both data sets. We discuss this further in Section 3.2. Finally, we divided the resulting all-inclusive catalogs into luminosity bins of size 0.01 dex, and summed the number of objects in each bin. A typical region selection at each redshift range can be seen in Figure 2.
3.2. Background and foreground subtraction
Statistical subtraction of background and foreground sources in wide-field surveys can be performed locally or globally, with both methods providing successful and not inconsistent results (some discussion on the different approaches can be found in Goto et al., 2003 and in Loh et al., 2008). We chose to use a local estimate of this contribution using source extraction and photometry in randomly-selected regions taken from the same SDSS fields in which the selected LRGs reside. This method better samples the large scale structure in which massive LRGs typically reside and therefore attempts to account for resulting line-of-sight overdensities.
For each selected LRG we performed object photometry in a randomly positioned circular region, using identical thresholds as those used for the LRG fields (Section 3.1). The large number of LRGs is well suited to this technique as it ensures sufficient sampling of foreground and background objects. We allowed the random aperture centers to lie anywhere in the images such that the both LRG and random fields suffer from identical edge effects. This ensures that the cumulative size of all random apertures is the same as the total LRG field size.
We then incorporated the measurements from all fields and binned them similarly to the LRG centered regions to derive a cumulative source light distribution of foreground and background sources. We repeated the last two steps until we had 10 random iterations for each LRG that did not overlap with the LRG aperture itself. We also allowed the random apertures to overlap with each other by no more than 30% of the apertue area to ensure that the errors are not significantly correlated.
3.3. Photometric errors
Photometric measurements of the faintest detected objects may suffer from significant errors due to statistical variation in the background and other residual systematic biases (e.g., flat fielding issues, incorrect sky level determination). In order to estimate these errors we followed the technique suggested by Labbé et al. (2003) and utilized circular apertures to measure the total flux distribution in empty regions in both data sets. First we constructed a catalog of all the elliptical apertures that had been used by SExtractor to measure photometry from the images. We then calculated the average area of these apertures in each luminosity bin and produced a circular aperture of equivalent area. Next we masked out all the objects in each imaging field and measured the total flux in every aperture when placed at a random position in the field. We repeated the last step 1000 times and calculated the standard deviation of the resultant measurement distribution for each luminosity bin.
3.4. Luminosity functions
The galaxy luminosity functions that were derived in Section 3.1 are dominated by light from background and foreground sources in the LRG fields. In order to properly remove this contamination we averaged the random aperture measurements that were carried out in Section 3.2, in each luminosity bin, and subtracted them from the LRG measurements. We then normalized the resultant galaxy luminosity function by the total number of groups and clusters, assuming that every studied LRG is the central galaxy in its environment. A potential concern is that we may preferentially miss LRGs that are paired with other LRGs due to incompleteness of the SDSS redshift catalogs resulting from fiber collisions. We note that such pairs are rare, making up only a few percent of the sample at the selected luminosity range, after correcting for fiber collisions (see e.g. Masjedi et al., 2006; van den Bosch et al., 2008; Wake et al., 2008). Therefore, the effect on the selection is small. Importantly, all LRGs that do not have a redshift measurement are included in our analysis as they are in the photometric catalogs that we used to construct the luminosity functions.
In addition, we calculated the difference between SDSS model and SExtractor AUTO magnitudes and derived a correction factor for the latter. We applied this factor to the satellite functions assuming that SDSS model magnitudes better assess the total flux from satellite galaxies. We further discuss this in the appendix. Finally, we applied the same filter transformations discussed in Section 2.2 to the luminosity functions and normalized the resultant measurements to solar luminosities using (in the AB system, Blanton & Roweis, 2007).
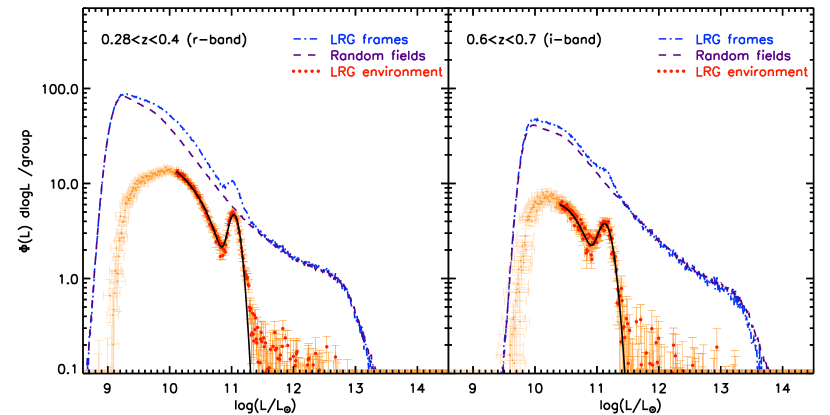
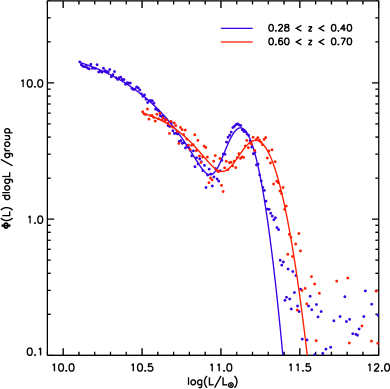
The calibrated LRG satellite luminosity functions are shown in Figure 3. The blue dot-dashed and the purple dashed lines show the observed luminosity functions of the LRG and random fields, respectively. The red data points show the difference between the two curves which is henceforth assumed to represent the luminosity function of galaxies associated with LRG environments. These luminosity functions also include the central LRGs themselves, for which photometry was extracted in an identical way to all other sources in the field. The vertical error bars represent 1 of the distribution of random measurements in each luminosity bin (Section 3.2) and the horizontal error bars show the standard deviation of 1000 empty aperture measurements (Section 3.3).
The luminosity functions are markedly different from a Schechter function and show a clear peak at the luminosity of the LRG at both redshifts. This peak is even visible in the observed luminosity function (the blue dot-dashed curve which is not corrected for foreground and background objects). The fact that a large fraction of the luminosity in a typical LRG environment is locked in the central galaxy itself is the key result of this study. In the following sections we will quantify the luminosity functions and the total luminosity in the LRG and in its satellite galaxies.
4. Quantifying the luminosity function of LRG environments
4.1. Functional fits
The derived luminosity functions that are presented in Figure 3 are very different from a Schechter distribution, in agreement with halo-based studies of nearby and distant environments (e.g., Yang et al., 2008; Brown et al., 2008). Following Yang et al. (2008) we instead quantified the galaxy luminosity distributions using a two-component fit:
| (1) |
where and are the distributions of LRG and satellite luminosities. For the LRG luminosities we assumed a log-normal distribution,
| (2) |
where the number of LRGs per group or cluster is set to 1 and the distribution width and peak center are left as free parameters. For the satellite luminosity distribution we used a Schechter (1976) function:
| (3) |
Attempts at fitting the satellite luminosity distribution with a modified Schechter function, as suggested by Yang et al. (2008), resulted in worse agreement with the data. We fit all five free parameters (, , , and ) simultaneously using the non-linear least squares curve fitting program MPFIT (Markwardt, 2009). Since our data quickly become incomplete below some flux threshold we restricted the functional fits to luminosities higher than the turnover luminosity of and in the low and high redshift bins. The best-fit parameters are given in Table LABEL:tab:fits and the resulting luminosity function curves are shown in Figure 3 as black solid lines. The slope of the power-law part of the Schechter function, represented by the parameter , is not well constrained and is sensitive to the adopted value of . When varying from 10.1 to 10.6 for the low-redshift sample the slope changes by 0.4 dex. To better estimate the faint end of the Schechter function we repeated the same model fitting for LRGs in Stripe 82.
| SDSS | BOSS | Stripe 82 | |
|---|---|---|---|
| (fixed) | 1.00 | 1.00 | 1.00 |
| 0.09 | 0.12 | 0.09 (fixed) | |
| 11.04 | 11.14 | 11.00 | |
| 18.6 | 15.3 | 24.3 | |
| 10.5 | 10.5 | 10.4 | |
| -1.110.47222Errors were calculated by varying the analysis threshold by 0.5 dex. | -0.461.15 | -0.950.18 |
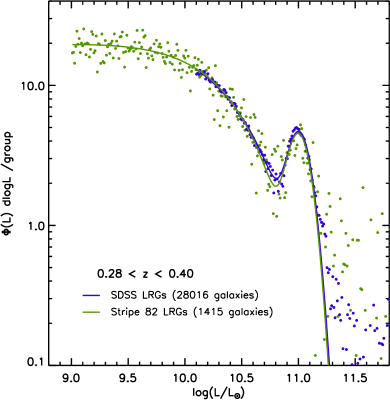
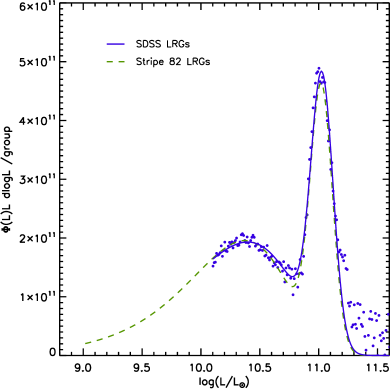
Stripe 82 is a narrow region in the sky that was imaged multiple times as part of SDSS under a variety of observing conditions (e.g., Abazajian et al., 2009). Individual images of the same fields were summed to create deep co-added frames of this region, each made of to exposures (with a median of exposures). We repeated the analysis described in Section 3 in fields containing all 1415 Stripe 82 LRGs at (redshifts were measured as part of the main SDSS survey). For the functional fits we kept the parameter fixed since the relatively small number of LRGs in Stripe 82 implies that the gap region of the luminosity function is not well constrained. To calibrate the photometry we matched the resulting luminosity of the LRGs themselves to that of the same LRGs in the SDSS frames. Figure 4 shows a comparison between the luminosity function that was derived from individual SDSS frames (blue points) and the one derived from the deep Stripe 82 stacks (green points). As expected, there is good agreement between the two curves down to the SDSS threshold luminosity of . The faint-end slope of the Schechter function is better constrained from the deep Stripe 82 data and it has a value of .
4.2. Measurements of the gap width
The most outstanding feature in both galaxy luminosity functions that are presented in Figure 3 is a gap at the bright end between the LRG luminosity and that of the most luminous satellites. Similar luminosity gaps in nearby () massive groups and clusters are typically interpreted as a proxy of the magnitude difference between the first and second most luminous group members (e.g., Ponman et al., 1994; Yang et al., 2008). However, the statistical nature of this study and the methods used to derive the galaxy luminosity functions imply that we cannot measure such a magnitude difference for any given group or cluster as membership is not assigned to individual sources. Instead, we treat the gap in the luminosity function as a probability distribution for finding satellites at a given relative luminosity compared to the central. Thus, we quantify the magnitude gap by finding the luminosity above which LRG groups and clusters have on average exactly one satellite. The ratio between this luminosity and the peak of LRG luminosities is then roughly equivalent to the magnitude gap between the two most luminous members of the environment. Put differently, we calculate the luminosity above which the integrand over the satellite luminosity distribution equals unity:
| (4) |
This statistic implies a gap width of dex, or roughly 1.3 magnitudes, at both redshifts. An alternative measure of the gap width is the difference between and which is also consistent between the two redshift samples and has a value of roughly 0.5 dex. We note, however, that this measurement is less robust as the parameter is degenerate with the other parameters of the Schechter function.
5. Discussion
5.1. Evidence for an early formation of LRG environments
Measurements of the magnitude difference between the first and second most luminous group members have typically been interpreted as a gauge of the group age (e.g., Sandage & Hardy, 1973; Tremaine & Richstone, 1977; Schneider et al., 1983; Barnes, 1989; Ponman et al., 1994; Khosroshahi et al., 2004; D’Onghia et al., 2005; Milosavljević et al., 2006; van den Bosch et al., 2007; Yang et al., 2008; Dariush et al., 2010). In this model the most massive members merge quickly (within a few tenths of a Hubble time) and leave behind only significantly less massive satellites. Masjedi et al. (2008) showed supporting evidence for this model by deriving the small scale correlation function of SDSS LRGs and estimating that these central galaxies can only grow by up to a few percent via merging with their satellites. The galaxy luminosity functions presented in figure 3 further support this and suggest that LRGs typically live in groups where the central galaxy is significantly more massive than its most luminous satellite.
In addition, Figure 5 shows that the depth of the luminosity gap at , as well as its width, are generally similar to the gap properties at . This is consistent with no significant evolution in the gap properties between the two redshift bins and therefore no significant merger activity between six and four billion years ago. Moreover, the existence of the gap at is consistent with the scenario in which the gap (and group) formed early.
We note that the ratio between the two LRG peaks is consistent with passive luminosity evolution as described by the model derived by Blanton et al. (2003) for the same galaxies in SDSS and is in agreement with Tojeiro & Percival (2010).
5.2. Mergers and the mild mass evolution of LRGs
The luminosity functions derived in Sections 3 and 4 can be used to directly characterize the reservoir of satellite galaxies with which the central LRG can merge. We utilize these luminosity distributions to calculate the mass of satellite galaxies which contribute the most to the LRG stellar mass growth. In Figure 6 we present the distribution of total galaxy luminosities per log luminosity bin for the low-redshift sample. From this relation we can measure the ratio between the peak of LRG and satellite galaxy luminosity distributions. This ratio has a value 4:1 and it suggests that the satellite mass distribution peaks at 25% of the LRG mass. This is consistent with the derivations of gap width (Section 4.2) which imply that the most luminous LRG satellite is on average more than three times fainter than the LRG itself. This result supports a scenario in which major mergers within LRG environments are improbable and that any mass growth takes place through mergers with mass ratios of 1:4 or lower (e.g., Masjedi et al., 2008; Kaviraj et al., 2009).
In addition, by separately integrating the total LRG and satellite luminosity distributions of Figure 6 we calculate that roughly 35% of the mass in LRG environments is locked in the central galaxy itself. Although the potential for stellar mass growth via mergers within groups or clusters is not insignificant, significant evolution, when restricted to growth through minor mergers, may in fact require many Gyrs. For comparison, in massive clusters, where the galaxy luminosity distribution is better described by a Schechter function, the central galaxy contains as little as 15% or less of the total stellar mass in the environment. In such environments the central galaxy can grow quickly in mass through major mergers with its most massive satellites.
We note that this estimate is an upper limit for the maximum mass growth through mergers within the LRG group. Since the colors of satellite galaxies are expected to be bluer than the those of central LRGs, a more accurate mass calibration will likely shift the satellite mass function to lower masses and increase the luminosity gap width. Proper estimates of the color of satellites in LRG group are therefore important for this analysis but they are unfortunately beyond the scope of this study.
5.3. Uncertainties in mass estimates
We note that the luminosity, and therefore mass, calibrations of the luminosity functions that are presented in Figures 3 and 5 are only as valid as some of the assumptions that were made for the functional fits. For example, in order to calibrate the luminosity functions we assumed that LRG satellites typically have the same colors as the central galaxy. If the satellites are instead bluer than the LRG, their calibrated luminosities would be fainter, implying lower total stellar mass. In that case the mass function of LRG environments would exhibit an even wider gap between the two most massive members. Although group satellites have indeed been observed to be bluer than a typical LRG, most of them are close in color to their central galaxy (e.g., Yang et al., 2008; Balogh et al., 2009; Weinmann et al., 2009).
An additional error may arise from the magnitude correction that was derived in Section 3.4 and is presented in Figure 4. This estimate relies on the assumption that the magnitude difference between the two photometric measurements remains constant even at fainter brightnesses. An increase in this correction factor at fainter magnitudes may imply that we underestimate the luminosity of satellite galaxies and therefore potentially overestimate the width of the luminosity gap.
Finally, it is possible that sources that are at a small angular distance from the LRGs are missed from our catalogs due to imperfect source separation by SExtractor. Although this could also potentially lead to an overestimate of the gap width it is more likely that sources that are missed are faint and do not contribute much to the luminosity functions in the gap region.
5.4. The Schechter function and luminosity gap
Gaps in the luminosity functions of groups and clusters are often observed in studies of the environments of luminous galaxies (e.g., Yang et al., 2008; Brown et al., 2008). These gaps may be created during the initial formation of massive centrals by mergers of the most massive members in an environment. Such (major) mergers can increase the luminosity of the central galaxy while at the same time effectively decrease the luminosity of the most massive satellite. For example, a sparse group hosting two galaxies would not be selected for this study and it would also not have a gap in its luminosity function. However, some time after the two galaxies merge the remnant galaxy will likely be luminous enough to be classified as an LRG and a gap in the luminosity function will appear. In this scenario, luminous massive galaxies in sparse groups are not likely to have any remaining massive companions in their environments. It therefore follows that group LRGs preferentially live in environments where a luminosity gap can be observed even if the underlying luminosity distribution does not exhibit a gap.
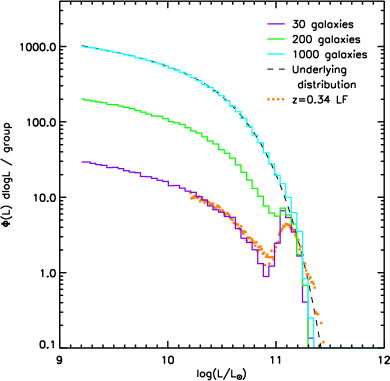
Here we test whether the observed gap can be a result of the selection of the LRGs, combined with sparse sampling of an underlying Schechter function. We start by assuming that this distribution is the same in all environments, regardless of other properties, and that it can be well described by a Schechter function. We then randomly sample the assumed Schechter distribution times, where each reading represents a galaxy observation and is the total number of galaxies in a “group”. We record the resultant galaxy luminosities and derive luminosity functions for all groups. Finally, we repeat the last two steps until at least 1000 groups (or clusters) of each size have one or more luminous galaxies with and exclude all other groups. Figure 7 shows the average luminosity function of the 1000 random samples for group sizes of , 200 and 1000 galaxies. The underlying distribution from which galaxies were sampled is also plotted (black dashed line). The luminosity gap can be seen in the average distribution of groups with 30 and 200 galaxies, but not in the richest clusters.
It is therefore evident that the gap in the luminosity function may indeed result from the criteria used to select our sample. The steep bright end of the Schechter function implies that the probability of having multiple luminous galaxies in one environment decreases with the number of physically associated members. It then follows that LRG environments are not necessarily unique in their underlying luminosity distribution but rather in that they host a luminous galaxy. Furthermore, this may suggest that groups that do not host a bright galaxy can easily be missed by group finding studies as all of the member galaxies may be undetected. We note that this result is not restricted to a Schechter distribution and that any underlying distribution which is much steeper at its bright end may reproduce a similar luminosity gap.
Consequently, if environments are selected by their total halo mass rather than the luminosity of their most massive member, they may exhibit a much shallower gap or even none at all. When assuming a universal underlying Schechter distribution for all halos of a given mass, groups hosting a massive galaxy become rare and their contribution to the average luminosity function diminishes. In fact, in our simulations such groups account for only 3% of the total environments with the same number of satellites. We note, however, that these simulations are over-simplistic and that they do not represent the true global distribution of halo masses. Moreover, all groups hosting the same number of galaxies do not have the same total mass, suggesting that this value may be a gross underestimate of the fraction of groups hosting an LRG. Nevertheless, any selection which is based on the central galaxy luminosity would likely underestimate the scatter in the masses of centrals in similar halos. Such a scatter was observed by Yang et al. (2008), who noticed that the distribution of central galaxy luminosities has a constant width of roughly 0.15 dex for . Moreover, some scatter is required to provide good halo model fits to the clustering and space density of LRGs (Wake et al., 2008; Zheng et al., 2009; White et al., 2011).
6. Summary and conclusions
In this paper we utilized imaging data of more than 40,000 SDSS LRGs in the redshift ranges and to study the luminosity function of LRG satellite galaxies. We extracted source photometry in 1000 kpc apertures around the LRGs themselves, as well as in randomly selected fields, to characterize and remove background and foreground contamination in a statistical way. The large size of SDSS makes it an ideal data set for this study as it reduces statistical noise and allows for excellent determination of the variation between fields. The addition of BOSS spectra to the imaging data allowed us to study the galaxy luminosity function around LRGs out to for the first time.
We successfully determined the galaxy luminosity function of LRG satellites down to two magnitudes fainter than the LRG brightness at despite the relatively shallow depth of SDSS. We did so without acquiring additional spectra to confirm member candidates and by assuming that the properties of LRG satellites are correlated with the properties of the LRGs themselves. This technique can be utilized to study the environment around any type of galaxy in a well-defined sample and in a sufficiently large data set.
We found that the luminosity function of LRG environments is markedly different from a Schechter function and that LRGs are typically magnitudes brighter than the next brightest galaxy in their environment. We showed that most of the group mass that is not in the central itself is concentrated in satellite galaxies that are roughly four times less luminous than the LRG. This implies that major mergers within LRG groups and clusters are improbable and that any stellar mass growth likely occurs through minor mergers. We also demonstrated that the luminosity function gap is already in place at and estimated that the total mass in LRGs accounts for roughly 35% of the total stellar mass in their environment. The existence of the gap at this redshift supports that LRG environments typically formed early and were already in place 6 Gyrs in the past.
Lastly, we performed simple assembly simulations of galaxy groups and clusters and demonstrated that the selection criteria used in this study may have preferentially picked environments that have a gap in their luminosity function. In this case the luminosity gap results from the properties of the underlying Schechter function that was used in the simulations and from the requirement to have a luminous galaxy in every selected environment. This further implies that the LRG luminosity function may not be inherently unique and that a true halo mass selected sample may exhibit a large scatter in the properties of its most massive galaxies.
References
- Abazajian et al. (2009) Abazajian, K. N., et al. 2009, The Astrophysical Journal Supplement Series, 182, 543
- Balogh et al. (2004) Balogh, M. L., Baldry, I. K., Nichol, R., Miller, C., Bower, R., & Glazebrook, K. 2004, The Astrophysical Journal, 615, L101
- Balogh et al. (2009) Balogh, M. L., et al. 2009, Monthly Notices of the Royal Astronomical Society, 398, 754
- Barnes (1989) Barnes, J. E. 1989, Nature, 338, 123
- Bell et al. (2006) Bell, E. F., Phleps, S., Somerville, R. S., Wolf, C., Borch, A., & Meisenheimer, K. 2006, The Astrophysical Journal, 652, 270
- Bell et al. (2004) Bell, E. F., et al. 2004, The Astrophysical Journal Letters, 600, L11
- Bertin & Arnouts (1996) Bertin, E., & Arnouts, S. 1996, Astronomy and Astrophysics Supplement Series, 117, 393
- Bezanson et al. (2009) Bezanson, R., van Dokkum, P. G., Tal, T., Marchesini, D., Kriek, M., Franx, M., & Coppi, P. 2009, Astrophysical Journal, 697, 1290
- Blanton & Roweis (2007) Blanton, M. R., & Roweis, S. 2007, The Astronomical Journal, 133, 734
- Blanton et al. (2003) Blanton, M. R., et al. 2003, The Astrophysical Journal, 592, 819
- Bolzonella et al. (2010) Bolzonella, M., et al. 2010, Astronomy and Astrophysics, 524, 76
- Bournaud et al. (2007) Bournaud, F., Jog, C. J., & Combes, F. 2007, Astronomy and Astrophysics, 476, 1179
- Boylan-Kolchin et al. (2006) Boylan-Kolchin, M., Ma, C., & Quataert, E. 2006, Monthly Notices of the Royal Astronomical Society, 369, 1081
- Brown et al. (2008) Brown, M. J. I., et al. 2008, The Astrophysical Journal, 682, 937
- Bruzual & Charlot (2003) Bruzual, G., & Charlot, S. 2003, Monthly Notices of the Royal Astronomical Society, 344, 1000
- Bundy et al. (2009) Bundy, K., Fukugita, M., Ellis, R. S., Targett, T. A., Belli, S., & Kodama, T. 2009, The Astrophysical Journal, 697, 1369
- Bundy et al. (2006) Bundy, K., et al. 2006, The Astrophysical Journal, 651, 120
- Chiboucas et al. (2010) Chiboucas, K., Tully, R. B., Marzke, R. O., Trentham, N., Ferguson, H. C., Hammer, D., Carter, D., & Khosroshahi, H. 2010, The Astrophysical Journal, 723, 251
- Christlein & Zabludoff (2003) Christlein, D., & Zabludoff, A. I. 2003, The Astrophysical Journal, 591, 764
- Coil et al. (2006) Coil, A. L., et al. 2006, The Astrophysical Journal, 638, 668
- Dariush et al. (2010) Dariush, A. A., Raychaudhury, S., Ponman, T. J., Khosroshahi, H. G., Benson, A. J., Bower, R. G., & Pearce, F. 2010, Monthly Notices of the Royal Astronomical Society, 405, 1873
- D’Onghia et al. (2005) D’Onghia, E., Sommer-Larsen, J., Romeo, A. D., Burkert, A., Pedersen, K., Portinari, L., & Rasmussen, J. 2005, The Astrophysical Journal, 630, L109
- Driver et al. (1994) Driver, S. P., Phillipps, S., Davies, J. I., Morgan, I., & Disney, M. J. 1994, Monthly Notices of the Royal Astronomical Society, 268, 393
- Eisenstein et al. (2001) Eisenstein, D. J., et al. 2001, Astronomical Journal, 122, 2267
- Eisenstein et al. (2011) —. 2011, SDSS-III: Massive Spectroscopic Surveys of the Distant Universe, the Milky Way Galaxy, and Extra-Solar Planetary Systems
- Faber (1973) Faber, S. M. 1973, The Astrophysical Journal, 179, 731
- Fairley et al. (2002) Fairley, B. W., Jones, L. R., Wake, D. A., Collins, C. A., Burke, D. J., Nichol, R. C., & Romer, A. K. 2002, Monthly Notices of the Royal Astronomical Society, 330, 755
- Fukugita et al. (1996) Fukugita, M., Ichikawa, T., Gunn, J. E., Doi, M., Shimasaku, K., & Schneider, D. P. 1996, The Astronomical Journal, 111, 1748
- Gaidos (1997) Gaidos, E. J. 1997, The Astronomical Journal, 113, 117
- Geller & Huchra (1983) Geller, M. J., & Huchra, J. P. 1983, The Astrophysical Journal Supplement Series, 52, 61
- Goto et al. (2003) Goto, T., et al. 2003, Publications of the Astronomical Society of Japan, 55, 739
- Gunn et al. (1998) Gunn, J. E., et al. 1998, The Astronomical Journal, 116, 3040
- Gunn et al. (2006) —. 2006, The Astronomical Journal, 131, 2332
- Hill et al. (2011) Hill, D. T., et al. 2011, Monthly Notices of the Royal Astronomical Society, 412, 765
- Hogg et al. (2004) Hogg, D. W., et al. 2004, The Astrophysical Journal, 601, L29
- Huchra & Geller (1982) Huchra, J. P., & Geller, M. J. 1982, The Astrophysical Journal, 257, 423
- Jørgensen (1999) Jørgensen, I. 1999, Monthly Notices of the Royal Astronomical Society, 306, 607
- Kauffmann et al. (2003) Kauffmann, G., et al. 2003, Monthly Notices of the Royal Astronomical Society, 341, 33
- Kaviraj et al. (2009) Kaviraj, S., Peirani, S., Khochfar, S., Silk, J., & Kay, S. 2009, Monthly Notices of the Royal Astronomical Society, 394, 1713
- Kaviraj et al. (2008) Kaviraj, S., et al. 2008, Monthly Notices of the Royal Astronomical Society, 388, 67
- Khosroshahi et al. (2004) Khosroshahi, H. G., Jones, L. R., & Ponman, T. J. 2004, Monthly Notices of the Royal Astronomical Society, 349, 1240
- Kormendy & Djorgovski (1989) Kormendy, J., & Djorgovski, S. 1989, Annual Review of Astronomy and Astrophysics, 27, 235
- Labbé et al. (2003) Labbé, I., et al. 2003, The Astronomical Journal, 125, 1107
- Lin et al. (2004) Lin, Y., Mohr, J. J., & Stanford, S. A. 2004, The Astrophysical Journal, 610, 745
- Lobo et al. (1997) Lobo, C., Biviano, A., Durret, F., Gerbal, D., Le Fevre, O., Mazure, A., & Slezak, E. 1997, Astronomy and Astrophysics, 317, 385
- Loh et al. (2008) Loh, Y., Ellingson, E., Yee, H. K. C., Gilbank, D. G., Gladders, M. D., & Barrientos, L. F. 2008, The Astrophysical Journal, 680, 214
- Lu et al. (2009) Lu, T., Gilbank, D. G., Balogh, M. L., & Bognat, A. 2009, Monthly Notices of the Royal Astronomical Society, 399, 1858
- Lumsden et al. (1997) Lumsden, S. L., Collins, C. A., Nichol, R. C., Eke, V. R., & Guzzo, L. 1997, Monthly Notices of the Royal Astronomical Society, 290, 119
- Maraston et al. (2009) Maraston, C., Strömbäck, G., Thomas, D., Wake, D. A., & Nichol, R. C. 2009, Monthly Notices of the Royal Astronomical Society, 394, L107
- Markwardt (2009) Markwardt, C. B. 2009, in Astronomical Data Analysis Software and Systems XVIII, Vol. 411, 251
- Martini et al. (2006) Martini, P., Kelson, D. D., Kim, E., Mulchaey, J. S., & Athey, A. A. 2006, The Astrophysical Journal, 644, 116
- Masjedi et al. (2008) Masjedi, M., Hogg, D. W., & Blanton, M. R. 2008, The Astrophysical Journal, 679, 260
- Masjedi et al. (2006) Masjedi, M., et al. 2006, The Astrophysical Journal, 644, 54
- Masters et al. (2011) Masters, K. L., et al. 2011, Monthly Notices of the Royal Astronomical Society, no
- McIntosh et al. (2008) McIntosh, D. H., Guo, Y., Hertzberg, J., Katz, N., Mo, H. J., van den Bosch, F. C., & Yang, X. 2008, Monthly Notices of the Royal Astronomical Society, 388, 1537
- Milosavljević et al. (2006) Milosavljević, M., Miller, C. J., Furlanetto, S. R., & Cooray, A. 2006, The Astrophysical Journal, 637, L9
- Muzzin et al. (2009) Muzzin, A., et al. 2009, The Astrophysical Journal, 698, 1934
- Naab et al. (2009) Naab, T., Johansson, P. H., & Ostriker, J. P. 2009, The Astrophysical Journal, 699, L178
- Naab et al. (2007) Naab, T., Johansson, P. H., Ostriker, J. P., & Efstathiou, G. 2007, Astrophysical Journal, 658, 710
- Naab et al. (2006) Naab, T., Khochfar, S., & Burkert, A. 2006, The Astrophysical Journal, 636, L81
- Patton et al. (2002) Patton, D. R., et al. 2002, The Astrophysical Journal, 565, 208
- Peletier (1989) Peletier, R. F. 1989, Elliptical Galaxies - Structure and Stellar Content, http://adsabs.harvard.edu/abs/1989PhDT…….149P
- Pier et al. (2003) Pier, J. R., Munn, J. A., Hindsley, R. B., Hennessy, G. S., Kent, S. M., Lupton, R. H., & Ivezić, . 2003, The Astronomical Journal, 125, 1559
- Ponman et al. (1994) Ponman, T. J., Allan, D. J., Jones, L. R., Merrifield, M., McHardy, I. M., Lehto, H. J., & Luppino, G. A. 1994, Nature, 369, 462
- Ramella et al. (2000) Ramella, M., et al. 2000, Astronomy and Astrophysics, 360, 861
- Ramos Almeida et al. (2011) Ramos Almeida, C., Tadhunter, C. N., Inskip, K. J., Morganti, R., Holt, J., & Dicken, D. 2011, Monthly Notices of the Royal Astronomical Society, 410, 1550
- Reid & Spergel (2009) Reid, B. A., & Spergel, D. N. 2009, The Astrophysical Journal, 698, 143
- Sandage & Hardy (1973) Sandage, A., & Hardy, E. 1973, The Astrophysical Journal, 183, 743
- Schechter (1976) Schechter, P. 1976, The Astrophysical Journal, 203, 297
- Schlegel et al. (2009) Schlegel, D., White, M., & Eisenstein, D. 2009, in astro2010: The Astronomy and Astrophysics Decadal Survey, Vol. 2010, 314
- Schneider et al. (1983) Schneider, D. P., Gunn, J. E., & Hoessel, J. G. 1983, The Astrophysical Journal, 268, 476
- Schweizer & Seitzer (1992) Schweizer, F., & Seitzer, P. 1992, Astronomical Journal, 104, 1039
- Smith et al. (2002) Smith, J. A., et al. 2002, The Astronomical Journal, 123, 2121
- Stoughton et al. (2002) Stoughton, C., et al. 2002, The Astronomical Journal, 123, 485
- Tal & van Dokkum (2011) Tal, T., & van Dokkum, P. G. 2011, The Astrophysical Journal, 731, 89
- Tal et al. (2009) Tal, T., van Dokkum, P. G., Nelan, J., & Bezanson, R. 2009, The Astronomical Journal, 138, 1417
- Tanaka et al. (2010) Tanaka, M., Finoguenov, A., & Ueda, Y. 2010, The Astrophysical Journal, 716, L152
- Taylor et al. (2011) Taylor, E. N., et al. 2011, Galaxy And Mass Assembly: Stellar Mass Estimates
- Thomas et al. (2005) Thomas, D., Maraston, C., Bender, R., & Mendes de Oliveira, C. 2005, The Astrophysical Journal, 621, 673
- Tojeiro & Percival (2010) Tojeiro, R., & Percival, W. J. 2010, Monthly Notices of the Royal Astronomical Society, 405, 2534
- Tojeiro et al. (2011) Tojeiro, R., Percival, W. J., Heavens, A. F., & Jimenez, R. 2011, Monthly Notices of the Royal Astronomical Society, 413, 434
- Trager et al. (2000) Trager, S. C., Faber, S. M., Worthey, G., & González, J. J. 2000, The Astronomical Journal, 119, 1645
- Tran et al. (2005) Tran, K. H., van Dokkum, P., Franx, M., Illingworth, G. D., Kelson, D. D., & Schreiber, N. M. F. 2005, The Astrophysical Journal, 627, L25
- Tremaine & Richstone (1977) Tremaine, S. D., & Richstone, D. O. 1977, The Astrophysical Journal, 212, 311
- Valotto et al. (1997) Valotto, C. A., Nicotra, M. A., Muriel, H., & Lambas, D. G. 1997, The Astrophysical Journal, 479, 90
- van den Bosch et al. (2008) van den Bosch, F. C., Aquino, D., Yang, X., Mo, H. J., Pasquali, A., McIntosh, D. H., Weinmann, S. M., & Kang, X. 2008, Monthly Notices of the Royal Astronomical Society, 387, 79
- van den Bosch et al. (2007) van den Bosch, F. C., et al. 2007, Monthly Notices of the Royal Astronomical Society, 376, 841
- van Dokkum (2005) van Dokkum, P. G. 2005, The Astronomical Journal, 130, 2647
- van Dokkum & Franx (1996) van Dokkum, P. G., & Franx, M. 1996, Monthly Notices of the Royal Astronomical Society, 281, 985
- van Dokkum et al. (1999) van Dokkum, P. G., Franx, M., Fabricant, D., Kelson, D. D., & Illingworth, G. D. 1999, The Astrophysical Journal, 520, L95
- van Dokkum et al. (2010) van Dokkum, P. G., et al. 2010, The Astrophysical Journal, 709, 1018
- Wake et al. (2005) Wake, D. A., Collins, C. A., Nichol, R. C., Jones, L. R., & Burke, D. J. 2005, The Astrophysical Journal, 627, 186
- Wake et al. (2006) Wake, D. A., et al. 2006, Monthly Notices of the Royal Astronomical Society, 372, 537
- Wake et al. (2008) —. 2008, Monthly Notices of the Royal Astronomical Society, 387, 1045
- Weinmann et al. (2009) Weinmann, S. M., Kauffmann, G., van den Bosch, F. C., Pasquali, A., McIntosh, D. H., Mo, H., Yang, X., & Guo, Y. 2009, Monthly Notices of the Royal Astronomical Society, 394, 1213
- White et al. (2011) White, M., et al. 2011, The Astrophysical Journal, 728, 126
- Wilson et al. (1997) Wilson, G., Smail, I., Ellis, R. S., & Couch, W. J. 1997, Monthly Notices of the Royal Astronomical Society, 284, 915
- Wilson et al. (2009) Wilson, G., et al. 2009, The Astrophysical Journal, 698, 1943
- Worthey et al. (1992) Worthey, G., Faber, S. M., & Gonzalez, J. J. 1992, The Astrophysical Journal, 398, 69
- Yang et al. (2008) Yang, X., Mo, H. J., & van den Bosch, F. C. 2008, The Astrophysical Journal, 676, 248
- Yang et al. (2005) Yang, X., Mo, H. J., van den Bosch, F. C., & Jing, Y. P. 2005, Monthly Notices of the Royal Astronomical Society, 356, 1293
- York et al. (2000) York, D. G., et al. 2000, The Astronomical Journal, 120, 1579
- Zheng et al. (2009) Zheng, Z., Zehavi, I., Eisenstein, D. J., Weinberg, D. H., & Jing, Y. P. 2009, The Astrophysical Journal, 707, 554
Appendix A Comparison between SDSS and SExtractor magnitudes
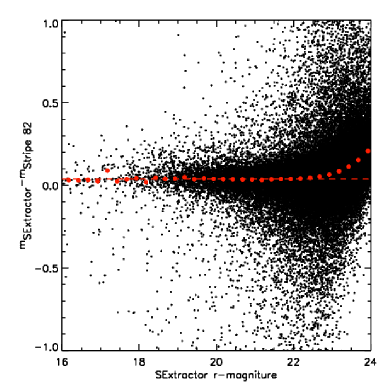
Aperture based photometry can lead to a systematic misestimate of total flux measurements compared to model based photometry. Taylor et al. (2011) performed an extensive comparison of several flux estimates and showed that SExtractor AUTO magnitudes are up to 10% fainter than SDSS model magnitudes. Taylor et al. (2011) further found that this value is dependent on the light profile slope of the best-fit galaxy model.
In order to correct for this effect we extracted photometry for all objects in 150 SDSS fields in Stripe 82 and compared the resulting AUTO magnitudes to model magnitudes from the Stripe 82 catalogs. This comparison is shown in figure 8, where the difference between the measurements is plotted against the SExtractor values. We then fitted a line to the running median of this distribution and derived a correction relation for the extracted magnitudes used throughout this paper, assuming that Stripe 82 model magnitudes better reflect the total flux of the studied galaxies. The correction factor is essentially constant and it has a value of roughly 0.04 magnitudes between and . The distribution plotted in Figure 8 is consistent with the relation between SDSS model and SExtractor AUTO measurements found by Taylor et al. (2011) for objects brighter than roughly 17.5 magnitudes. Hill et al. (2011) compared SDSS and SExtractor flux values over a broad range of magnitudes and also found a small offset between the measurements.
We note that since all galaxies in our sample do not have the same light profile slope, we introduce a error of up to 10% to the measured luminosities by applying a single correction relation for all galaxies. This error could potentially translate to a systematic offset in the flux measurement of the LRGs themselves if the LRG light profile is significantly steeper than the typical satellite profile. However, since the absolute fraction of missed light at any given magnitude is small, we expect this contribution to be insignificant compared to other sources of scatter in this study.