Tracing the Evolution of Physics on the Backbone of Citation Networks
Abstract
Many innovations are inspired by past ideas in a non-trivial way. Tracing these origins and identifying scientific branches is crucial for research inspirations. In this paper, we use citation relations to identify the descendant chart, i.e. the family tree of research papers. Unlike other spanning trees which focus on cost or distance minimization, we make use of the nature of citations and identify the most important parent for each publication, leading to a tree-like backbone of the citation network. Measures are introduced to validate the backbone as the descendant chart. We show that citation backbones can well characterize the hierarchical and fractal structure of scientific development, and lead to accurate classification of fields and sub-fields.
pacs:
89.75.Hc,89.75.Fb,02.50.-r,05.45.DfI Introduction
Many innovations are inspired by past ideas in a non-trivial way. Examples in statistical physics include the connection between spin glasses and combinatorial problems mezard87 ; nishimori01 , the application of critical phenomenon in earthquake modeling bak02 ; corral04 , and the analyses of disease spreading by percolation theory newman02 ; dorogovtsev08 . To draw these connections is easy, but to map individual fields onto a descendant chart, i.e. a family tree of research branches is more complicated. An even more difficult task is to uncover the macroscopic tree based on the microscopic relations between publications. Despite the difficulties, the descendant charts are crucial for revealing the non-trivial connections between branches which stimulates inspirations. Accurate descendant charts also give a natural classification of papers.
A solid basis to study descendant charts is represented by the citation network which can be seen as the original map of scientific development. In recent years, the citation and authorship networks have been used to evaluate the impact of academic papers and scientists chen07 ; radicchi09 . Though useful informations are retrieved, most studies focus on contemporary impact and ignore the intrinsic hierarchical structure of citations encoding the generation of scientific advances. Unlike the horizontal exploration in conventional paper classifications griffiths04 , we explore the vertical, i.e. temporal, dimension in citation networks to identify the descendant charts of publications.
At this end we identify a backbone of the citation network by removing all but the most relevant citation for each paper. The backbone hence results in a tree-like structure and is found solely based on citation relations with no additional information. Similar concepts of spanning trees are extensively studied in transportation networks and oscillator networks, as minimum spanning trees in terms of traveling cost aldous06 ; jackson10 , and trees that maximize betweenness goh06 or synchronizability nishikawa06 . Though the citation backbone can be constructed by these definitions, we see no direct correspondence between them and scientific descendant trees. Instead, one should make use of the nature of citation relations and identify the important parent and thus the offspring for each paper, which constitutes a backbone specific for citation networks.
In this paper, we identify the descendant chart for publications in journals of American Physical Society (APS), based on their citation network from year 1893 to 2009. Our objectives are three-fold. Firstly, we introduce a potential approach to identify the most relevant parent (among the set of original references) for each publication which leads to a backbone of the citation network. Secondly, we introduce measures to validate the citation backbones as representative descendant charts and compare our approach with two other simple procedures (i.e. selection of random parent or the longest path to the root). Finally, we show that citation backbones possess features of hierarchy and self-similarity, and lead to a valid classification of papers in linear-time, compared to conventional polynomial-time algorithms hastie01 ; fortunato10 . The present work pinpoints the importance of scientific descendant charts, as well as their intrinsic difference from other spanning trees.
II Methods
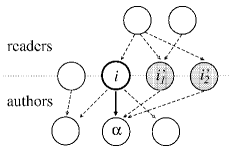
To start our analyses, we first denote the references of a paper as its parents, and the articles citing the paper as its offspring. The set of parents and the offspring of a paper are denoted by and with respectively and elements. Intuitively, the offspring of an important paper should share similar focus introduced by its influential parent. Less relevant parents will by contrast lead to a more heterogeneous descendance. We thus quantify the impact of parent on by where is the similarity between and . We refer to papers in the set of as the peers of rooted in (see Fig. 1 for an illustration). The higher the overall similarity between and the papers in , the higher the impact of on .
A simple way to measure the similarity between and peer is to count the number of their common references, i.e. . However, this similarity measure favors peers with many references, resulting in an impact biased towards parents with a large offspring. This suggests to define a similarity measure based on a random walk from the peers to . We thus consider a 2-step random walk from each peer to which passes through their common references, and define a contribution to as
| (1) |
The superscript represents the authors’ interpretations, as this similarity is measured through the references chosen by the authors of . A second contribution is instead given by a random walk through articles citing and represents the readers’ interpretation of . In analogy with we define
| (2) |
As defined in both Eqs. (1) and (2), the higher the random walk probability from to , the higher the similarity between and .
Finally, by combining linearly and and summing over all the peers rooted in , we obtain the impact of on as
| (3) |
with to adjust the relative weights on the two contributions. The subsequent analysis is simplified by setting unless otherwise specified. We note that citations between peers wu09 do not contribute to the above measure, as these citations may correspond to relations other than similarity. For instance, if many peers rooted from parent cited , it implies that complements instead of being merely an influential parent of . The same is true if cites many peers rooted from , which suggests being a complement of its peers instead of a mere influential parent.
By keeping only the reference with highest for all , we obtain a citation backbone denoted as the SIM backbone. Cases of equal scores are extremely rare and do not affect results (in such situations we arbitrarily choose the latest reference with highest ). In addition, we examine also the RAN and the LON backbone, which selects respectively a random parent and a reference which gives rise to the longest path to the root (most likely the latest published parent). Other than serving as a benchmark, the RAN backbone can be informative as the random parent is one of the original references. The LON backbone instead represents a natural choice if progress is always based on recent developments, as one may follow the step-by-step evolution of science represented by the maximum number of steps needed to reach the root.
III Statistical Properties of the Backbone
We will examine the citation network among the journals of American Physical Society, from year 1893 to 2009. The dataset is composed by citations between publications. In rare cases there are references to contemporary or even posterior published papers. These citations are removed and the network is strictly acyclic.
We note that all papers without reference are potentially the roots of the backbone. As this number is in general greater than one and we are limited to the simplest case with one selected ancestor per paper, there may appear multiple roots and hence isolated trees in the backbone. In the subsequent discussion, we will refer the output of the SIM , RAN and LON algorithms as backbone, and its isolated components as trees. Since the seemingly isolated roots may be connected by citations other than the APS network, the number of isolated trees would be lower if a more comprehensive citation data was used. Nevertheless, such isolated trees may represent a crude classification of papers. Table 1 summarizes general statistical properties of the group of trees as obtained by SIM , RAN and LON approaches.
| SIM | RAN | LON | |
| Number of isolated trees | 3953 | 6594 | 2630 |
| Size: | |||
| largest tree | |||
| 2nd largest tree | |||
| 3rd largest tress | |||
| parent-offspring | 9.5 y | 7.4 y | 2.1 y |
IV The Structure of the Backbone
In this section, we will discuss and derive measures to validate the citation backbones as representative of descendant charts. Three aspects will be studied. Firstly, we examine the linkage between different generations of papers. Secondly, we quantify the paper classification as given by the clustering and branching structure in the backbones. Finally, we examine the possible self-similarity in citation backbones.
IV.1 Hierarchy
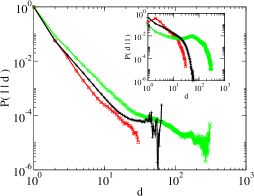
We first examine the probability of observing an original citation between two papers as a function of their distance in the backbone. If the backbone is meaningful we expect this quantity to decrease fast as the distance increases. To compute the distance between and we find the first common ancestor in the backbone and count the number of steps and required to go from to and from to . The distance is then set as . We consider for paper and in isolated trees. In Fig. 2 we plot as a function of for all SIM , RAN and LON backbones, where denotes the presence of a link, i.e. a citation. As we can see, by definition and all display a power law decay for small . The SIM backbone shows a faster decay than other algorithms, suggesting that citations are more localized in the neighborhood of a paper in the SIM backbone. A similar quantity (see the inset of Fig. 2) also indicates that the SIM backbone is the best representative of the APS network since citations are concentrated at and decay faster as the distance increases.
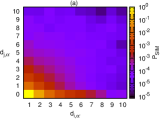
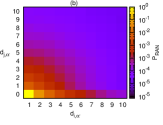
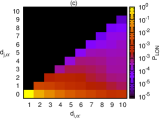
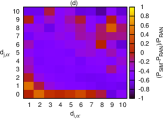
In addition to , we further consider where is again the first common ancestor of and in the backbone. This allows us to see whether citations are localized on the specific branch of each paper or spread over different ramifications on the tree. For any pair we take as the later published paper such that the only potential citation is . We show in Fig. 3 (a)-(c) the results of for the three backbones, as a function of and . One notes that increasing on the line of corresponds to the vertical trace towards the root, while points with correspond to the various ‘ramifications’ in the backbone. Both SIM and RAN gives a meaningful structure where citations are localized on the descendant chart of the immediate and next immediate ancestor, i.e. the triangle in the bottom left-hand corner. Citations between different ramifications are rare. The LON backbone instead displays a less coherent structure where citations crossing different lines of research are common. To examine the difference between SIM and RAN we also show the scaled difference of their as given in the vertical axis of Fig. 3 (d). This comparison clearly indicates that SIM gives raise to the most meaningful hierarchy as citations are mainly found on the descendant chart of the more relevant ancestors instead of crossing different charts.
IV.2 Clustering
In addition to the crude classification as given by the isolated trees, the branches in a single tree are also informative to identify research fields and sub-fields. From the clustering point of view the method we have introduced is computationally efficient (with complexity to be as long as connectivity is not extensive) compared to modularity maximization based algorithms newman04 ; newman06 or hierarchical clustering algorithms jain99 (with complexity at least ). Moreover, the clustering naturally explores the temporal dimension by preserving the ancestor-descendant relations.
In order to map the backbone into clusters we consider two simple approaches which involve only a single parameter. The first approach makes use of the publication year of papers and naturally follows the order of publication. We first make a cut at the year such that papers printed before are removed. We then consider each unconnected component as a different branch, i.e. a different cluster, in the original backbone, and as a classification for papers.
The second approach is dependent on the cluster size which we consider to be a typical research branch. Starting from the leaves of the backbone (i.e. papers with no offspring) we trace towards the root until a branching point is reached. The branching point is defined as a node of the network from which at least (i) two ramifications start and (ii) two ramifications are extended more than steps. When a branching point satisfies these requirements, all ramifications originating from it are considered as different branches, resulting in a classification of papers. Here we quantify the validity of clustering as a function of parameter and .
In order to evaluate the quality of a given clustering we use two different measures. The first one—which we call exclusivity—is a modified modularity measure specific for directed acyclic graphs. The rationale behind this measure is to compute the fraction of links of the original network falling inside the same cluster and compare it with the expected value for a random directed acyclic graph. We denote the set of papers assigned to branch as and define the exclusivity as
| (4) |
where is again the number of references of ; is the number of ’s references in branch ; is the number of papers published before ; is the number of papers published before in branch . The term thus corresponds to the expected fraction of links from to an element in in the random case. To reduce the noise from small clusters, we have excluded branches with less than 10 papers.
The second measure we use is the effective number of PACS——which counts the average number of heterogeneous PACS in individual branches. Good paper classifications result in small values of . We first denote to be the fraction of paper in branch which is labeled by the PACS number , and note that as papers are always labeled by more than one PACS number. is then defined as
| (5) |
where . Therefore, when there is only one PACS in the branch which corresponds to the optimal classification of papers. On the other hand, attains its maximum when all PACS numbers in have equal share (i.e. equal ) and a large thus corresponds to high heterogeneity inside single clusters. We remark that in evaluating , only the first four digits are used to distinguish PACS number.
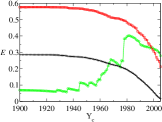
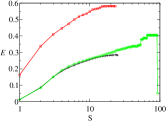
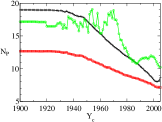
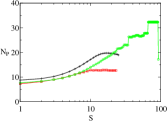
In Fig. 4 we plot the and as a function of the two parameters and . Both measures are biased by the cluster size but in an opposite way. While indicates better clustering (and thus a lower value) when isolated clusters are of smaller size, indicates better clustering (and thus a higher value) when clusters are of larger size. Even with the compensation by in Eq. (5), we still observe a small bias of on cluster size. These biases may influence our comparison of the identified clusters from the SIM , RAN and LON backbones, as they have different sizes. Nevertheless, the combination of the two independent measures clearly indicate that SIM is the best choice to obtain a meaningful clustering besides the bias introduced by cluster sizes. Moreover the exclusivity of the SIM backbone is higher for any value of the parameter which further supports the validity of the comparison despite the presence of the bias.
IV.3 Self-similarity
Other than the hierarchical and clustering properties, the backbones may possess self-similarity. Intuitively, self-similarity may be induced when branches of research successively generate branches of significant advances. The existence of fractality in the backbone would provide support for its relevance with the evolution of science.
To show the self-similarity in networks, one can measure their fractal dimension by the box-covering method song05 ; goh06 ; kim07 . In this approach, the fractal dimension is defined as the power-law exponent in
| (6) |
where is the minimum number of boxes, each of radius , required to cover the whole network. To obtain the exact is in general difficult, we thus employ the random sequential box-covering algorithm kim07 which gives an approximate with the same scaling. Specifically, we start with all nodes being “uncovered” and repeat the following procedures until all nodes become “covered”: (1) pick randomly a seed node, (2) find all “uncovered” nodes within a distance of from the seed, and (3) increase by one if there exists at least one “uncovered” node and mark all of them as “covered”. Note that a “covered” node can also be a seed in the subsequent searches. For the same tree, we show the minimum of among 20 random sequences as our final value for each value of .
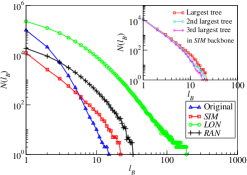
We show in Fig. 5 the results of as a function of for the largest tree in the SIM , RAN and LON backbone. The results are compared to of the original citation network. As we can see, from the LON backbone has the highest resemblance to power-laws, while that of the RAN backbone shows the fastest decay in . The LON tree has a long tail of , as it is longest and largest in size (see Table 1). Only the largest tree of a particular realization of the RAN backbone is shown, as similar results are observed in other realizations. Though a long tail is not observed in the SIM tree, it shows a power-law-like behavior up to an intermediate value of . Similar behaviors are also observed in the other isolated trees of the SIM backbone, as shown by the inset of Fig. 5.
We interpret the results as follows. The observed resemblance to power-laws from the SIM and LON backbone may suggest the presence of self-similarity in their descendant chart. While the LON backbone does not possess a meaningful hierarchy or clustering compared to the SIM backbone, its step-by-step structure indeed shows the highest fractality. We note that a rather short power-law is also observed in the original network, though characterized by a different exponent from the SIM and LON backbones. On the other hand, such fractality is not observed in the RAN backbone.
V Potential Applications
In this section, we briefly describe the implications and potential applications of the citation backbone as a descendant chart of research papers.
As the backbone is a sketch of the skeleton of scientific development, it can be applied to identify seminal papers. Preliminary results show that a simple measure based on the the number of relevant offspring, i.e. followers in the backbone, is sufficient to give a meaningful ranking that is not trivially correlated with the original number of incoming citations (between the two ranking the Kendall’s correlation coefficient is and there is an overlap of only 7 papers in the top 20 ranks). This serves as a simple yet meaningful definition of impact of a publication. More refined definitions which takes into account the reputation of each relevant offspring and/or the structural role of a given paper in the backbone can give even better selection of fundamental papers. Moreover, our formulation of tunable weight on authors’ and readers’ interpretation in Eq. (3) can be easily incorporated in common ranking algorithms such as Page Rank where an even repartition of citation importance is instead assumed.
The second application corresponds to the classification of papers. As we have mentioned before, such clustering divides papers into research fields or sub-fields and offers a basis for a synthetic picture of the state-of-the-art. There are several advantages over conventional classifications, which include (1) lower computational complexity, (2) additional information of sub-clustering as given by the internal tree structure, (3) predictions of future development by considering the rate of growth of sub-branches. Especially this last feature is useful to filter the most active directions in the large amount of literature at our disposal.
VI Conclusions
We have shown that a simple backbone constructed by the most relevant citations can well characterize the original citation network. Conversely, non-trivial informations stored in the citation network can be simply extracted from its backbone. While conventional spanning trees are based on contemporary information, we demonstrated the significance of temporal dimension in citation backbones.
Specifically, we have introduced both a simple approach to identify the most relevant reference for each publication and effective measures to quantify the validity of the resulting backbone. Our results show that the essential features of hierarchy and paper clustering in the original network are well captured by our citation backbone, while this is not the case for other simple approaches. On the other hand, we showed that resemblance to self-similarity is observed in citation backbones.
In terms of applications, the backbone can be considered as a descendant chart of research papers, which constitutes a useful basis for identifying seminal papers and paper clusters, and in general a synthetic picture of different research fields. In particular, paper classification by mean of the backbone is computationally efficient when compared to the conventional clustering approaches, and provides additional information on the cluster structure besides a mere cluster label.
While we only investigated the citation network of the American Physical Society, the same approach can be readily applied to other citation networks. It would be also interesting to examine the potentials of the present approach on other directed acyclic graphs.
Acknowledgements
We thank Matúš Medo for fruitful discussions and comments, Giulio Cimini and An Zeng for meaningful suggestions. This work is supported by QLectives projects (EU FET-Open Grants 231200), the Swiss National Science Foundation (Grant No. 200020-132253), the Sichuan Provincial Science and Technology Department (Grant No. 2010HH0002) and the National Natural Science Foundation of China (Grant Nos. 90924011,60973069). CHY is partially supported by EU FET FP7 project STAMINA (FP7-265496). We are grateful to the APS for providing us the dataset.
References
- (1) M. Mézard, G. Parisi and M. A. Virasoro, Spin Glass Theory and Beyond (World Scientific, 1987).
- (2) H. Nishimori, Statistical Physics of Spin Glasses and Information Processing (Oxford University Press, Oxford, UK, 2001).
- (3) P. Bak, K. Christensen, L. Danon, and Scalon, Phys. Rev. Lett. 88, 178501 (2002)
- (4) A. Corral, Phys. Rev. Lett. 92, 108501 (2004)
- (5) M. E. J. Newman, Phys. Rev. E 66 016128 (2002).
- (6) S. N. Dorogovtsev,A. V. Goltsev and J. F. F. Mendes, Rev. Mod. Phys. 80, 1276 (2008).
- (7) P. Chen, H. Xie, S. Maslov and S. Redner, J. Inform. 1:8-15, (2007).
- (8) F. Radicchi, S. Fortunato, B. Markines and A. Vespignani, Phys. Rev. E 80, 056103 (2009).
- (9) D. Aldous and A. G. Percus, Proc. Natl. Acad. Sci. USA 100, 11211 (2006)
- (10) T. S. Jackson and N. Read, Phys. Rev. E 81, 021130 (2010).
- (11) K.-I. Goh, G. Salvi, B. Kahng and D. Kim, Phys. Rev. Lett. 96, 018701 (2006).
- (12) T. Nishikawa and A. E. Motter, Phys. Rev. E, 73, 065106 (2006).
- (13) Z.-X. Wu and P. Holme, Phys. Rev. E 80, 037101 (2009)
- (14) C. Song, S. Havlin and H. A. Makse, Nature 433, 392 (2005).
- (15) J. S. Kim, K.-I. Goh, B. Kahng and D. Kim, New Journal of Physics 9, 177 (2007).
- (16) T. Hastie, R. Tibshirani, J. H. Friedman, The Elements of Statistical Learning (Springer, Berlin, Germany, 2001).
- (17) S. Fortunato, Physics Reports 486, 174 (2010).
- (18) T. L. Griffiths and M. Steyvers, Proc. Natl. Acad. Sci. 101, 5228 (2004).
- (19) M. E. J. Newman and M. Girvan, Phys. Rev. E 69, 026113 (2004).
- (20) M. E. J. Newman, Proc. Natl. Acad. Sci. 103, 8577 (2006).
- (21) A. K. Jain, M. N. Murty and P. J. Flynn, Journal ACM Computing Surveys 31, 3 (1999)