RCW 86: A Type Ia Supernova in a Wind-Blown Bubble
Abstract
We report results from a multi-wavelength analysis of the Galactic SNR RCW 86, the proposed remnant of the supernova of 185 A.D. We report new infrared observations from Spitzer and WISE, where the entire shell is detected at 24 and 22 m. We fit the infrared flux ratios with models of collisionally heated ambient dust, finding post-shock gas densities in the non-radiative shocks of 2.4 and 2.0 cm-3 in the SW and NW portions of the remnant, respectively. The Balmer-dominated shocks around the periphery of the shell, large amount of iron in the X-ray emitting ejecta, and lack of a compact remnant support a Type Ia origin for this remnant. From hydrodynamic simulations, the observed characteristics of RCW 86 are successfully reproduced by an off-center explosion in a low-density cavity carved by the progenitor system. This would make RCW 86 the first known case of a Type Ia supernova in a wind-blown bubble. The fast shocks ( km s-1) observed in the NE are propagating in the low-density bubble, where the shock is just beginning to encounter the shell, while the slower shocks elsewhere have already encountered the bubble wall. The diffuse nature of the synchrotron emission in the SW and NW is due to electrons that were accelerated early in the lifetime of the remnant, when the shock was still in the bubble. Electrons in a bubble could produce gamma-rays by inverse-Compton scattering. The wind-blown bubble scenario requires a single-degenerate progenitor, which should leave behind a companion star.
1 Introduction
It is widely believed that Type Ia supernovae (SNe) originate from white dwarf (WD) stars that have been pushed close to the Chandrasekhar limit, either by accreting matter from a companion star (single-degenerate scenario), or by merging with another WD (double-degenerate scenario) (Isern et al., 2008). The detailed physics of the single-degenerate scenario, particularly the role, if any, that the binary system plays in shaping the surrounding medium is poorly understood. Hachisu et al. (1996) suggested that, under certain conditions, accreting WDs in a binary system with a main sequence or red giant companion might blow a substantial wind, carving out low-density cavities in the surrounding ISM in the yr prior to explosion. Badenes et al. (2007) considered young ( yr) supernova remnants (SNRs) known to be of Type Ia origin, finding that none were consistent with evolution into such a modified medium.
The Galactic SNR RCW 86 (G315.4-2.3; MSH 14-63) is one of a small number of remnants with a historical connection, as it has been proposed to be the remains of SN 185 A.D. (Clark & Stephenson, 1975). The distance has been reported to be near 1 kpc (Kaastra et al., 1992), but more recent measurements have put it from 2.3 (Sollerman et al., 2003) to 2.8 kpc (Rosado et al., 1996). Throughout this work, we adopt a distance of 2.5 kpc, parameterized, where appropriate, as . The claim that this event was a SN at all has been disputed (Chin & Huang, 1994), but Stephenson & Green (2002) review the entirety of the available information on the “guest star” of 185 A.D., concluding that it was indeed a SN, a view supported by the work of Zhou et al. (2006), and that RCW 86 represents the most likely candidate for its remnant. According to Schaefer (1993), the maximum unrefracted altitude of RCW 86 as seen from the city of Luoyang, China, was 2.3∘, leading to an airmass of 18. Under good seeing conditions (0.2 magnitudes extinction per airmass), the atmospheric extinction would be = 3.6. Optical measurements have placed the ISM extinction at (Leibowitz & Danziger, 1983), so a supernova at 2.5 kpc (see below) with, for instance, would appear as a new star of , easily visible to ancient observers. Significant sources of error are possible in virtually all of these parameters. If the Chinese historical observations came from a region farther south in China, the airmass in the direction of RCW 86 would be significantly reduced. For instance, an altitude of 5∘ above the horizon implies 10 airmasses (Kasten & Young, 1989), reducing the atmospheric extinction to 2 mag. A brighter Type Ia SN, which we argue in favor of later, could add another 2 mag to the observed brightness. On the other hand, we report X-ray column densities of cm-2, which could raise the interstellar extinction from 2 to 4 mag. In summary, it appears quite possible that there could have been a supernova visible from China at the position of RCW 86, at a distance of 2.5 kpc.
The recent measurement of high proper motion of the shock, as defined by the onset of X-ray emission in the NE limb implies very fast shocks ( km s-1) (Helder et al., 2009), supporting a young age for the remnant. The broad Fe K line width measured by Suzaku (Ueno et al., 2007) and the presence of non-thermal synchrotron X-ray emission (Bamba et al., 2000; Borkowski et al., 2001a; Vink et al., 2006) also suggest a young SNR. The remnant shows a complete shell at radio, optical, and X-ray energies (Kesteven & Caswell, 1987; Smith, 1997; Pisarski et al., 1984), and has recently been detected in TeV gamma-rays by H.E.S.S. (Aharonian et al., 2009). Shock speeds vary greatly from one side of the remnant to the other, from the high shock speeds in the east to the slower (550 – 650 km s-1) shocks in the NW and SW corners, as derived from optical spectroscopy (Long & Blair, 1990; Ghavamian, 1999; Ghavamian et al., 2001). Helder et al. (2009) also report that the eastern limb could be a site of significant cosmic-ray acceleration, based on the discrepancy between proper motions of the X-ray emitting filaments and the spectroscopically determined proton temperature.
Numerous authors have pointed out the difficulties with reconciling the young age of RCW 86 with its large size. At a distance of 2.5 kpc, the average speed of the shock for this large remnant ( in diameter) is km s-1, but as previously mentioned, shock speeds in most of the remnant are an order of magnitude less than this. It has been suggested (e.g., Vink et al. 1997) that a cavity explosion offers the most natural explanation, with the shock racing through a low-density bubble, recently having encountered a dense shell. Cavity explosions are typically associated with core-collapse (CC) supernovae, but the nature of the progenitor system for RCW 86 is uncertain. Badenes et al. (2007) suggested that RCW 86 may be the result of a Type Ia explosion into a cavity formed by the progenitor system, a scenario that could offer new constraints on accretion wind outflows from single-degenerate progenitor systems of Type Ia SNe.
This paper is organized as follows: In Sections 2 and 3, we report the results of new infrared (IR) observations with Spitzer and WISE. We discuss the nature of the progenitor system in Section 4, and the evidence for a cavity explosion in Section 5. The nonthermal synchrotron emission is discussed in Section 6, and the gamma-ray emission in Section 7.
2 Infrared Observations
IR emission from SNRs can be thermal continuum from warm dust grains heated by collisions with energetic ions and electrons in the X-ray emitting gas, line emission from low to medium-ionization states of atoms cooling in the post-shock region, or a combination of the two. Nonthermal emission via synchrotron radiation can contribute as well, but is generally negligible compared to thermal processes (Rho et al., 2008). Generally speaking, emission from younger SNRs expanding into a low-density medium (characterized by non-radiative shocks in the optical) will be dominated by continuum (Williams et al., 2011), while older shocks or those encountering molecular clouds will become radiative and show strong mid-IR line emission (Hewitt et al., 2009). IR studies of SNRs offer the possibility to learn about both the conditions of the remnant and the physics of the gas-dust interaction in shocks.
Previous IR observations of RCW 86 have led to conflicting results. Dwek et al. (1987) used IRAS observations to determine that the IR/X-ray flux ratio (IRX ratio) from the bright SW shell (the only part of the remnant firmly detected by IRAS) is higher than theoretical predictions. They attributed this to either a dust/gas mass ratio higher than average for the Galaxy or a poor coupling between the IR emitting dust and the X-ray emitting gas. However, Greidanus & Strom (1990) used the same IRAS data and IR emission model to arrive at the opposite conclusion, namely that the IRX ratio for the remnant is lower than predictions by a factor of 10, implying a low dust/gas mass ratio.
Studies done with IRAS suffer from both poor angular resolution and low sensitivity, and resolving discrepant results such as these requires study by advanced IR telescopes. Using Spitzer and WISE, we detect the entire shell at 24 and 22 m and the SW and NW portions at 12 and 70 m. Faint extended emission in the SW is seen in short-wavelength bands as well. Detection of the eastern shell of the remnant is significantly complicated at 70 m by confusion with Galactic IR emission.
As part of Spitzer program 50698, we obtained a full map of the remnant at 24 and 70 m using the Multiband Imaging Photometer for Spitzer (MIPS) on 2009 March 31, just weeks before the end of the cold Spitzer mission. The size of the remnant ( in diameter) required two scan maps (AOR ID 26750208 & 26749952) of 1∘ 0.5∘, which we mosaicked together using the MOPEX software provided by the Spitzer Science Center. We used a medium scan rate for the maps, offsetting each scan leg by to ensure full coverage at 70 m and redundancy by a factor of 2 at 24 m. We used all four channels (from 3.6 to 8 m) of the Infrared Array Camera (IRAC) to map a region of on 2009 March 23 (AOR ID 26748928), centered on the brightest filaments in the SW region of the shell seen in X-rays with Chandra (Rho et al. 2002, hereafter R02). Both the IRAC and MIPS data were processed using version 18.7 of the Spitzer pipeline. The pipeline processed 70 m data contains some artifacts, most notably striping in the direction of the scan leg.
In mid-April of 2011, the Wide-Field Infrared Survey Explorer (WISE) science team released the first half of the data taken by WISE, a mid-IR telescope which surveyed the entire sky at 3.3, 4.6, 12, and 22 m. RCW 86 was in the region of the sky covered by this initial data release. To provide a more complete picture of the IR properties of the SNR, we have downloaded the WISE images of this remnant at all four wavelengths.
3 Analysis and Modeling
3.1 Morphology
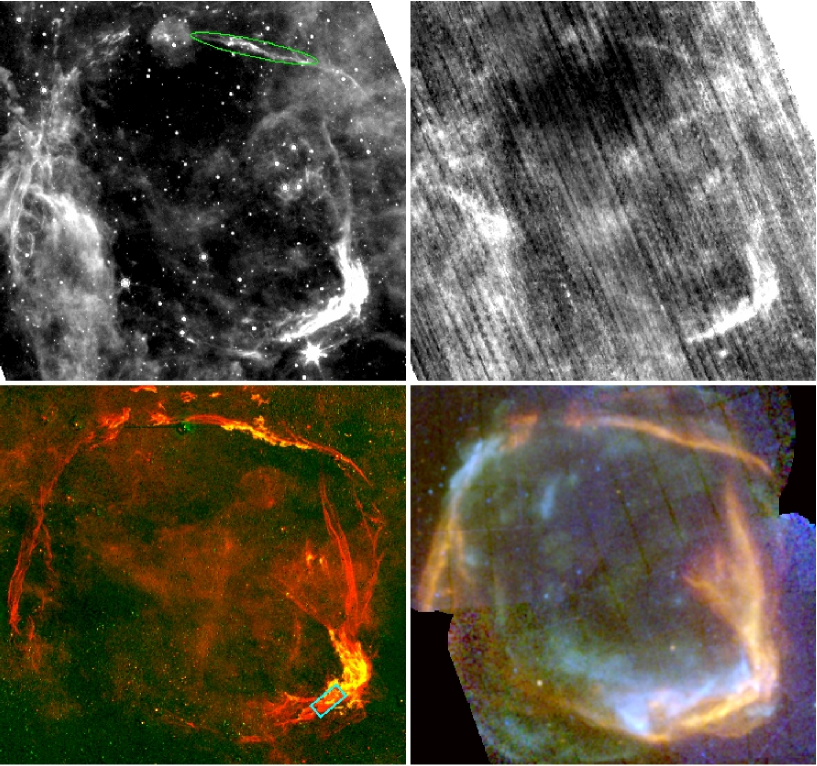
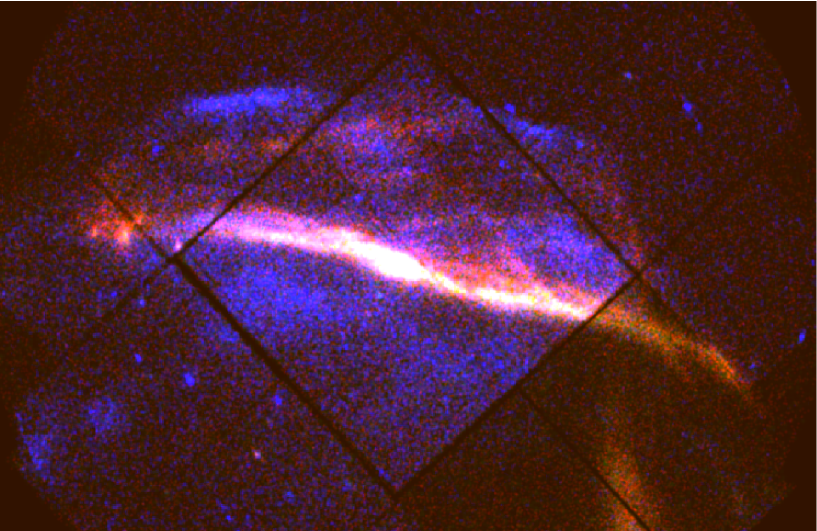
We show the MIPS images at 24 and 70 m in Figure 1, along with X-ray and optical images as described in the caption. At 24 m, where the angular resolution of the telescope is , the correlation between the IR, X-ray, and optical images is significant, implying a tight coupling between the IR emitting dust and the X-ray emitting gas. A strong correlation exists for the 70 m data (resolution ) as well in the SW and NW portions of the shell; however, the eastern part of the shell is dominated by emission that is likely from a foreground or background region. The IR colors in the E region allow us to trace the forward shock and make a determination of what is and is not associated with the remnant. At 24 m, the much lower background level allows distinction between this region and the thin, non-radiative filaments of the blast wave.
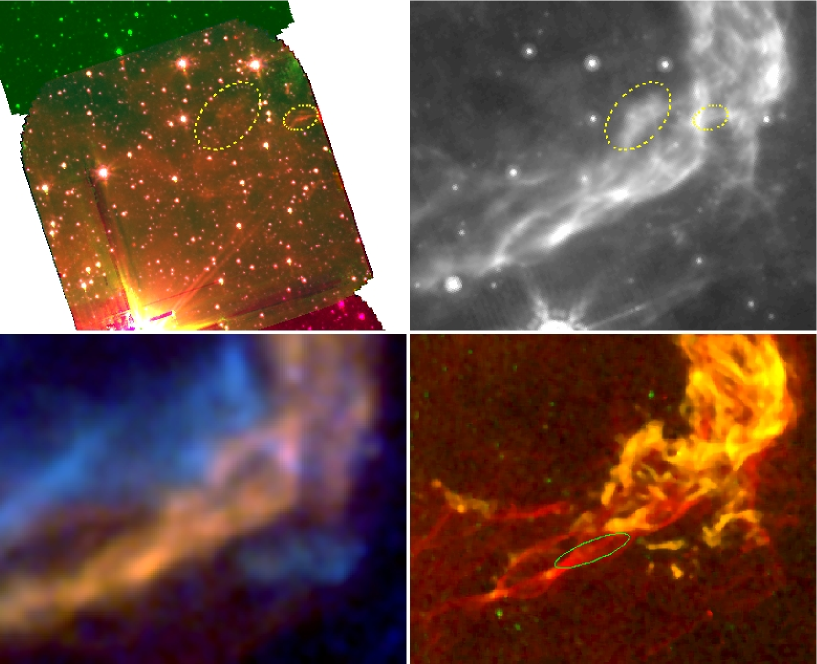
We show a three-color IRAC image in Figure 2, where a few faint filaments are observed that correspond to features seen at 24 m. These filaments also appear as radiative filaments in the [S II] image (Smith, 1997), making it likely that the IRAC emission comes from lines (most likely [Ar II] at 7 m and [Fe II] at 5.4 m). It is possible that emission from polycyclic aromatic hydrocarbons (PAHs) heated immediately behind the shock front could contribute as well, although the lifetime of these molecules is quite short in the post shock environment.
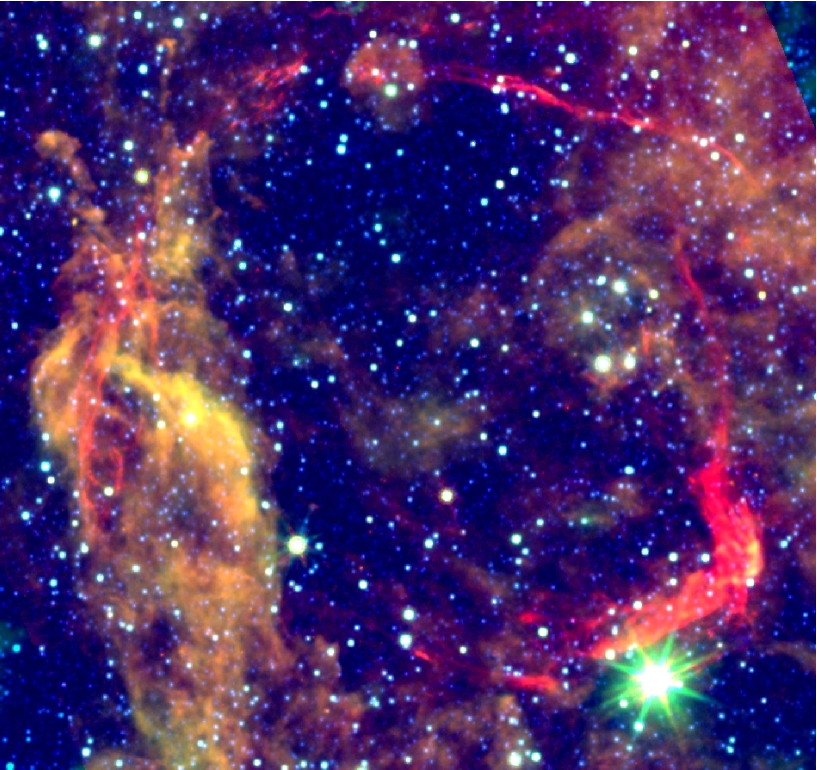
A mosaic of the WISE 4.6 m, 12 m, and Spitzer 24 m images is shown in Figure 3. WISE data show the entire periphery of the shell at 22 m (though with a lower angular resolution than with Spitzer), as well as significant portions of the SW shell at 12 m, where the WISE resolution is comparable with Spitzer’s at 24 m. Faint emission from the NW filament is detectable at 12 m as well. At 4.6 and 3.3 m, only a small filament is visible in the extreme SW, a filament which was not covered by the spatially limited IRAC map. The colors of this image, which reflect the temperature of the dust, separate the emission that is associated with the SNR from that of the background. This is particularly important in the east, where the thin red filaments trace the blast wave.
3.2 IR Fluxes and Ratios
For our analysis, we selected two regions in the remnant with detections at both 24 and 70 m: a small region in the bright SW “corner” that corresponds to purely non-radiative emission, as identified in optical images, and a filament in the NW stretching . The regions are indicated in Figure 1 and Figure 2, and are significantly larger than the angular resolution of Spitzer at 70 m. To measure the flux, we chose several local background regions outside of the remnant near the region of interest. The background is somewhat variable, particularly in the NW, so we average the background subtracted fluxes and report the standard deviation of these measurements as the error. Because we are interested in the emission from dust only, we must account for both stars and line emission from cooling gas. Neither region contains bright stellar sources, and only the 24 m image shows any stars at all in the region of interest. We excise regions at 24 m where stars are seen, using IRAC (where available) and optical images to determine the stellar nature of unresolved sources. Despite no visible stars in the regions at 70 m, we excise the same regions when measuring the 70 m flux. We find that stellar contamination to the 24 m flux is negligible in the small SW region and accounts for 15% in the larger NW region. The integrated flux from the excised regions at 70 m was less than 1% of the total. Fluxes reported in this work are the “star-subtracted” fluxes. We measure fluxes in the SW of 0.37 and 1.41 Jy at 24 and 70 m, respectively, and 0.69 and 3.10 Jy in the NW. Errors on these flux measurements are in the SW and in the NW, where the larger errors in the NW result from a fainter, more diffuse source region with a more variable background. The 70/24 m flux ratios are 3.8 and 4.5 in the SW and NW, respectively.
To account for the contribution of line emission to the integrated fluxes, we use IRS spectra taken as part of our Spitzer observing program. We defer analysis of the IRS data to a future publication, but note that a spatially integrated low-resolution spectrum from the SW shell shows the presence of the [Fe II]/[O IV] line blend at m (the lines are unresolved by the spectrograph, which has spectral resolution ). This line lies on top of a strong dust continuum, and when we integrate the IRS spectrum over the MIPS 24 m bandpass and response curve, the total line flux accounts for 1.2% of the observed 24 m flux. The extraction region for this spectrum is shown in the bottom left panel of Figure 1, and lies on top of both radiative and non-radiative filaments. Although we do not have IRS spectra of the NW filament, radiative shocks there are fainter, and we expect that line contamination to the 24 m fluxes should be even less important than in the SW. We do not have spectral data extending to the wavelengths of the 70 m detector, but the bandpass of that filter is extremely broad (FWHM m), and any lines present, such as [O I] at 63 m or [O III] at 88 m (where filter throughput is only 14%) would have to be extraordinarily strong to contribute significant flux. We thus ignore any line contributions to the fluxes reported above.
3.3 Modeling
To model IR emission, we follow a procedure identical to that described in previous works (Borkowski et al., 2006; Williams et al., 2006). The heating rate of a grain immersed in a hot plasma depends on both the post-shock gas density (collision rate) and temperature (energy per collision). In general, the temperature of a plasma can be determined by fits to X-ray spectra. Dust heating models depend on this temperature, but this dependency is not strong (Dwek, 1987). The density of the gas is a more sensitive parameter for dust heating models and controls the temperature of the grains (i.e. the 70/24 m flux ratio). We regard the gas density as a free model parameter and adjust it to match the observed IR fluxes.
We account for sputtering of grains by ions, using a plane-shock model that superimposes regions of increasing sputtering timescale, defined as , where is the post-shock proton density, while keeping temperature behind the shock constant. (Note that the sputtering timescale is directly related to the ionization timescale used in X-rays, defined as ) Inputs to the model are a pre-shock grain size distribution, grain type and abundance (for these quantities, we use models for the Galaxy from Weingartner & Draine (2001), which contain a mixture of amorphous silicate and graphite grains), and ion and electron temperature and density. The code calculates heating and sputtering for grains from 1 nm to 1 m, producing a unique temperature and spectrum for each grain size. The spectra are summed according to the post-sputtering size distribution to produce a single model spectrum. We use sputtering rates from Nozawa et al. (2006) with enhancements for small grains from Jurac et al. (1998). Although we do not include it in our calculations, we note that the shock speeds in this remnant are only slightly above the upper threshold, reported by Sankrit et al. (2010) as 500 km s-1, where nonthermal, or ballistic sputtering effects begin to become important.
To determine kT and for the X-ray emitting gas, we analyze X-ray spectra from archival Chandra and XMM-Newton observations. The Chandra data were obtained in 2001 (Obs. ID 1993), where the SW shell was observed for 92 ks. We reprocessed and extracted the data using version 4.3 of the Chandra Interactive Analysis of Observations (CIAO). We obtained archival X-ray data in the NW rim and SW corner from the XMM-Newton EPIC-MOS detectors, observed in 2007 (Obs. ID 0504810401 & 0504810301, J. Vink, P.I.). The XMM-Newton data were processed using version 9.0 of the Science Analysis Software (SAS) for XMM. We filtered the data from MOS 1 and MOS 2 for flares and bad pixels, grouping the data to a minimum of 25 counts per bin. We fit the data using version 12.6.0 of XSPEC (Arnaud, 1996).
3.4 SW
R02 used the high spatial resolution of Chandra to uncover a complex system of shocks in the SW, with hard regions from the shocked ejecta mixed with softer regions from shocked ISM and regions dominated by non-thermal emission. We employ a similar modeling procedure to that used in R02 to fit the X-ray spectra from our region in the SW. We jointly fit Chandra ACIS and XMM-Newton EPIC-MOS 2 data (this particular region falls on the dead MOS 1 chip), letting the abundances of C, N (tied to C), O, Mg, Si, and Fe float freely. We find a reasonable fit with kT keV and cm-3 s. The reduced value in this simple model is rather high, . R02 found similarly poor values of in modeling emission from this region, attributing it to poor Fe L-shell data in low temperature plasmas (see discussion in Section 3.2 of that paper). Excising the regions of the spectra that were poorly fit improved the value of , but did not affect the fitted parameters of the thermal model, which are fully listed in Table 1. Freezing these parameters ( and ) in our dust heating model, we find that the IR luminosity and flux ratio are best fit with a post-shock density of = 2.4 (2.1, 2.75) cm-3 and a radiating dust mass of 3.2 (2.7, 3.9) . Lower and upper limits, listed in parentheses, are derived from fitting dust emission models to the extrema of the ratio. We assume that keV, which is appropriate for the shock speeds and ages seen in this section of the remnant (Ghavamian et al., 2007; van Adelsberg et al., 2008). In any case, grain heating at these temperatures is done almost entirely by electrons (Dwek, 1987).
3.5 NW
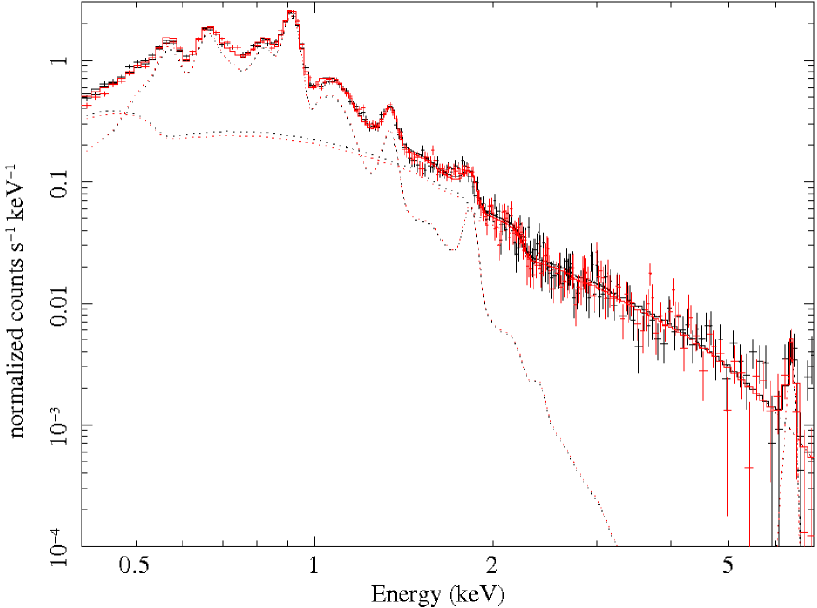
We show the 0.4-7 keV EPIC-MOS spectra from the NW in Figure 4. The shock speed of this filament is 580-660 km s-1 (Ghavamian, 1999). Visible in the spectra is a continuum extending to high energies, featureless except for an Fe K line at keV. We account for these components with an srcut model for the synchrotron emission (Reynolds & Keohane, 1999) and an Fe-only vpshock model with kT = 5 keV and = cm-3 s. R02 also found Fe K emission in the SW, where shock speeds and plasma temperatures are also relatively low, attributing it to reverse-shocked ejecta. It is interesting to note that the nonthermal continuum in the NW does not show the same morphology as the low-energy thermal emission. Thermal X-rays in that region are well contained to the thin filament seen in Figure 1, but the synchrotron emission appears much more diffuse. We show this in Figure 5. Similar discrepancies were observed in the SW, leading R02 to conclude that the synchrotron emission is associated with reverse shocks driven into the ejecta, and not the forward shock.
We follow the same modeling procedure as for the SW, and fit the spectra with a vpshock model (with high-energy components added as described above). In this region, we jointly fit MOS 1 and 2 data, as this part of the remnant has not been observed with Chandra. The best fit model (reduced = 2.20) has kT = 0.28 (0.27, 0.30) keV and = 9.9 (8.7, 11.1) cm-3 s, with an emission measure (EM) for the thermal component of 2.51 (1.90, 2.91) cm-3 (2.15 (1.63, 2.49) cm-3 ). We let the abundances of C, N (tied to C), O, Mg, Si, and Fe float freely in the model, and find that all are in the neighborhood of solar (using Wilms et al. (2000) abundances), with the exception of Si (1.7 solar) and Mg (0.6 solar). Ne was kept fixed to solar as an anchor for the other abundances, as Ne is not expected in the ejecta of a Type Ia SN, and is not depleted onto grains in the ISM. The overabundance of Si is likely a result of using a single-temperature shock model to fit the data. As we show in Section 5, the shock structure is likely more complicated than this, with varying shock speeds, and a single-temperature shock model with kT = 0.28 keV could underpredict the Si K line at 1.8 keV. The model compensates for this by making Si overabundant. Mg underabundance might be caused by depeletion onto dust grains.
We find a post-shock density from matching IR data of = 2.0 (0.75, 5.0) cm-3 and a radiating dust mass of 1.2 (0.33, 3.6) . The large uncertainties for this region are a result of the errors in the flux measurement (see Section 3.2). The plasma temperature derived from this model is significantly lower than that of Vink et al. (2006), who fit XMM spectra from a similar region in the NW with a two-component NEI model, finding temperatures of and 4 keV. However, our temperature is close to that reported by Helder et al. (2011), although they report lower ionization timescales. The difference is likely due to the fact that our “NW” spectrum is extracted from a region that is farther east than theirs, and much brighter in both X-rays and IR, implying a higher density. Differences also result from different spectral models used.
It is worth noting that the ionization timescales obtained from fitting X-ray spectra, combined with the post-shock densities from fitting IR data, allow a determination of the age of the shock. We obtain ages of and yr for the SW and NW, respectively. These ages, derived from plane-shock model fits, are underestimates for the true age of the remnant (Borkowski et al., 2001b), but do strongly favor a young SNR, strengthening the case for RCW 86 as the remnant of SN 185 A.D. Where dust is present and X-ray spectra of the swept-up ambient medium can be examined, this method provides a useful check on the ages of young SNRs.
In modeling dust emission from the post-shock environment, we focus only on the Spitzer data, as the wavelengths covered with Spitzer are more appropriate for the bulk of the dust emission seen in an SNR. WISE data at 22 m do not further constrain the models discussed later, and 12 m data are sensitive to a poorly-understood hot dust component, likely from very small dust grains which are stochastically heated. The IR model above predicts a flux of 100 mJy at 12 m, while the measured flux from WISE in this region is 430 mJy (albeit with a error). A similar excess of short-wavelength IR emission above a model fit to 24 and 70 m was found in our Spitzer analysis of Kepler’s SNR (Blair et al., 2007). Emission at this wavelength would likely come from very small dust grains, and the physics of collisional heating and sputtering of such small grains is not well understood. See Section 3.3 of Blair et al. (2007) for further discussion of the difficulties in modeling short wavelength IR emission. However, this emission from very small grains should have little effect on the overall properties derived from the IR fits. If the 70 m data were ignored, and only the 12 and 24 m data were fit with a single-temperature grain model, the temperature of the grains would be 190 K, and the radiating mass would be only 2.4 . Nevertheless, it is worth noting that significant work still needs to be done to understand short-wavelength IR emission from dust in SNRs.
3.6 Dust-to-Gas Mass Ratio
Dwek et al. (1987) provide theoretical predictions for the ratio of the total IR luminosity to the 0.2–4 keV X-ray luminosity, a quantity that they refer to as the IRX ratio. At the temperature of the NW region, this ratio should be . Our dust model calculates the amount of sputtering of grains in the post-shock gas, and for the NW region we find that 19% of the total dust mass has been destroyed. Accounting for this mass, and considering only the unabsorbed thermal component (vpshock) of our X-ray spectral fit described above, we find an IRX ratio of 1.65, lower than the predicted value by a factor of 20, which implies a dust-to-gas mass ratio for the pre-shock ISM lower than the standard Galactic value assumed by Dwek et al. (1987). The IRX ratio for the SW region is 1.4.
We can approach this issue in another way. The X-ray EM for the thermal component in the NW region is 2.15 cm-3 . Since we have (from the IR fits) an independent determination of the post-shock density, we can divide this out of the EM and get the amount of gas that has been swept up by the shock, which is roughly a solar mass. Normalizations to the IR spectra give the radiating dust mass, and dividing these two gives another measure (also distance-independent) of the dust-to-gas mass ratio, 1.37 , where we have accounted for 19% of the mass in grains being destroyed via sputtering. The typical value for the dust-to-gas mass ratio in the Milky Way is 7.5 (Weingartner & Draine, 2001). We thus confirm our finding from above of a low IRX ratio, with a dust-to-gas mass ratio that is roughly a factor of 5 too low. The discrepancy between an IRX ratio that is 20 times too low and a dust-to-gas mass ratio that is 5 times too low primarily results from the assumption by Dwek et al. (1987) that the plasma is in collisional ionization equilibrium (CIE). In models for the X-ray emission from RCW 86, the plasma is in a non-equilibrium ionization state, which significantly raises the amount of X-ray emission when compared to a CIE model. For example, if kT = 0.35 keV and = cm-3 s, a plane-shock model will produce times more X-ray emission than a Raymond-Smith plasma in CIE.
We arrive at a similar conclusion in the SW, where the dust/gas mass ratio is found to be 1.3 , but note that both of these methods will miss any dust that is too cold to emit at 70 m. Similar dust/gas mass ratio shortfalls have been observed in SNRs in both the Galaxy (Blair et al., 2007; Arendt et al., 2010; Lee et al., 2009) and the LMC (Borkowski et al., 2006; Williams et al., 2006, 2011).
4 Progenitor Type of RCW 86
The nature of the progenitor SN of RCW 86 is uncertain, with most authors favoring a CC origin. Support for the CC model primarily comes from Westerlund (1969), who placed the location of the SNR within an association of ten B-type stars at a distance of 2.5 kpc (although one of these stars is likely a foreground object, and another has a doubtful association based on its distance). These stars are spread out over a much larger region of space than the periphery of the SNR. Recent optical studies of the remnant have used line kinematics of the narrow H components of various shocks in the remnant, along with Galactic rotation curves, to place the distance to the remnant at 2.3-2.8 kpc (Sollerman et al., 2003; Rosado et al., 1996), confirming that the remnant and the OB association are at approximately the same distance.
However, this proximity to the association does not preclude a Type Ia progenitor much older and less massive than the B-type stars found in this region of our Galaxy. This is illustrated by N103B, a young remnant in the Large Magellanic Cloud known to be the result of a Type Ia SN, that is apparently associated with the H II region N103. Badenes et al. (2009) examined the local star formation history near N103B and found a prominent extended peak between 100 and 50 Myr. A mixture of young and old stellar populations is likely present near RCW 86 as well, so both Type Ia and CC explosions may occur at this particular location within our Galaxy.
Secondary support for the CC origin comes from the suggestion, first made by Vink et al. (1997), that RCW 86 is an explosion into a cavity. Cavity explosions are typically associated with CC SNe and the strong winds that some massive stars may blow off prior to explosion. However, as shown in Hachisu et al. (1996) and Badenes et al. (2007), accreting WD systems, the progenitors of single-degenerate Type Ia SNe, can also create substantial wind-blown cavities.
Both the arguments in favor of a CC origin are valid, but are circumstantial and based on general associations rather than specific observations of the remnant. Here, we critically examine available observations of RCW 86, and find that the remnant is more likely the remnant of a Type Ia SN.
1. Balmer-dominated shocks. The entire periphery of the remnant shows H emission from non-radiative shocks encountering at least partially neutral material (Smith, 1997). The mechanism for this H emission is described in Chevalier et al. (1980). At the densities derived above from IR observations, H recombination times are yr. Most CC SNe ionize the surrounding medium in one of two ways, either from the radiation from the shock breakout (in the case of a red supergiant) or before the SN from the ionizing flux from the progenitor star itself (in the case of a Wolf-Rayet star). A hot, compact progenitor of a stripped CC Type Ib/c SN would produce relatively few ionizing photons in the explosion, but would have a strong ionizing flux before the explosion, as the progenitors of these SNe are massive O-type stars during their main-sequence lifetime, which proceed through a luminous blue variable (LBV) phase to shed their H (and possibly He) envelope, becoming Wolf-Rayet stars. Less massive (), cooler stars will be red supergiants (RSG) at the time of the explosion. While they are too cool to ionize material beforehand, their large size results in a large ionizing flux at shock breakout. Chevalier (2005) discusses the ionizing radiation from the shock breakout of a CC SN. For the amount of mass that the shock has encountered in RCW 86 (as constrained from model fits to IR data; see Section 5), explosions of RSGs (R ), including Type IIP, Type IIL, and even Type IIb SNe like 1993J (Woosley et al., 1994) are likely ruled out, as they produce more than enough ionizing radiation. The progenitors of Type IIn SNe are generally thought to be extremely massive () O-type stars which evolve through an LBV phase (Gal-Yam et al., 2007), although Smith et al. (2009) point out that LBVs may not be the only possible progenitors of Type IIn SNe, and that they may arise from red supergiants as well. In either case, the mass contained in the CSM is enormous, and there is no evidence in RCW 86 for interaction of the blast wave with a dense CSM. The only remaining CC scenario which cannot be ruled out from this perspective is an explosion of a blue supergiant (BSG) progenitor with a massive H envelope, such as SN 1987A, producing only a modest number of ionizing photons, but see points 2 and 3 below.
2. Fe abundance in ejecta. Even if some CC models cannot be ruled out from argument 1, all CC SNe produce large amounts of O with respect to Fe in the ejecta (Woosley & Weaver, 1995). There is no evidence for super-solar O abundances anywhere in the remnant; both the spectra from the NW and the SW are consistent with typical ISM abundances for O. Fe L-shell emission is consistent with solar abundances as well (see Table 1), but Fe K emission cannot be explained by this model. The properties of the fits listed in Table 1 indicate that we are seeing shocked ISM. The 6.4 keV line observed in both regions is most easily explained by a high-temperature (5 keV), low ( cm-3 s) plasma. As R02 and Ueno et al. (2007) point out, a plasma at this temperature requires collisionless heating of electrons at the reverse shock. An O-rich and Fe-rich plasma in such a low ionization state does not produce L-shell emission from Fe, but H and He-like O K-lines are expected to be prominent, even if the ionization age of the plasma is lowered to a few 108 cm-3 s. A study of X-ray emission in the SW using Suzaku found a lower limit of 0.05 of Fe from a region covering 7% of the remnant’s surface area (Ueno et al., 2007). A similar study of the eastern limb by Yamaguchi et al. (2008a) found of Fe (with a possible upper limit an order of magnitude higher) from a region covering 2.5% of the remnant. As we show in Section 5, we find in the NW, from a region containing 1.5% of the remnant.
Can oxygen simply be hidden? This would require a very low ionization state of the gas. Ueno et al. (2007) derive their Fe mass listed above by assuming that the electron density in the shocked ejecta is 0.1 cm-3, and that the ejecta were shocked 1000 years ago. They consider this electron density to be an upper limit, as anything higher would raise the ionization timescale of the gas to levels ( cm-3 s) that would result in strong Fe L-shell lines. Lowering the density to the point where oxygen lines would be weak, say, at = 108 would raise the amount of Fe in the SW region by a factor of 30, to 1.5 . While this amount of Fe appears excessive even for a Type Ia SN, it would also rule out all but the most exotic CC explosions. In the NE, Yamaguchi et al. (2008a) fit the centroid of the Fe K line with Suzaku, and found = 2.3 cm-3 s, a sufficient timescale to produce strong O lines, yet none are reported.
3. BSG Incompatibility with Observations. Gvaramadze & Vikhlinin (2003) proposed that the remnant is the result of the explosion of a BSG, moving through a bubble that the progenitor created during its main sequence lifetime. A large amount of mass may have been expelled at the RSG stage, facilitating transformation into the BSG. While the large amount of Fe seems to rule out any CC progenitors, there are two other arguments against this particular scenario. First, a slow wind blown at the RSG stage is expected to be nitrogen-rich, as observed in the CSM of SN 1987A (McCray, 1993), but no nitrogen enhancement has been reported (Leibowitz & Danziger, 1983). Secondly, the explosion of a massive blue supergiant, such as the progenitor of SN 1987A, leads to the formation of an iron-nickel bubble (Li et al., 1993). As shown in Williams et al. (2008), an iron-nickel bubble forms dense clumps of O-rich material, which should show strong optical or X-ray emission. Again, no O-rich ejecta have ever been reported in this remnant. The failure of this elaborate CC scenario demonstrates the difficulty in finding a plausible CC model for RCW 86.
4. Lack of central point source or pulsar-wind nebula. While CC explosions, such as Cas A (Pavlov et al., 2000), often leave behind a compact remnant, Type Ia explosions should not. Fesen et al. (1979) conducted an optical survey of several known historical SNRs in the Galaxy, finding no central point source in RCW 86 consistent with a compact remnant down to a magnitude of 18.5. Gvaramadze & Vikhlinin (2003) report the possibility of a point source from a compact object in the Chandra observations of the SW shell. However, this source is located near the edge of the remnant, and if associated with the supernova of 185 A.D., the transverse velocity of the source would be in excess of 5000 km s-1, even assuming an off-center explosion. Kaplan et al. (2004) conducted a search with Chandra of the interior of the remnant, finding no neutron star (down to a limit of one-tenth the luminosity of the Cas A neutron star) or pulsar-wind nebula. They assume the maximum reported distance of 2.8 kpc, and note that their limits would be even more constraining if the remnant were closer. However, their Chandra field of view does not cover the entire remnant, and they are unable to rule out less likely compact objects, such as massive neutron stars, neutron stars with exotic interiors, and quiescent black holes. Kaspi et al. (1996) find no radio pulsar down to a limit of 1.3 mJy at 436 MHz and 0.2 mJy at 1520 MHz. No pulsar-wind nebula has ever been reported in the radio.
Despite the previously mentioned proximity to an OB association and the suggestion that RCW 86 is the result of a cavity explosion, the specific characteristics of the remnant are more easily explained by a Type Ia explosion. We cannot definitively rule out all CC progenitors, but we can say that any such event would be a very unusual CC SN. It would have to produce significant amounts of Fe relative to O in the ejecta, while being a weak source of ionizing radiation, either before the SN or during the shock breakout phase. Its pre-supernova winds would be inconsistent with the nitrogen-rich wind expected in the transition from an RSG to a BSG, and any compact remnant left behind would have to be less than one-tenth as luminous as the neutron star in Cas A.
It is possible to confirm or refute the conclusion of RCW 86 being a Type Ia SN. Light echoes from historical SNe can reflect the spectrum of the SN event itself, and matching of detected echoes with SN spectral templates has been used in several cases to determine the SN type (Krause et al., 2008). Detection of a light echo spectrum from this remnant that could be matched to a Type Ia template would confirm our conclusion. A caveat to this method is that not all thermonuclear explosions of white dwarfs look like Type Ia SN. A notable case of this is SN 2002ic, where a strong H emission line was detected in the spectrum of a thermonuclear SN (Wang et al., 2004). Alternatively, detection of a compact remnant (neutron star, pulsar-wind nebula, or black hole) that is definitively associated with the remnant would clearly imply a CC explosion. Finally, although the remnant does not belong to the “O-rich” class of SNRs (a group of approximately half a dozen SNRs categorized by strong optical oxygen emission), it is still possible that deep X-ray observations of the center of the remnant could show oxygen in the ejecta.
5 Hydrodynamic Modeling
Perhaps the most puzzling aspect of RCW 86 is its large size, given its likely association with the supernova of 185 A.D. At a distance of 2.5 kpc, the diameter of the remnant is pc, requiring an average shock speed of km s-1. Measured shock speeds vary greatly within the remnant. In the regions of interest considered in this paper (where the shell is detected at both 24 and 70 m), shock speeds from optical spectroscopy are 500-700 km s-1 (Rosado et al., 1996; Ghavamian et al., 2001) , while shock speeds in the eastern limb from the proper motion of X-ray emitting filaments have been reported as high as 6000 ( km s-1 (Helder et al., 2009). The detection of thermal X-ray emission at ionization timescales of 6 – 10 cm-3 s distinguishes this remnant from SN 1006, another young remnant of a Type Ia explosion that is very large for its age. There, ionization timescales are shorter by nearly an order of magnitude (Yamaguchi et al., 2008b).
Badenes et al. (2007) considered models of Type Ia explosions into bubbles blown by accretion wind outflows from the progenitor system, noting that most known Type Ia Galactic SNRs are inconsistent with this scenario. However, they note that RCW 86 may be the exception to this, and could in fact be the result of just such an event. The mechanism for the creation of the winds modeled by Badenes et al. (2007) is described in Hachisu et al. (1996). A high mass accretion rate from a red-giant (RG) or main-sequence companion onto a white dwarf (WD) can lead to the formation of a large, loosely bound envelope surrounding the WD. This envelope is optically thick, and continuum-driven winds from the WD can eject several tenths of a solar mass from the system. The wind stops when the mass transfer rate falls below yr-1, which can be as long as 10 yr before the WD accretes enough mass to reach the Chandrasekhar limit.
We perform hydrodynamic simulations of Type Ia explosions into various surroundings using VH-1, a numerical hydrodynamics code developed by J. Blondin and collaborators based on the piecewise parabolic method of Colella & Woodward (1984). We use the exponential ejecta density profile of Dwarkadas & Chevalier (1998), and assume (except where otherwise noted) an explosion energy of 1051 ergs and an ejected mass of 1.4 . Densities reported below are in units of either H atoms cm-3, where we use a scaling of gm cm-3, appropriate for an ISM with a 10:1 H:He ratio, or in amu cm-3. We seek solutions which approximately reproduce the known age, radius, and velocity. Radius is a difficult quantity to determine for the somewhat unusual morphology of RCW 86. We chose a point at the approximate geometric center of the remnant and measure (assuming kpc) radii of 12 and 13 pc to the NW and SW filaments, respectively. Since the NW represents the simpler geometry of the two filaments, we chose 12 pc as the radius to be reproduced in the hydro simulations.
5.1 Explosion into a Uniform Medium
We begin with the simplest case, an explosion into a medium with constant density, as modeled in Dwarkadas & Chevalier (1998). In a 1-D hydro model, assuming the standard explosion parameters above, the forward shock can reach the desired radius in 1825 years by encountering a constant density of = 0.033 cm-3. In addition to the density in this model being more than an order of magnitude below that required to produce IR emission in the NW and SW, the current forward shock velocity in this model is = 3000 km s-1, well above that measured from optical spectroscopy.
An alternative model can reach 12 pc with a current shock velocity of 600 km s-1 by encountering a medium of = 0.75 cm-3. While this model is consistent with both the measured shock velocities and the inferred densities from IR, the time required for this shock to reach the observed radius is 7000 years, ruling out an association with SN 185 A.D. A third option is to require the shock to decelerate to 600 km s-1 in 1800 years, but this model requires an ambient density of = 40 cm-3 and places the current radius of the forward shock at 3.2 pc. The distance to the remnant derived from this value would be 650 pc, well inside any previous distance estimates. Similar calculations show that reasonable under- or over-energetic SNe likewise fail to reproduce anything close to the observed remnant.
5.2 Wind-Blown Bubble Model
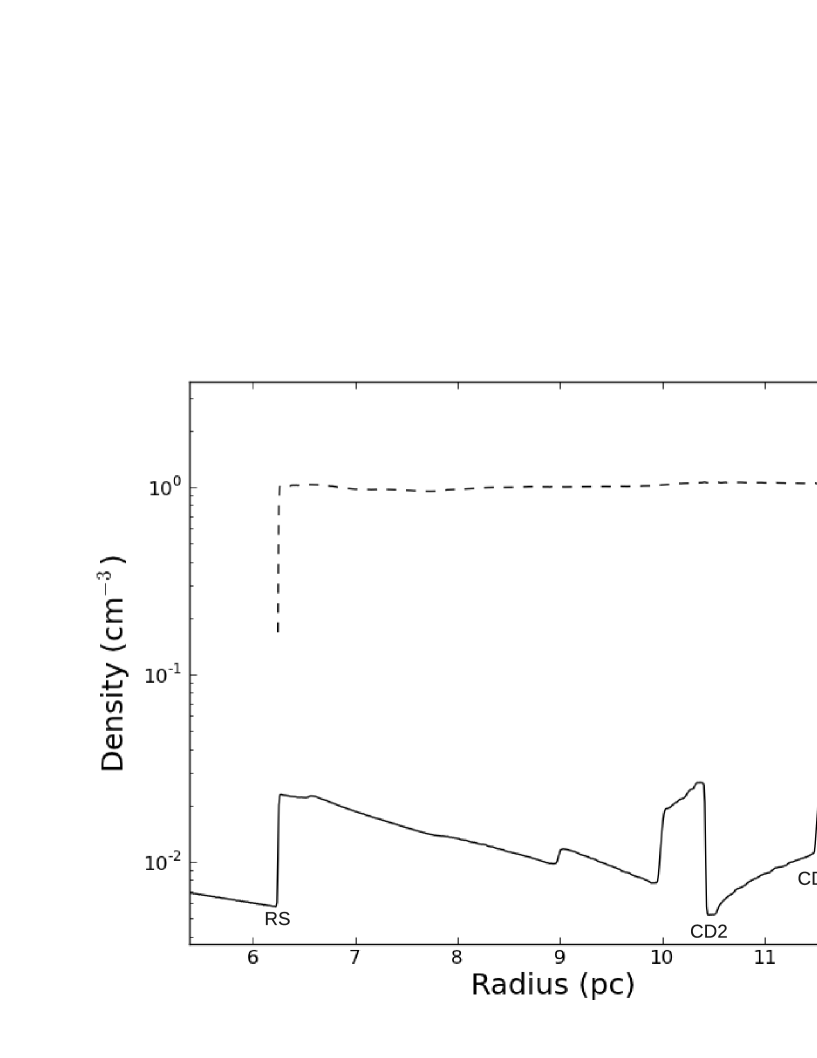
Given the results of models discussed above, we can rule out the case of a blast wave from an explosion in 185 A.D. encountering a uniform ambient density. The next level of complexity that we consider is a low-density, uniform bubble (region I) surrounded by higher-density, uniform ISM (region II). A constant wind blown from the progenitor system would lead to an density profile, but a uniform bubble could be created by simply switching off the wind a few thousand years prior to the explosion; delay times prior to explosion in Badenes et al. (2007) are well in excess of this in most cases. Since our IR modeling gives us a direct measurement of the post-shock density of the material recently shocked, we have one more constraint to use in these models, and we fix the ambient density in the ISM to the post-shock density from IR fits ( cm-3) divided by a compression ratio of 4, i.e. = 0.5 cm-3. With this number fixed, the number of free parameters in our bubble model is only two: the density within the bubble, which we define as , and the location of the bubble “wall,” which we define as .
We find a good fit to the observed radius and age from a model with = 0.002 cm-3 and = 10.8 pc. The current shock speed in this model is 740 km s-1, which roughly agrees with the 600-700 km s-1 shock speeds measured from optical data in the NW and SW, respectively. We show the density profile from a one-dimensional (1-D) simulation of this scenario in Figure 6. In this model, the shock races through the low-density bubble in 725 years, reaching the shell with a velocity of 8900 km s-1. Upon hitting the shell of density contrast 250, the transmitted shock speed into the dense material is 1300 km s-1. Borkowski et al. (1997) provide an analytic estimate for the transmitted shock speed when transitioning from a bubble to a dense shell. If is the density ratio, , between the dense shell and the bubble, then the pressure jump, , is
| (1) |
and the transmitted shock speed is
| (2) |
where is the speed of the shock when it reaches the wall. With = 250 and = 8900 km s-1, the transmitted shock speed in this approximation is 1250 km s-1.
The shock has been in the dense ISM for 1175 years, sweeping up a total mass of . The reverse shock, meanwhile, has shocked virtually all of the ejecta (1.2 ). The ionization timescale of the forward shocked material implied by this model, = 8.9 cm-3 s, agrees quite well with the values of 9.8 cm-3 s and 6.0 cm-3 s derived from X-ray fits to the NW and SW. We can use a semi-analytic approximation to check the final shock speed (740 km s-1), by assuming that the internal energy in the shocked ejecta is the dominant energy component, significantly greater than the internal energy in the shocked shell or the kinetic energies of the ejecta and shell material. In this approximation, the forward shock is completely driven by the pressure of the shocked ejecta, and the shock speed is given by , where is the thermal pressure, . For an explosion energy of 1051 ergs and = 10.8 pc, p = 4.3 ergs cm-3. In this approximation, = 700 km s-1. In reality, the internal energy of the shocked ejecta, obtained by numerically integrating the output of the hydro model, is greater than the sum of the kinetic and internal energies of the shocked ISM, so this approximation is not entirely valid, but the general agreement is encouraging.
Once the assumption of a uniform ambient density is abandoned, the parameter space for possible density structures that the shock can encounter is vast. The solution above of a shock running through a low-density bubble and encountering the much higher density ISM is not unique, but it is not our aim to explore every possible scenario. This model represents the simplest solution consistent with the available observed constraints. It is interesting to note that while we do not use the models of Badenes et al. (2007) as a constraint in any way, the best-fit model listed above looks remarkably like model H1 from their paper, which consists of a white dwarf of 1 in a binary system with a donor star of 2 , with an initial period for the system of 2 days. The total mass lost by the system is 0.15 , with an outflow velocity of 1000 km s-1, and the time between the onset of the final mass transfer and the SN explosion is 5 yr. The “bubble” created by this system has a roughly constant density of 0.001 cm-3 with a shell wall located at pc. The density in the ISM is fixed at 0.42 cm-3, with the exception of a shell at the bubble-ISM interface with a density higher by a factor of . We assume that the blast wave is contained within this shell.
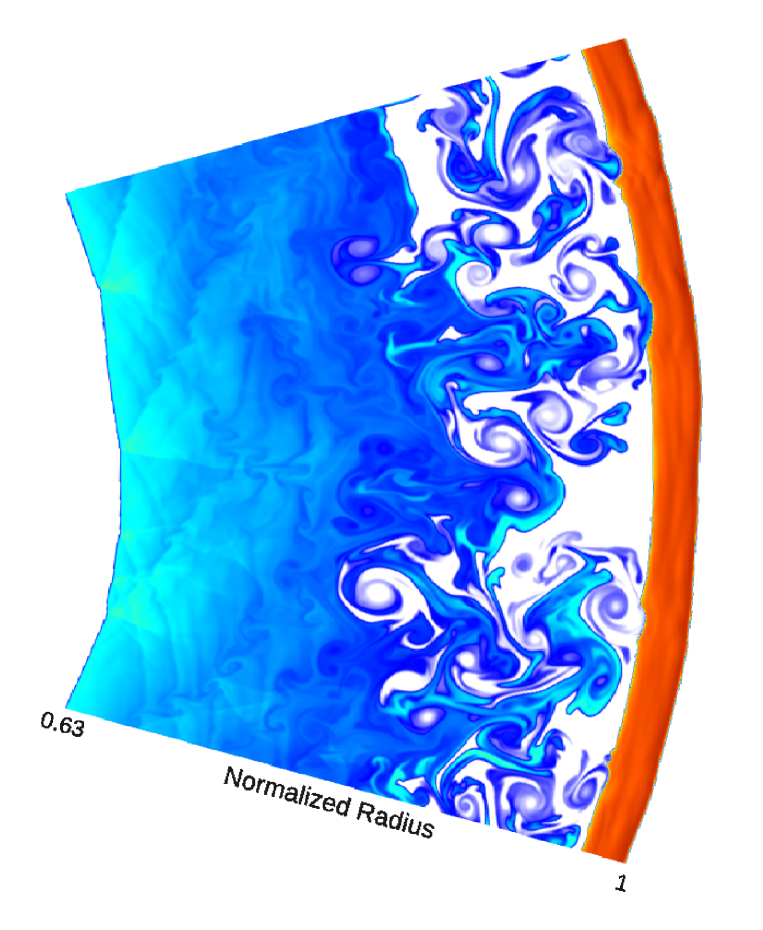
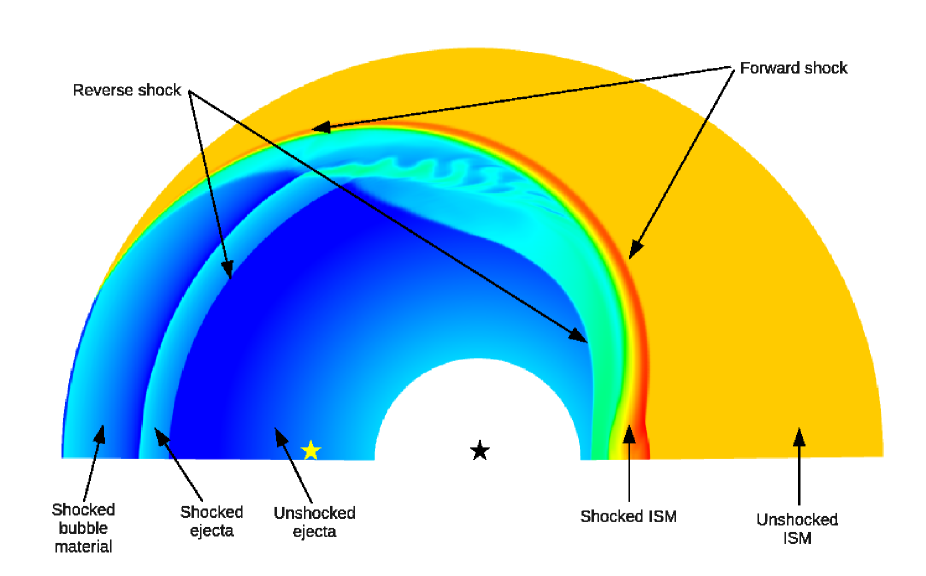
This model also provides an explanation for the Fe K line seen in the X-ray spectrum from the narrow extraction region in NW, where the elliptical region is quite narrow compared to the shock radius. The extraction region, shown in Figure 1, begins at a radial distance of 93% of the forward shock radius. Shocked ejecta cannot exist this far out in the 1-D model, but this is only indicative of the limitations of modeling a multi-dimensional system in 1-D. In two dimensions (2-D), the instabilities generated by the interaction of the blast wave with the density profile in the bubble model allow the ejecta to pile up quite close to the forward shock. We show the output of a 2-D model at the current age of the remnant in Figure 7, which shows significant amounts of shocked ejecta at a radius of of the forward shock radius.
We can also use the output of the hydrodynamic modeling, combined with X-ray spectroscopy, to estimate the amount of reverse-shocked Fe present in the NW extraction region. The EM, as fit to the Fe K line in the XMM-Newton spectrum for the Fe-only component, is 7.2 cm-3 . The hydro models give the density in the reverse shocked ejecta, which over the small range of interest ( 93% of the forward shock radius) is roughly constant at 1.38 amu cm-3. If this is all Fe, then = 2.5 cm-3. If we assume 10 free electrons per Fe atom (to avoid ionizing Fe to the point of producing Fe L-shell emission), then an electron density of 2.5 cm-3 leads to an Fe mass of 3 , a lower limit given the approximations used. This is a relatively small amount of iron, but the size of the extraction region for the NW covers only about 1.5% of the surface area of the remnant. As we mention in Section 4, similar calculations by Ueno et al. (2007) and Yamaguchi et al. (2008a) find a lower limit of 0.11 of Fe from less than 10% of the area of the remnant.
5.3 Off-Center Explosion
Despite the general agreements listed above between our 2-D hydrodynamic model and the measured properties of the remnant, one thing this model cannot account for is the extremely high shock speed reported for the NE limb, found from Chandra proper motions to be 6000 km s-1 (Helder et al., 2009). Our hydro model assumes spherical symmetry for the distance from the explosion to the shell wall, and this symmetry must be broken to explain shock speeds that differ by an order of magnitude from one side of the remnant to the other. It is beyond the scope of this paper to provide a detailed multi-dimensional model to explain the morphological “squareness” and varying shock speeds of RCW 86; such a model would undoubtedly be highly complex. Rather, we seek the simplest case that can broadly explain the observations, that of an off-center explosion into a wind-blown bubble, in which the shock has not yet reached the bubble wall in the NE.
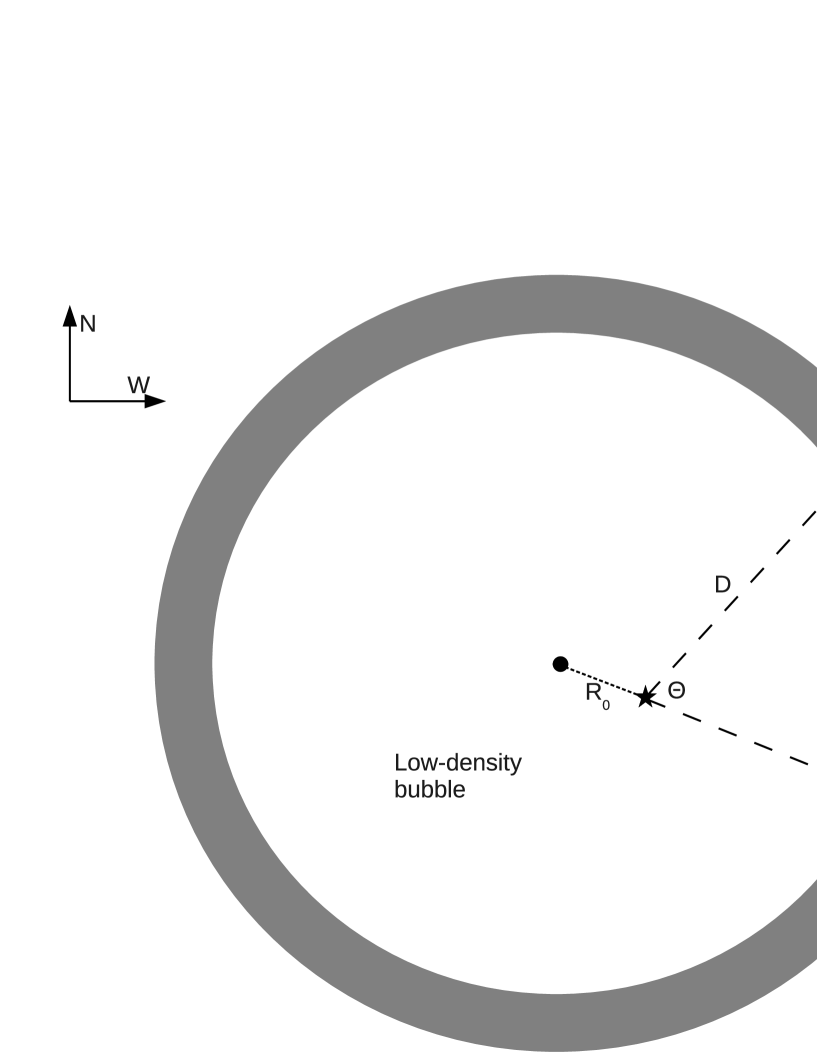
We assume that the wind-blown bubble is symmetric with a radius of 12 pc. We then vary the distance, R0, from the center of the bubble to the center of explosion. R0 is the only free parameter in this model; we assume the same bubble and shell densities as above (n0,I = 0.002 cm-3 and n0,II = 0.5 cm-3). In this model, the distance, D, from the center of explosion to any point on the wall of the shell is given by
| (3) |
where is the fixed radius of the shell wall (in this case, 12 pc) and is the polar angle between the center of explosion and a point on the shell wall. A diagram of the geometry of this model is shown in Figure 8. In 2-D, we model this as a semi-circle from 0 to radians, using a spherical geometry with reflecting boundary conditions at 0 and .
Within this symmetric shell model, a significant offset of the explosion from the center of the bubble is required for a shock that roughly reproduces the observables (shock velocity, density, age) in the SW, yet still allows for the extremely high shock speeds in the NE. To avoid hitting the far side () of the shell wall in 1825 yr, must be at least 7 pc. Assuming this value, the shock encounters the shell wall on the near side (; the SW corner of the remnant) in yr, and reaches a final radius (with respect to the center of the remnant) of 13.5 pc with a velocity of 1000 km s-1. The hydrodynamic output of this model is shown in Figure 9. Rosado et al. (1996) estimated the shock velocity in the SW region to be 800 km s-1. At , which would roughly correspond to the location of the NW filament, the shock hits the filament in yr, reaching a final radius (with respect to the center of the remnant) of 12.7 pc with a velocity of 550 km s-1, numbers which agree quite well with observations. This model implies that the shock has only recently encountered the shell in the E and SE. The ionization timescale of the shocked ISM in the E, as reported by Yamaguchi et al. (2008a), was 7.7 cm-3 s. This is rather high for a recently shocked shell, but the authors point out that densities in this region are likely much higher than the rest of the shell, and that the ionization timescale of the reverse shocked Fe implies a shock age of yr. Thus, there is a broad consistency of observable parameters with the off-center explosion model, including the transition from thermal to nonthermal X-rays in the NE corner of the remnant, where, in our model, the shock has not yet hit the bubble wall. Getting the progenitor system away from the center of the bubble does not require excessively high velocities. If the delay time between the onset of the fast wind and the SN explosion is as little as 105 years, a velocity of 65 km s-1 would cause an offset of 7 pc. Delay times of years or more require velocities of only a few km s-1.
6 Synchrotron X-rays
The nonthermal X-ray emission from RCW 86, especially in the SW, differs in some important ways from that seen in other young SNRs. Most young SNRs show synchrotron X-rays concentrated in “thin rims” at the periphery (see Reynolds 2008 for a review). These rims are commonly assumed to be limited in thickness by the distance an electron can advect with the post-shock flow in a synchrotron loss time (Vink & Laming 2003; Parizot et al. 2006). However, in RCW 86, most synchrotron emission is more diffuse, except for the E and NE edges. The spectrum in the SW can be well described by emission from a power-law electron distribution with exponential cutoff (model srcut in XSPEC) (R02). The characteristic “rolloff” frequency (critical, not peak, frequency of electrons with the e-folding cutoff energy ) is about Hz (R02), implying TeV, where . R02 showed that, given a geometric effect that can speed up particle acceleration in perpendicular shocks (Jokipii 1987), shocks of the speed of the optical nonradiative shocks in the SW ( km s-1) could accelerate electrons to this energy. However, without this obliquity effect, shock velocities in excess of 1000 km s-1 are more typically required. Such shocks have not been present in the SW since the collision about 1500 yr ago of the blast wave with the bubble wall. However, at that time the blast-wave speed was of order 10,000 km s-1 in our scenario, and acceleration to very high energies (100 TeV or above) would have been possible due to the strong dependence of maximum energy on shock speed ( for loss-limited acceleration). In this case, presumably a “thin rim” morphology would have resulted, but the rolloff frequency would have been considerably higher than observed today. But electrons with energies below of that time have longer lifetimes: the time for an electron of energy TeV to lose half its energy is yr. Combining this with the relation between energy and characteristic frequency, we find that electrons with characteristic frequency can survive for a time if they radiate in a magnetic field less than
(We note that if G, the magnetic-field strength with energy density of the cosmic microwave background (CMB), then inverse-Compton losses from CMB photons will dominate synchrotron losses. However, this is unlikely to be the case in RCW 86 or other young SNRs.) For RCW 86, electrons with Hz can survive for 1500 yr if G.
Synchrotron emission from electrons accelerated over 1500 years ago would not be expected to be concentrated in thin rims; it could occupy the entire region of shocked bubble material, and would appear in projection as diffuse emission extending back into the remnant interior, as observed. For younger remnants like Tycho, thin rims (according to the synchrotron-loss scenario) imply much higher magnetic fields which would deplete all electrons capable of producing X-rays. However, in RCW 86 and perhaps other cavity explosions, it is natural to expect diffuse, long-lasting synchrotron X-ray emission, as long as magnetic field strengths remain relatively low. Acceleration to very high energies, while the blast wave is still inside (or within) the bubble, would produce a population of electrons that could go on emitting a synchrotron spectrum up to X-ray energies, even if the subsequent shock transmitted into the dense surroundings rapidly becomes too slow to accelerate electrons to TeV energies.
A detailed analysis of the X-ray synchrotron emission from all around the periphery of RCW 86 is beyond the scope of this paper, but should be undertaken to test this suggestion and to clarify the current state and past history of electron acceleration in RCW 86.
7 Gamma-Ray Emission
We can use our IR fitted densities to make an order of magnitude estimate regarding the gamma-ray emission observed. In the hadronic model of gamma-ray emission, cosmic-rays escaping the shock collide with thermal gas particles, producing particles which decay into gamma-rays. The 1-10 TeV spectrum from H.E.S.S. is fit with a photon index of = 2.41 (Aharonian et al., 2009). If extrapolated back to 100 MeV, this gives a luminosity, Lγ,100MeV = 1.19 photons s-1. Using the gamma-ray emissivity from Drury et al. (1994), the energy density in relativistic particles for a spherical SNR required to produce a -ray luminosity of Lγ by this process is
| (4) |
where Lγ,100MeV is the luminosity, in photons s-1, of 100 MeV -rays, d is the distance to the remnant, is the radius of the remnant in arcminutes, is the post-shock proton density, and qγ is the production rate of -rays, in units of s-1 erg-1 cm3 H-1. We take a representative value from Drury et al. (1994) of qγ = 5 and calculate = 5.1 ergs cm-3 for RCW 86. If we make the (admittedly crude) assumption that the NW filament typifies the entire remnant, then the total energy density () of the thermal gas is 4.2 ergs cm-3. In this case, = 12, requiring an order of magnitude more energy going into relativistic particles than is available in the shock. A more realistic value for this ratio, 0.1, requires a flattening of the gamma-ray spectrum below 1 TeV to = 1.9. We thus confirm the conclusions of Aharonian et al. (2009), who based their argument for the low-energy hardening of the -ray spectrum on the total energy from the SN of ergs.
Any particle acceleration occuring in the remnant would rob the post-shock gas of energy, raising the shock compression ratio across the shock. We cannot determine this ratio directly, since we do not have a direct measure of the emitting volume of the NW region. However, since we have the post-shock density and total shocked gas mass, the volume for a “standard” shock with a compression ratio of 4 would be 1.52 cm3. Assuming kpc, the projected radii of the elliptical region are 4.7 and 0.62 pc for the major and minor axes, and the line-of-sight depth through the filament would be 4.3 pc, a factor of 7 greater than the radial width. This is the minimum line-of-sight, as anything shorter would imply a CR 4.
8 Concluding Remarks
Spitzer and WISE mid-IR images show the complete shell of RCW 86, with the dominant source of emission being warm dust grains heated and sputtered in the post-shock environment. A combined IR/X-ray analysis yields post-shock densities in the non-radiative regions of the NW and SW of = 2.0 cm-3 and 2.4 cm-3, respectively, with % of the dust in these regions destroyed via sputtering. Based on the IR/X-ray flux ratio, we find that the dust/gas mass ratio in the pre-shock medium is lower by a factor of from that typical for the Galaxy. The post-shock gas densities derived from IR observations place strong constraints on the total amount of mass that has been encountered by the shock, and favor a young age for the SNR, strengthening the case for an association with SN 185.
X-ray and optical evidence points to a Type Ia origin for the progenitor of RCW 86. The presence of Balmer-dominated shocks around the periphery of a young SNR means that the blast wave is encountering neutral material, and most CC SNe ionize significant portions of the surrounding ISM, much more than is observed here. There are SNRs which are believed to be the result of explosions within a cavity and show Balmer emission at the shock front (e.g., the Cygnus Loop, believed to be the remnant of a CC SN), but these are older objects where the forward shocks have encountered significantly more mass (the swept mass of the Cygnus Loop is likely , based on the densities obtained by Sankrit et al. (2010) and Raymond et al. (2003)). Not all CC explosions can be ruled out because of the H emission, but the amount of Fe in the ejecta relative to O and other elements also indicates a Type Ia origin. The X-ray analyses of the amount of Fe relative to O in the ejecta have been taken from references already in the literature, but the constraints on the ionizing flux from the progenitor come from the new IR observations presented here. There is additional evidence to support the claim that RCW 86 is the result of a Type Ia SN, in that blue supergiant explosions, which may avoid ionizing the surrounding medium, are incompatible with optical observations, and that no compact remnant or pulsar-wind nebula has ever been detected.
Most intriguingly then, we find that if RCW 86 is the remnant of 185 A.D., and is also the result of a Type Ia SN, then the only self-consistent model to explain the IR, X-ray, and optical observations is that of an explosion into a cavity created by the progenitor system, a model which requires a single-degenerate progenitor. We used one and two-dimensional hydrodynamic models to arrive at this conclusion, finding that a simple model of an explosion in a low-density bubble surrounded by a higher density shell can approximately reproduce observed shock radii, velocities, and post-shock gas densities. The density contrast between the bubble and the shell is 250. This model does not require an appeal to any special circumstances, such as an exceptionally recent encounter with the shell wall or a sub/super-energetic explosion. The high proper motion of the X-ray emitting filaments in the NE, and thus the inferred high shock speed there, requires the explosion to be off-center, so that the shock in that region has not yet encountered the dense shell. In this model, the blast wave began encountering the dense ISM yr ago and continues to impact parts of the shell.
The fast, synchrotron X-ray emitting shocks in the NE are still encountering ionized material within the bubble, and thus no Balmer emission should be expected from these shocks. In the places where the shock is encountering the shell of the bubble, it does so at an oblique angle. X-ray proper motion measurements are sensitive to the speed at which the shock moves as it encounters the shell, which is km s-1 in the 2-D hydrodynamic model. The broad H line width, on the other hand, will reflect the post-shock temperature within the dense shell, where the transmitted shock is considerably slower. In our hydro model, the shock speed of the H emitting shocks within the dense shell is km s-1. We did not adjust this model to match the values for the NE, nonetheless, these values are quite close to the 6000 and 1100 km s-1 shocks reported for that region by Helder et al. (2009).
Thus, this model offers an alternative explanation for the apparent discrepancy between the shock speed measured by proper motions and that derived from optical line kinematics, which Helder et al. (2009) attributed to significant cosmic-ray accleration, with of the shock energy going into cosmic rays. While we do not rule it out, our model does not require any acceleration of cosmic rays at the shock front.
The synchrotron emission in RCW 86 is complicated, with the SW and NW showing more diffuse emission than the NE, where rims are sharper. The bubble model offers a natural explanation for this. In the regions of the remnant where the shock encountered the shell long ago, the electrons were accelerated by much faster shocks than are currently present there. For reasonable values of the magnetic field, these electrons can survive to the current age of RCW 86.
This idea may find applicability in another older SNR traditionally ascribed to a cavity explosion: the Cygnus Loop, where GeV emission has recently been detected by the Fermi satellite (Katagiri et al., submitted). Electrons accelerated early in the life of the Cygnus Loop, while its blast wave moved rapidly through the low-density bubble, could persist for the estimated age of order 10,000 yr (e.g., Levenson et al. 1998) with energies as large as TeV. Such electrons could produce gamma rays by inverse-Compton scattering of various photon fields. As a rough example, 1 GeV photons could be produced from upscattering cosmic microwave background (CMB) photons ( eV) by electrons with Lorentz factors , or electron energies of about 1 TeV. Electrons with these energies could easily survive from an early period of rapid particle acceleration as long as G or so in the regions they inhabit. In a current magnetic field , they would have characteristic frequencies of synchrotron radiation Hz, i.e., in the near-IR, so no nonthermal X-rays would be expected.
Thus, RCW 86 may indeed be the first example of a Type Ia explosion in a system in which the progenitor carved a wind-blown bubble, and can provide new insight into the outflows from accreting systems. While the hydro simulations themselves cannot distinguish between a Type Ia and CC progenitor system, they can rule out the case of a uniform ambient density. We find a general agreement with the parameters of the bubble model necessary to explain the dynamics of the remnant and the simulations of Badenes et al. (2007), who modeled the outflows of single-degenerate Type Ia progenitor systems. In such a system, the companion star would retain its generally high velocity after the explosion. A star in a binary system with a period of a few days can have an orbital velocity, , of up to several hundred km s-1. As shown in the recent work by Kerzendorf et al. (2009), high-resolution spectroscopy to determine the rotational period can test the viability of a potential companion star. The maximum angular distance that a companion star could travel from the center of explosion in 1825 yr is 47 arcsec, where is the velocity of the companion in units of 300 km s-1. Although the center of explosion is currently unknown, it should be possible to identify the companion star from a single-degenerate Type Ia SN. Another promising possibility would be to find the light echo of RCW 86 and obtain a spectrum of the SN itself.
| Model Parameters | NW | SW |
|---|---|---|
| ( cm-2) | 6.25 | 6.53 |
| (keV) | 0.28 | 0.39 |
| ( cm-3 s) | 9.9 | 6.0 |
| C, N, O | 0.89 | 1.12 |
| Mg | 0.57 | 0.63 |
| Si | 1.72 | 1.20 |
| Ca, Fe, Ni | 0.77 | 0.93 |
| EM ( cm-3) | 25.1 | 8.44 |
| 0.6 | ||
| Log (Hz) | 16.85 | |
| F (Jy) | 0.46 | |
| Reduced | 2.21 | 3.05 |
| LX ( ergs s-1) | 11.5 | 6.4 |
Note. — Errors quoted correspond to 90% confidence intervals. Abundances are from Wilms et al. (2000). Models above do not include Fe-only component to account for Fe K- line at 6.4 keV. srcut parameters (, , & F) are frozen to a fit performed only from 2-6 keV. Errors listed are for that fit alone. LX from 0.2-4 keV
| IR Measurements and Modeling | NW | SW |
|---|---|---|
| (Jy) | 0.69 | 0.37 |
| (Jy) | 3.10 | 1.41 |
| 4.5 | 3.8 | |
| 2.0 | 2.4 | |
| 2.4 | 2.9 | |
| Mdust () | 12.3 | 3.2 |
| % destroyed | 19 | 18 |
| LIR ( ergs s-1) | 19 | 9.1 |
| Mgas () | 0.89 | 0.24 |
| MMgas | 1.38 | 1.3 |
| IRX ratio | 1.65 | 1.4 |
| Shock Age (yr) | 1310 | 660 |
Note. — Mdust is pre-shock dust mass encountered by blast wave, i.e., has already been corrected for destruction of grains via sputtering. LIR is total IR luminosity, from 1-400 m. Shock age is calculated by dividing by .
References
- Aharonian et al. (2009) Aharonian, F.A., et al. 2009, ApJ, 692, 1500
- Arendt et al. (2010) Arendt, R.G., et al. 2010, ApJ, 725, 585
- Arnaud (1996) Arnaud, K.A. 1996, in ASP Conf. Ser. 101, Astronomical Data Analysis Software and Systems V, ed. G. Barnes & J. Jacoby (San Francisco, (A:ASP)), 17
- Badenes et al. (2007) Badenes, C., Hughes, J.P., Bravo, E., & Langer, N. 2007, ApJ, 662, 472
- Badenes et al. (2009) Badenes, C., Harris, J., Zaritsky, D., & Prieto, J. 2009, ApJ, 700, 727
- Bamba et al. (2000) Bamba, A., Koyama, K., & Hiroshi, T. 2000, PASJ, 52, 1157
- Blair et al. (2007) Blair, W.P., Ghavamian, P., Long, K.S., Williams, B.J., Borkowski, K.J., Reynolds, S.P., & Sankrit, R. 2007, ApJ, 662, 998
- Borkowski et al. (1997) Borkowski, K.J., Blondin, J.M., & McCray, R. 1997, ApJ, 477, 281
- Borkowski et al. (2001a) Borkowski, K.J., Rho, J., Reynolds, S.P., & Dyer, K.K. 2001a, 550, 334
- Borkowski et al. (2001b) Borkowski, K.J., Lyerly, W.J., & Reynolds, S.P. 2001b, ApJ, 548, 820
- Borkowski et al. (2006) Borkowski, K.J., et al. 2006, ApJ, 642, L141
- Chevalier et al. (1980) Chevalier, R.A., Kirshner, R.P, & Raymond, J.C. 1980, ApJ, 235, 186
- Chevalier (2005) Chevalier, R.A. 2005, ApJ, 619, 839
- Chin & Huang (1994) Chin, Y.-N., & Huang, Y.-L. 1994, Nature, 371, 398
- Clark & Stephenson (1975) Clark, D.H., & Stephenson, F.R. 1975, The Observatory, 95, 190
- Colella & Woodward (1984) Colella, P. & Woodward, P.R. 1984, J. Comput. Phys., 54, 174
- Draine & Salpeter (1979) Draine, B.T., & Salpeter, E.E. 1979, ApJ, 231, 77
- Drury et al. (1994) Drury, L. O’C., Aharonian, F.A., & Voelk, H.J. 1994, A&A, 287, 959
- Dwarkadas & Chevalier (1998) Dwarkadas, V.V., & Chevalier, R.A. 1998, ApJ, 497, 807
- Dwek (1987) Dwek, E., 1987, ApJ, 322, 812
- Dwek et al. (1987) Dwek, E., Petre, R., Szymkowiak, A., & Rice, W.L. 1987, ApJ, 320, L27
- Fesen et al. (1979) Fesen, R.A., Kirshner, R.P., & Winkler, P.F. 2003, ApJ, 234, 174
- Gal-Yam et al. (2007) Gal-Yam, A., et al. 2007, ApJ, 656, 372
- Ghavamian (1999) Ghavamian, P. 1999, Ph.D. Thesis
- Ghavamian et al. (2001) Ghavamian, P., Raymond, J.C., Smith, R.C., Hartigan, P. 2001, ApJ, 547, 995
- Ghavamian et al. (2007) Ghavamian, P., Blair, W.P., Sankrit, R., Raymond, J.C., & Hughes, J.P. 2007, ApJ, 664, 304
- Greidanus & Strom (1990) Greidanus, H., & Strom, R.G. 1990, A&A, 240, 385
- Gvaramadze & Vikhlinin (2003) Gvaramadze, V.V., & Vikhlinin, A.A. 2003, A&A, 401, 625
- Hachisu et al. (1996) Hachisu, I., Kato, M., & Nomoto, K. 1996, ApJ, 470, 97
- Helder et al. (2009) Helder, E., et al. 2009, Science, 325, 719
- Helder et al. (2011) Helder, E.A., Vink, J., & Bassa, C.G. 2011, ApJ, accepted
- Hewitt et al. (2009) Hewitt, J.W., Rho, J., Andersen, M., & Reach, W.T. 2009, ApJ, 694, 1266
- Isern et al. (2008) Isern, J., Bravo, E., & Hirschmann, A. 2008, EAS Publication Series, 32, 283
- Jokipii (1987) Jokipii, J.R. 1987, ApJ, 313, 842
- Jurac et al. (1998) Jurac, S., Johnson, R.E., & Donn, B. 1998, ApJ, 503, 247
- Kaastra et al. (1992) Kaastra, J.S., Asaoka, I., Koyama, K., & Yamauchi, S. 1992, A&A, 264, 654
- Kaplan et al. (2004) Kaplan, D.L, Frail, D.A., Gaensler, B.M., Gotthelf, E.V., Kulkarni, S.R., Slane, P.O., & Nechita, A. 2004, ApJS, 153, 269
- Kaspi et al. (1996) Kaspi, V.M., Manchester, R.N., Johnson, S., Lyne, A.G., & D’Amico, N. 1996, AJ, 111, 2028
- Kasten & Young (1989) Kasten, F. & Young, T. 1989, Appl. Opt., 28, 4735
- Kerzendorf et al. (2009) Kerzendorf, W.E., Schmidt, B.P., Asplund, M., Nomoto, K., Podsiadlowski, P., Frebel, A., Fesen, R., & Yong, D. 2009, ApJ, 701, 1665
- Krause et al. (2008) Krause, O., Tanaka, M., Usuda, T., Hattori, T., Goto, M., Birkmann, S., Nomoto, K. 2008, Nature, 456, 617
- Kesteven & Caswell (1987) Kesteven, M.J., & Caswell, J.L. 1987, A&A, 183, 118
- Lair et al. (2006) Lair, J.C., Leising, M.D., Milne, P.A., & Williams, G.G. 2006, AJ, 132, 2024
- Lee et al. (2009) Lee, H., et al. 2009, ApJ, 706, 441
- Leibowitz & Danziger (1983) Leibowitz, E.M., & Danziger, I.J. 1983, MNRAS, 204, 273
- Li et al. (1993) Li, H., McCray, R., & Sunyaev, R.A. 1993, ApJ, 419, 824
- Long & Blair (1990) Long, K.S., & Blair, W.P. 1990, ApJ, 358, L13
- McCray (1993) McCray, R. 1993, ARAA, 31, 175
- Nozawa et al. (2006) Nozawa, T., Kozasa, T., & Habe, A. 2006, ApJ, 648, 435
- Parizot et al. (2006) Parizot, E., Marcowith, A., Ballet, J., & Gallant, Y.A. 2006, A&A, 453, 387
- Pavlov et al. (2000) Pavlov, G.G., Zavlin, V.E., Aschenbach, B., Trumper, J., & Sanwal, D. 2000, ApJ, 531, 53
- Pisarski et al. (1984) Pisarski, R.L., Helfand, D.J., & Kahn, S.M. 1984, ApJ, 277, 710
- Raymond et al. (2003) Raymond, J.C., Ghavamian, P., Sankrit, R., Blair, W.P., & Curiel, S. 2003, ApJ, 584, 770
- Reynolds et al. (2007) Reynolds, S.P., Borkowski, K.J., Hwang, U., Hughes, J.P., Badenes, C., Laming, J.M., & Blondin, J.M. 2007, ApJ, 668, 135
- Reynolds & Keohane (1999) Reynolds, S.P., & Keohane, J.W. 1999, ApJ, 525, 368
- Reynolds (2008) Reynolds, S.P. 2008, ARA&A, 46, 89
- Rho et al. (2002) Rho, J., Dyer, K.K., Borkowski, K.J., & Reynolds, S.P. 2002 (R02), ApJ, 581, 1116
- Rho et al. (2008) Rho, J., Kozasa, T., Reach, W.T., Smith, J.D., Rudnick, L., DeLaney, T., Ennis, J.A., Gomez, H., & Tappe, A. 2008, ApJ, 673, 271
- Rosado et al. (1996) Rosado, M., Ambrocio-Cruz, P., Le Coarer, E., & Marcelin, M. 1996, A&A, 315, 243
- Sankrit et al. (2010) Sankrit, R., Williams, B.J., Borkowski, K.J., Gaetz, T.J., Raymond, J.C., Blair, W.P., Ghavamian, P., Long, K.S., & Reynolds, S.P. 2010, ApJ, 712, 1092
- Schaefer (1993) Schaefer, B.E. 1993, PASP, 105, 1238
- Schaefer (1996) Schaefer, B.E. 1996, ApJ, 459, 438
- Smith (1997) Smith, R.C. 1997, AJ, 114, 2664
- Smith et al. (2009) Smith, N., Hinkle, K.H., & Ryde, N. 2009, AJ, 137, 3558
- Sollerman et al. (2003) Sollerman, J., Ghavamian, P., Lundqvist, P., & Smith, R.C. 2003, A&A, 407, 249
- Stephenson & Green (2002) Stephenson, F.R. & Green, D.A. 2002, Historical Supernovae and their Remnants, Oxford University Press
- Ueno et al. (2007) Ueno, M. et al. 2007, PASJ, 59, 171
- van Adelsberg et al. (2008) van Adelsberg, M., Heng, K., McCray, R., & Raymond, J.C. 2008, ApJ, 689, 1089
- Vink et al. (1997) Vink, J., Kaastra, J.S., & Bleeker, J.A.M. 1997, A&A, 328, 628
- Vink & Laming (2003) Vink, J., & Laming, J.M. 2003, ApJ, 584, 758
- Vink et al. (2006) Vink, J., Bleeker, J., van der Heyden, K., Bykov, A., & Yamakazi, R. 2006, ApJ 648, 33
- Wang et al. (2004) Wang, L., Baade, D., Hoeflich, P., Wheeler, J.C., Kawabata, K., & Nomoto, K. 2004, ApJ, 604, L53
- Weaver et al. (1977) Weaver, R., McCray, R., Castor, J., Shapiro, P., & Moore, R. 1977, ApJ, 218, 377
- Weingartner & Draine (2001) Weingartner, J.C., & Draine, B.T. 2001, ApJ, 548, 296
- Westerlund (1969) Westerlund, B.E. 1969, AJ, 74, 879
- Williams et al. (2006) Williams, B.J., et al. 2006, ApJ, 652, L33
- Williams et al. (2008) Williams, B.J., et al. 2008, ApJ, 687, 1054
- Williams et al. (2011) Williams, B.J., et al. 2011, ApJ, 729, 65
- Wilms et al. (2000) Wilms, J., Allen, A., & McCray, R. 2000, ApJ, 542, 914
- Woosley et al. (1994) Woosley, S.E., Eastman, R.G., Weaver,T.A., & Pinto, P.A. 1994, ApJ, 429, 300
- Woosley & Weaver (1995) Woosley, S.E. & Weaver, T.A. 1995, ApJS, 101, 181
- Yamaguchi et al. (2008a) Yamaguchi, H., et al. 2008a, PASJ, 60, 141
- Yamaguchi et al. (2008b) Yamaguchi, H., Koyama, K., Nakajima, H., Bamba, A., Yamakazi, R., Vink, J., & Kawachi, A. 2008b, PASJ, 60, 123
- Zhou et al. (2006) Zhou, F., Strom, R.G., & Jiang, S. 2006, Chin. J. Astron. Astrophys., 6, 635
- Zubko et al. (2004) Zubko, V., Dwek, E., & Arendt, R.G. 2004, ApJS, 152, 211