Measurement of the and Dalitz decays transition form factors in p-A collisions at 400 GeV/ with the NA60 apparatus
Abstract
The NA60 experiment has studied low-mass muon pairs production in proton-nucleus collisions at 400 GeV/ at the CERN SPS. The mass spectrum is well described by the superposition of the two-body and Dalitz decays of the light neutral mesons , , , and . The large collected statistics allows to isolate the contributions due to the Dalitz decays of the and mesons, from which the electromagnetic transition form factors of the two mesons have been extracted. The found values agree with the previous available measurements, improving their uncertainty thanks to the higher statistics. The results thus confirm the discrepancy with the prediction of the Vector Meson Dominance model in the case of the electromagnetic form factor of the meson.
Proton-nucleus studies have been part of the heavy-ion experimental program at the CERN SPS, of which the NA60 experiment represents the most recent and one of the most fruitful efforts. Beyond serving as a robust reference baseline for the heavy-ion data, proton-nucleus data also stimulate a genuine physics interest, allowing measurements in an environment of cold nuclear matter. This is in fact the case of the electromagnetic transition form factors of the and mesons, which have been studied here through their Dalitz decays and . In these processes, the mesons decay electromagnetically into a virtual photon with mass in turn converting into a lepton pair and a third body. Assuming point-like particles, the mass distribution of the emitted lepton pair (that is, the decay rate of the process as a function of ) can be exactly described by QED as firstly shown by N.M. Kroll and W. Wada [1] in the 1950s.
However, the observed mass distribution for the lepton pairs emitted in an decay differs from the point-like one, because of the internal electromagnetic structure of the decaying meson, which reveals at the vertex of the transition . This difference can be formally described by a function of , usually expressed as , known as transition form factor. Experimentally, is directly accessible by comparing the measured invariant mass spectrum of the lepton pairs from the Dalitz decays, with the point-like QED prediction. The transition form factors are usually given in terms of the pole parametrization:
| (1) |
The Vector Meson Dominance (VMD) model gives theoretical predictions both for and . These predictions have been tested by the Lepton-G experiment [3] using pion beams, and recently by the NA60 experiment in In-In peripheral collisions [4]. While the experimental values agree among each other both for the and mesons, only the VMD model prediction for the meson is confirmed by the data, while the one for the meson is not, strongly underestimating the observed form factor. The NA60 p-A data can now give a further significant contribution to the measurement, thanks to the high quality and the large statistics available.
A description of the NA60 apparatus can be found for example in [5]. Here, only few relevant details are given. The produced dimuons are identified and measured by the muon spectrometer, composed of a set of tracking stations, trigger scintillator hodoscopes, a toroidal magnet and a hadron absorber. The stopping of hadrons (provided by more than 20 interactions lengths) allows to select the highly rare dimuon events. On the other hand, the material which stops the hadrons also induces multiple scattering and energy loss on the muons, degrading the mass resolution of the measurement made in the spectrometer. To overcome this problem, NA60 already measures the muons before the absorber with a tracking telescope, made of pixel silicon detectors [6]. The muon tracks are found among the many other charged particle tracks by a correct matching, both in angular and momentum coordinates, with the reconstructed tracks in the muon spectrometer.
The preliminary results presented here are obtained from the analysis of the data collected during three days within the 2004 proton run, with a system of nine sub-targets of different nuclear species, simultaneously exposed to an incident 400 GeV proton beam. The first step of the analysis is a fit of the reconstructed mass spectrum (see Figure 2). The fit is performed comparing the data with the superposition of the expected sources (estimated via the MC). These sources are the Dalitz decays of the , and mesons, the 2-body decays of the , , and and the contribution of the open charm process. Before the comparison between data and MC is performed, the small component of combinatorial background (originating from and decays) is subtracted from the real data: its shape is estimated with an event mixing technique, while its normalization is established fixing the LS (like-sign) component coming out from the mixing, to the LS component of the data (containing no signal from correlated pairs at the SPS energies). The background accounts for less than of the integrated mass spectrum below 1.4 GeV. The comparison between mixed and real sample gives an average uncertainty of , for both the and the components: given the rather low level of the combinatorial background contribution, this uncertainty hardly affects the evaluation of the shape for the Dalitz decays under study.
The processes which are not of interest for the measurement of the form factors of the and are then subtracted from the real data, using the normalizations fixed by the fit. Only the Dalitz decays of and are retained, together with the two-body decay of the : this latter is left in, making it much easier to control the systematics due to the small contribution coming from the low-mass tail of the in the mass region of interest here. The mass spectrum resulting after the subtraction is then corrected for the effects of geometrical acceptance and reconstruction efficiency. In order to do this, a correction profile as a function of the mass is built, weighting the profiles obtained from the MC for the three processes separately. After the correction for the acceptance efficiency effects, the resulting mass spectrum now free from any acceptance distortion is compared with the superposition of the expected line shapes of the three processes , and .
Figure 2 shows the fit on the acceptance-corrected mass spectrum (black triangles), having isolated the contribution of the three processes , and . The fit function is a superposition of the expected line shapes for the three processes, described by the following functions:
| (2) |
| (3) | |||||
| (4) | |||||
In the fit, the following parameters are left free:
-
•
the three normalizations, one for each of the line shapes above
-
•
the parameters and , contained in the form factors and .
Concerning the line shape for the decay, the parameters (entering in the definition of ), and the effective temperature are fixed respectively to MeV (from the PDG), MeV/ (also from the PDG) and MeV (consistent with the expected value obtained by statistical model fits on particle ratios in interactions). All the parameters involved in the analysis procedure have been varied to study their influence on the fits and determine the systematic uncertainties on the results: the weights defining the acceptanceefficiency correction, the fit range (and the choice of the free parameters), the value for the ratio, the charge correlation parameter for the combinatorial background and finally the level of the open charm contribution. The analysis leads to the following values:
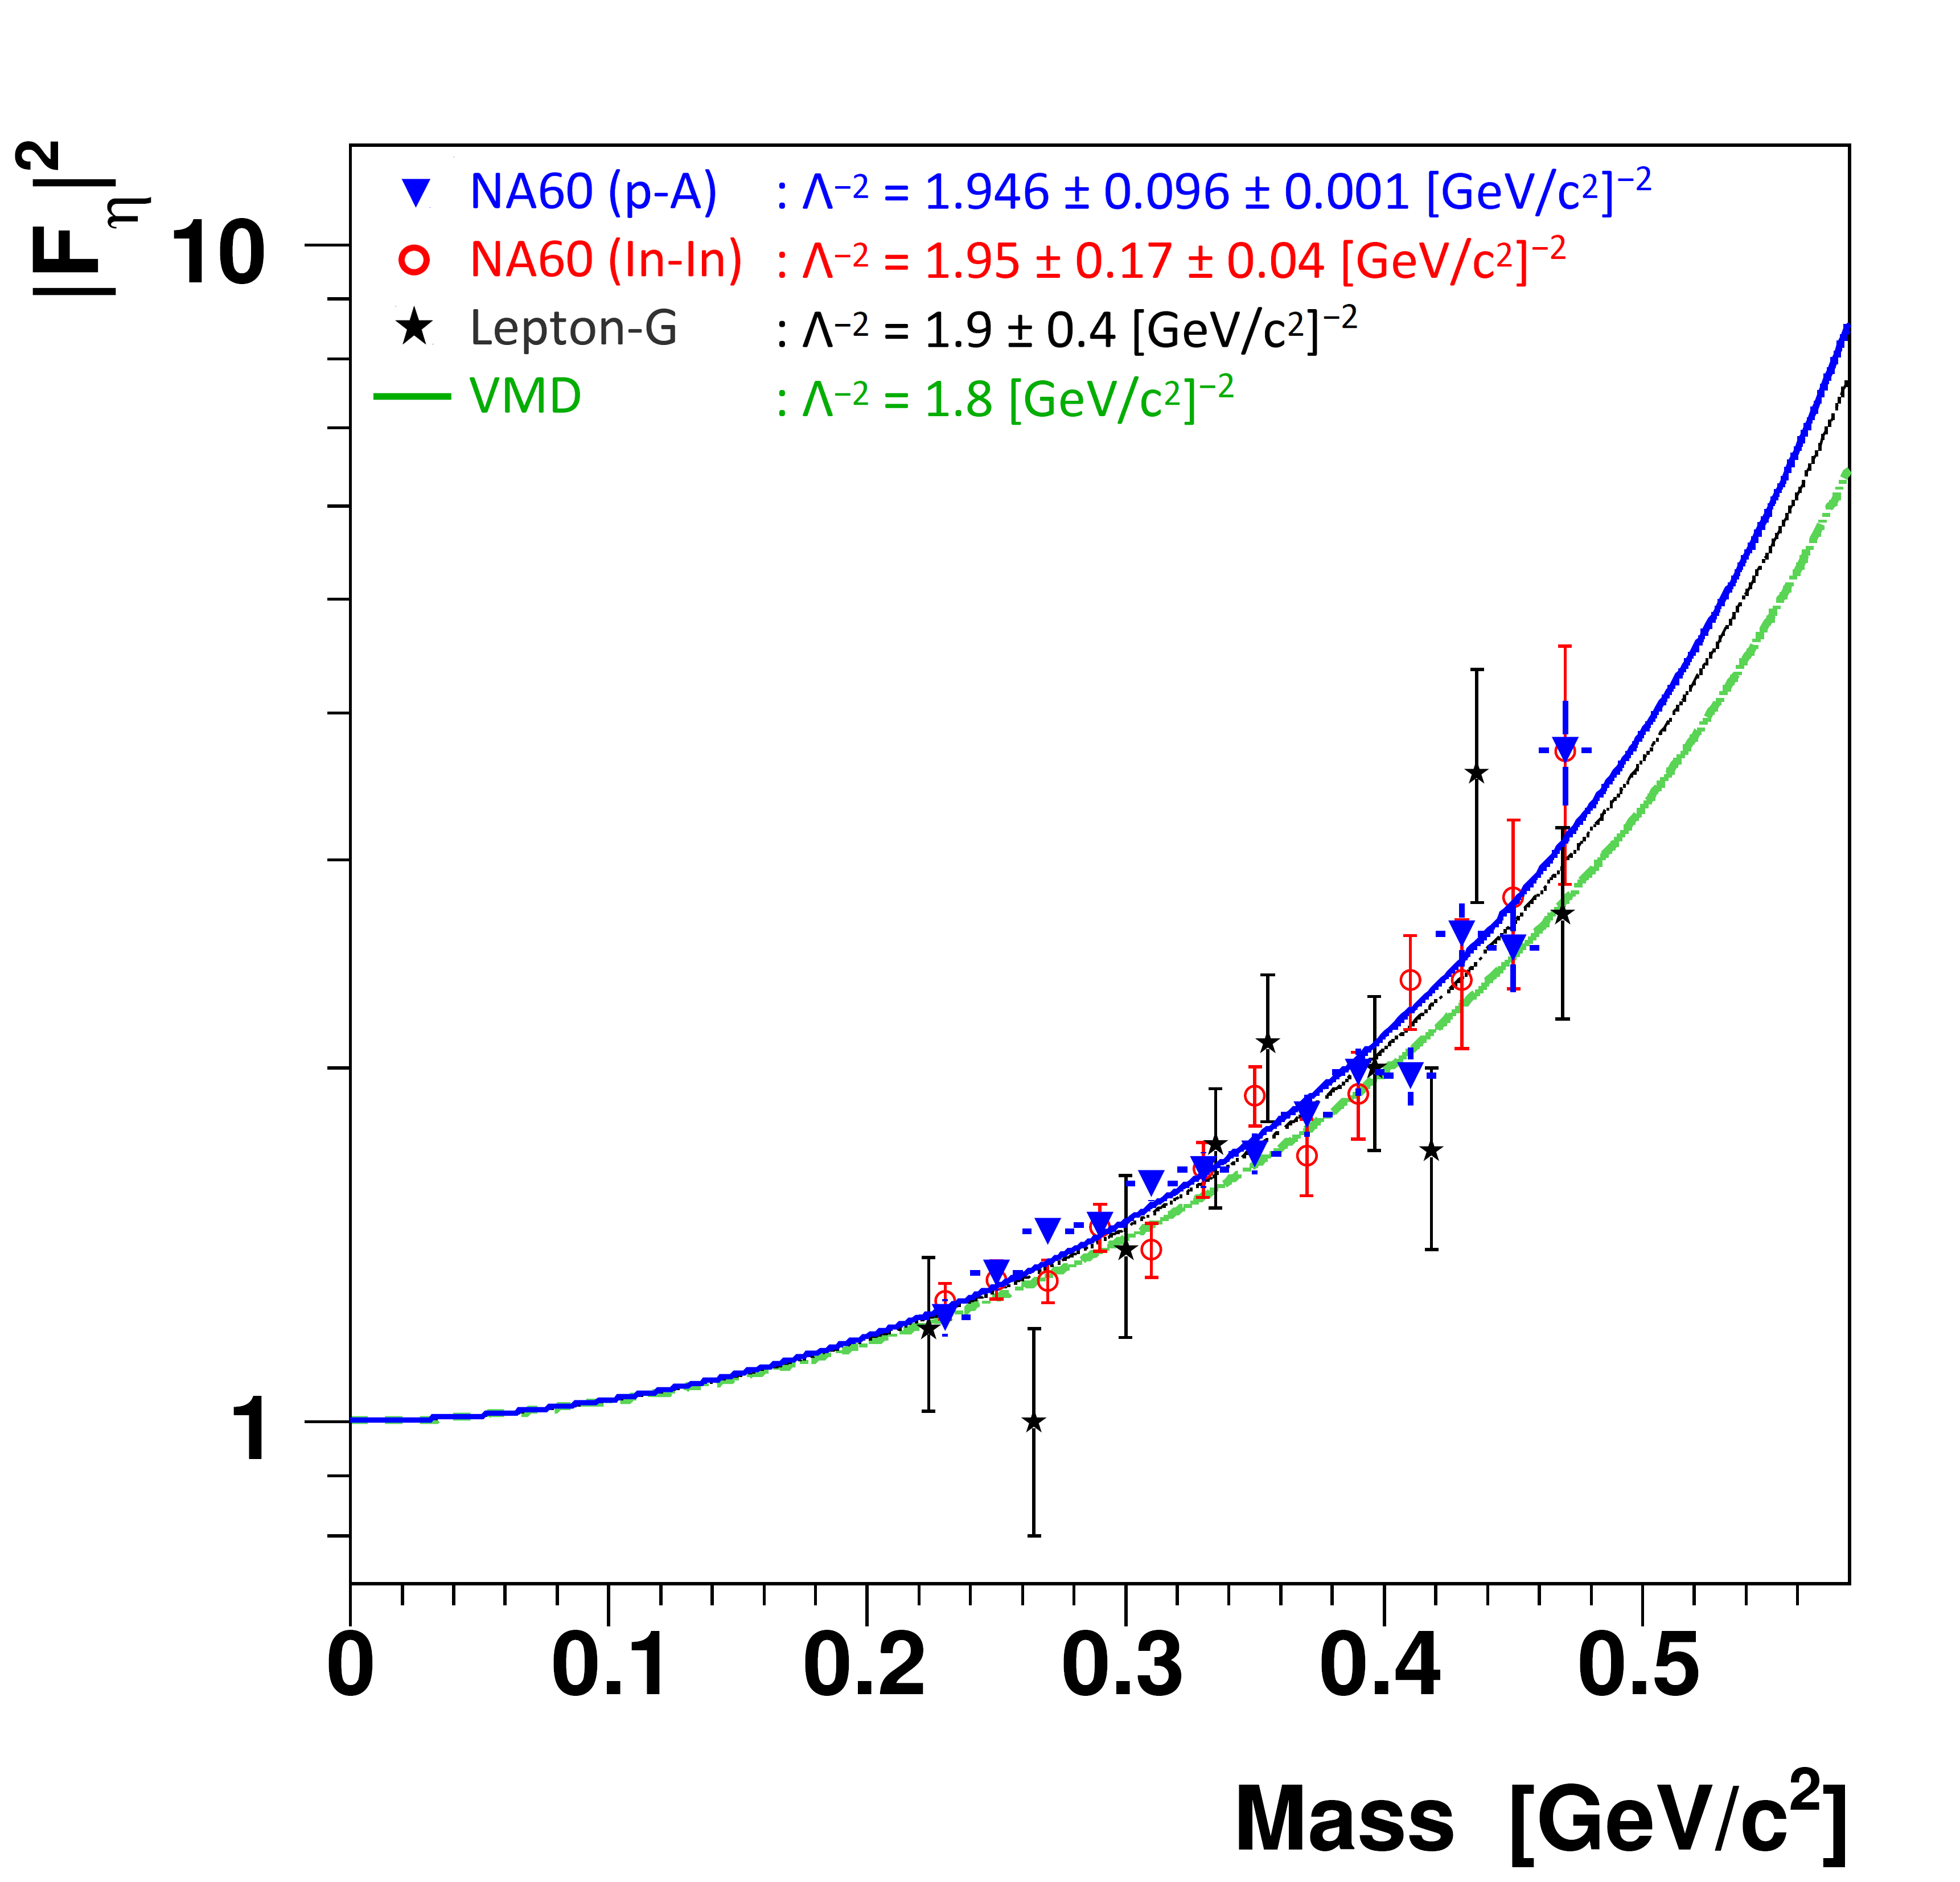
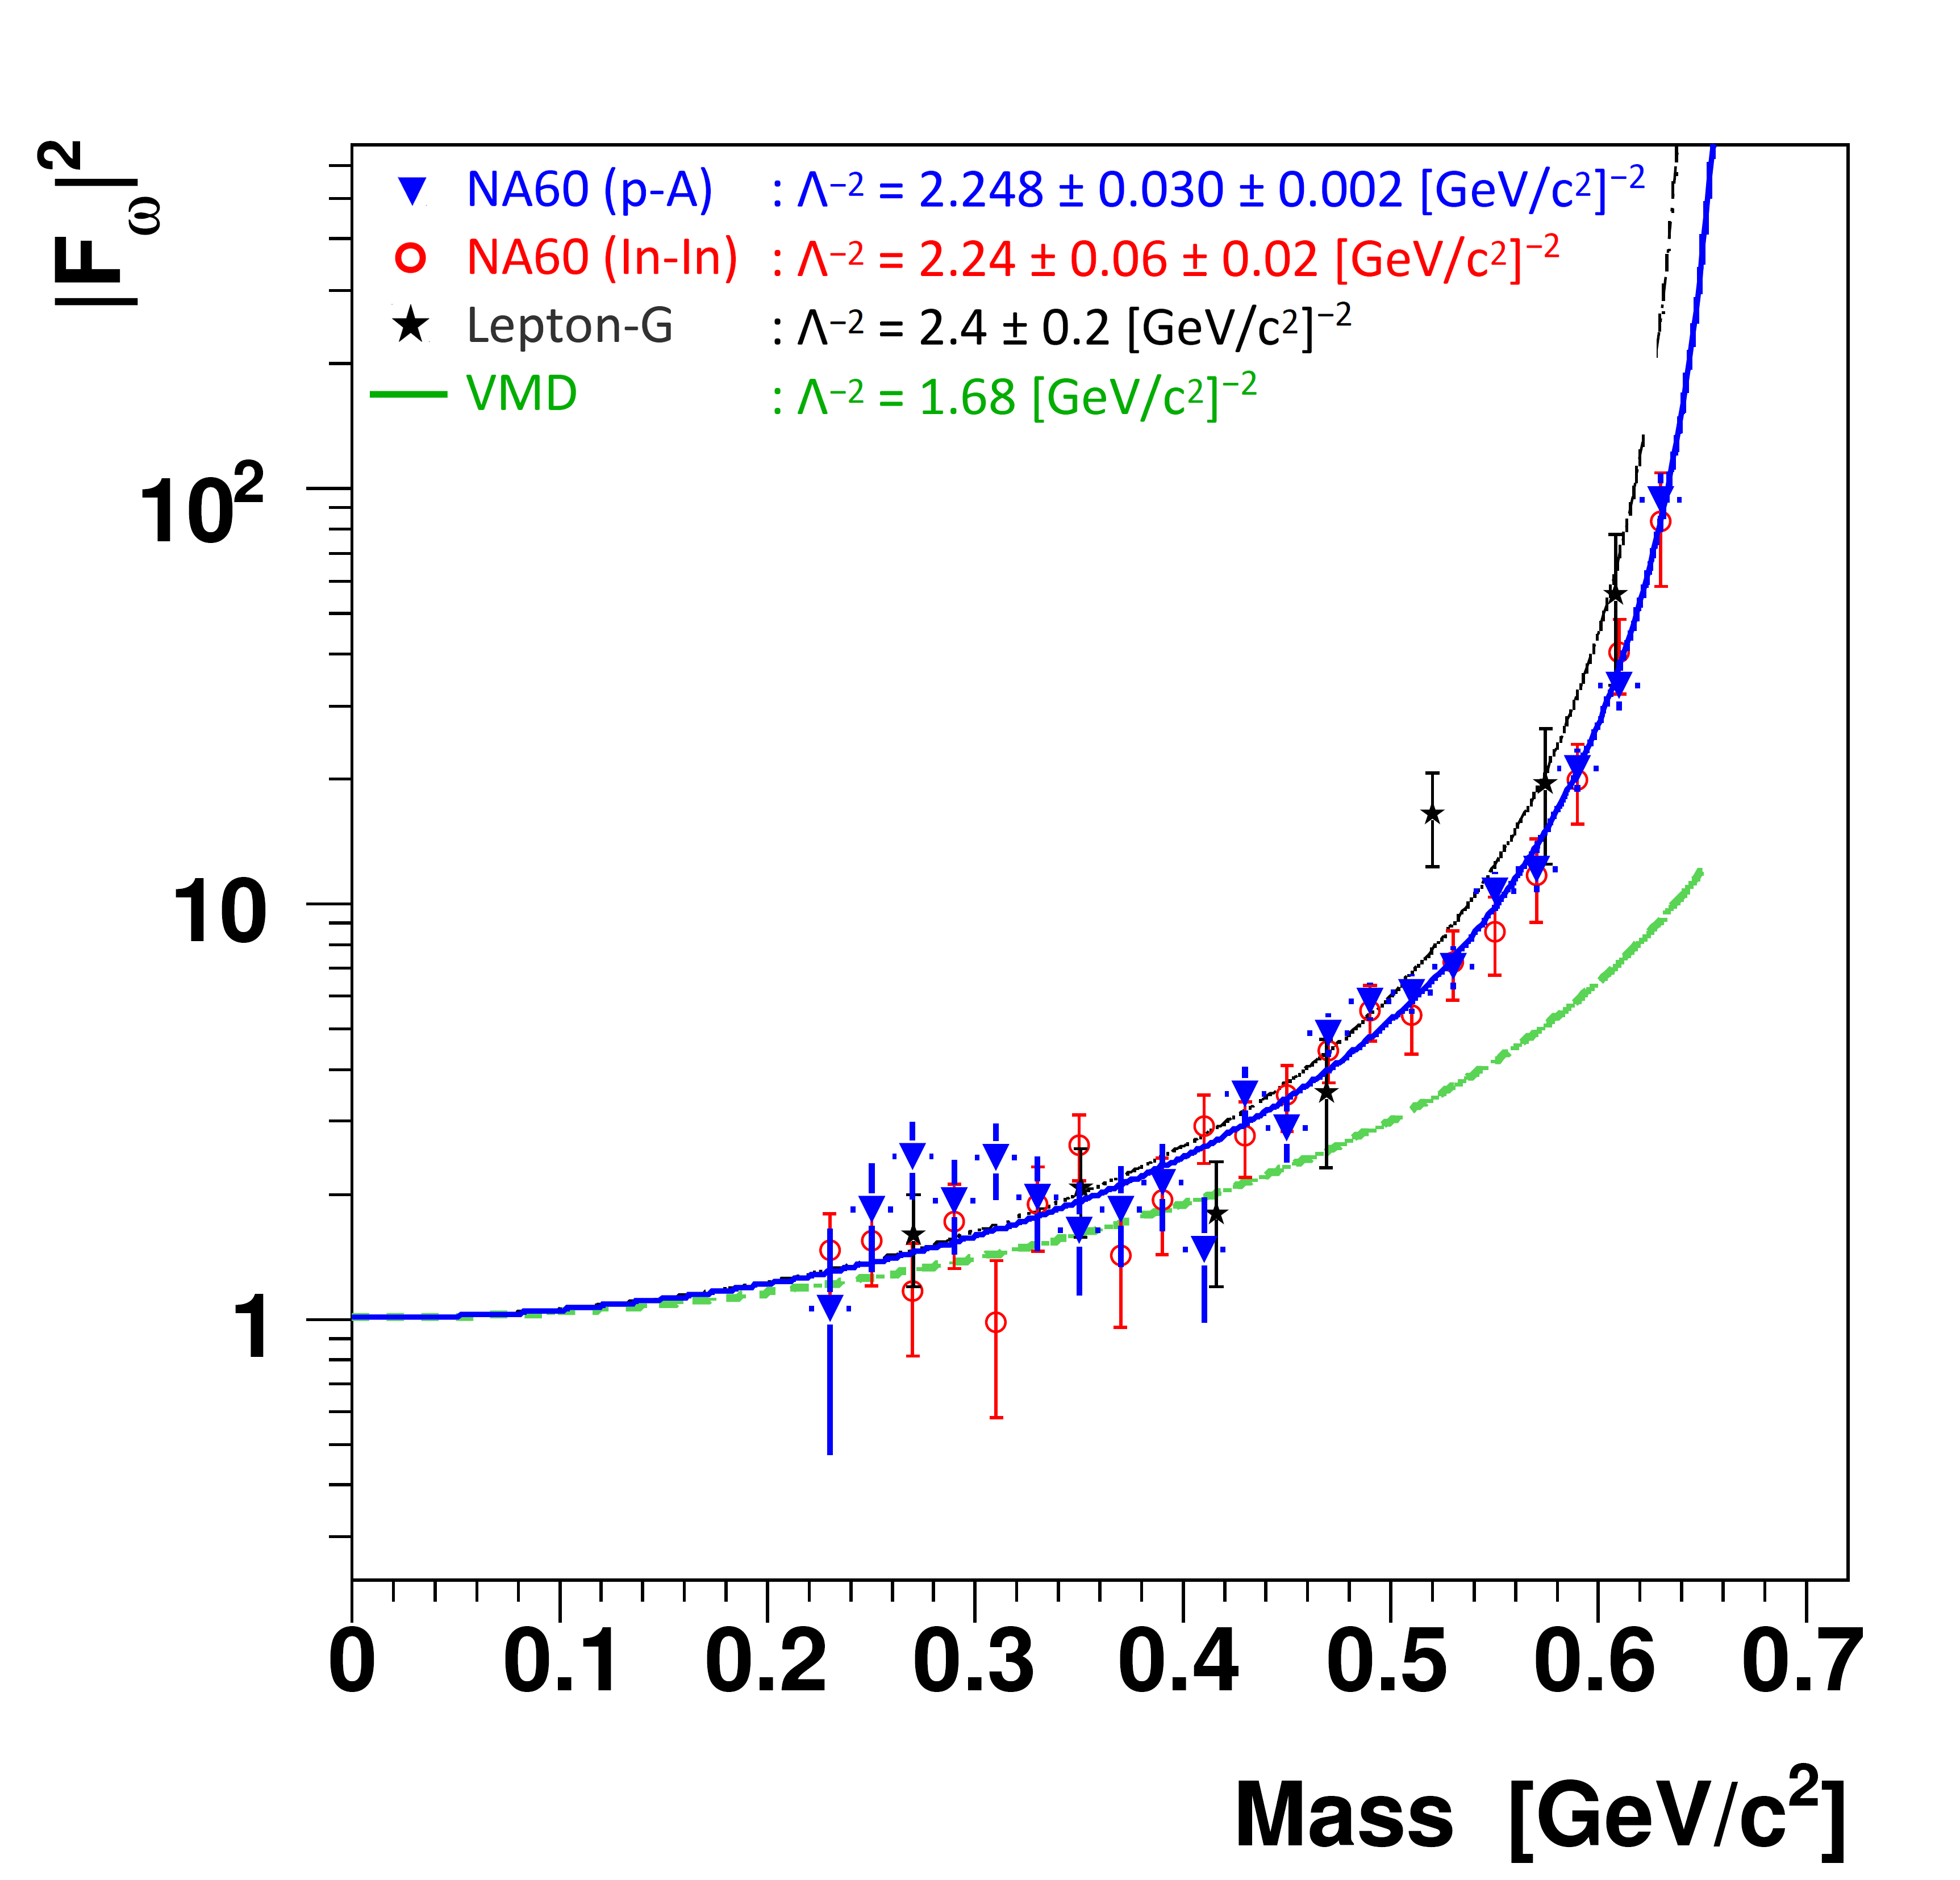
Once the final fit parameters and their errors are fixed, the contributions of the and processes are disentangled, making it then possible to present the two form factors in the usual way, in order to compare them with the previous experimental points, see Figure 3. The pole parameters and their errors as obtained from the combined fit to both Dalitz decays are shown as inserts. Both figures include the NA60 data obtained in peripheral In-In, the Lepton-G data, and the expectations from VMD for comparison. Within the errors, perfect agreement between the three data sets is seen in both cases. Irrespective of the much reduced errors, the form factor of the is still close to the expectation from VMD. The form factor of the , on the other hand, strongly deviates from the VMD, showing a relative increase close to the kinematic cut-off by a factor of .


In conclusion, we have presented a new measurement of the electromagnetic transition form factors of the and mesons. The analysis has been performed by studying the Dalitz decays and in p-A collisions at 400 GeV/ with the NA60 apparatus. The new preliminary values presented here are in good agreement with those already available; improving the precision of the measure by a factor , they confirm on more solid grounds the discrepancy between the VMD prediction for the and the experimental observations.
References
References
- [1] N. M. Kroll and W. Wada, Internal Pair Production Associated with the Emission of High-Energy Gamma Rays, Phys. Rev. 98 (1955) 1935.
- [2] C. Amsler et al. [Particle Data Group], Review of Particle Physics, Phys. Lett. B 667 (2008) 1
- [3] L. G. Landsberg, Electromagnetic Decays of Light Mesons, Phys. Rep. 128 (1985) 301.
- [4] R. Arnaldi et al. [NA60 Collaboration], Study of the electromagnetic transition form-factors in and decays with NA60, Phys. Lett. B 677 (2009) 260 [arXiv:0902.2547].
- [5] R. Arnaldi et al. [NA60 Collaboration], Evidence for the production of thermal-like muon pairs with masses above 1 GeV/ in 158A GeV Indium-Indium Collisions Eur. Phys. J. C 59 (2009) 607 [arXiv:0810.3204].
- [6] M. Keil et al. [NA60 Collaboration], The NA60 vertex telescope for particle tracking in heavy-ion and proton-nucleus collisions Nucl. Instrum. Meth. A 568 (2006) 263