11email: [rsmiljan,lpasquin]@eso.org 22institutetext: INAF - Osservatorio Astrofisico di Arcetri, Largo E. Fermi 5, 50125 Firenze, Italy
22email: randich@arcetri.astro.it
Mixing at young ages: Beryllium abundances in cool main-sequence stars of the open clusters IC 2391 and IC 2602††thanks: Based on observations made with the ESO/VLT, at Paranal Observatory, under program 66.D-0284.
Abstract
Context. The determination of lithium abundances in stars of young clusters have shown that they deplete Li by different degrees during their pre-main sequence phase. Beryllium abundances are complementary to the lithium ones, and can help tracing the mixing processes in the stellar interiors.
Aims. Our aim is to derive beryllium abundances in a sample of G- and K-type stars of two young pre-main sequence open clusters, IC 2391 and IC 2602. The Be abundances are used to investigate the mixing of internal material in these stars. The reliability of the Be lines as abundance indicators in low-temperatures is also investigated in detail.
Methods. We derived Be abundances from high-resolution, high signal-to-noise UVES/VLT spectra using spectrum synthesis and model atmospheres. Atmospheric parameters and other elemental abundances are adopted from a previous work.
Results. The sample stars have masses in the range between 0.80 1.20. They have been shown to differ in lithium abundance by about 0.60 dex, with lower A(Li) in cooler and lower mass stars. Here, we find that all the stars have the same Be abundance within the uncertainties. These observations show that the Be abundance is not affected by the mixing events in the pre-main sequence, in this mass range, in agreement with the expectation of evolutionary models. A comparison with Be abundances in older clusters shows that, contrary to the models, cool stars deplete Be during their main-sequence lifetime, confirming what has been previously suggested in the literature.
Key Words.:
stars: abundances – stars: evolution – open clusters and associations: individual: IC 2391 and IC 26021 Introduction
Open clusters are ideal targets to study stellar evolution and stellar structure. They are composed of stars with the same age, chemical composition, and distance; moreover, their masses can be relatively well estimated. In young clusters, these advantages can be used to investigate the pre-main sequence (PMS) evolution of low-mass stars.
In this context, the evolution of the light elements lithium and beryllium offer valuable information. These elements burn in (p,) reactions at relatively low but different temperatures in the stellar interiors ( 2.5 106 K for Li and 3.5 106 K for Be). Variations in their surface abundances, with respect to their initial values, help constraining the physical processes mixing the surface material to that in the stellar interior (Pinsonneault, 1997; Deliyannis et al., 2000; Charbonnel et al., 2000).
Li abundances have, consequently, been extensively studied in open clusters. According to standard evolutionary models111By standard evolutionary models we mean those that only allow for mixing in convective layers and do not include effects due to rotation and/or magnetic fields., Li depletion should be a unique function of age, mass, and chemical composition, in other words, within a given cluster stars with similar effective temperature should have undergone the same amount of Li depletion. Observations, however, have revealed a complex behavior with important discrepancies in almost all evolutionary stages of low- and intermediate-mass stars (see e.g. Pinsonneault, 1997, and references therein).
Focusing on PMS Li depletion, several surveys of young clusters have evidenced two major discrepancies between theoretical predictions and empirical patterns. First, standard models seem to predict more Li depletion than observed in PMS clusters (defined as clusters with age between 10 and 100 Myr). Second, there is a significant spread in Li abundances among late-G and K dwarfs, which has first been detected in the 120 Myr Pleiades (Duncan & Jones, 1983; Butler et al., 1987), along with a connection between Li abundances and rotation; namely, fast-rotating stars appear to have higher abundances than slow-rotating ones. This connection was confirmed in a large sample of Pleiades members by Soderblom et al. (1993) and has been found to hold for stars between 0.7 and 0.9 , but to break down for less massive stars (Garcia Lopez et al., 1994; Jones et al., 1996). The scatter in Li abundances in otherwise similar stars has since then been confirmed by other authors (Jeffries, 1999; Ford et al., 2002; King et al., 2010).
Similar results of a star-to-star scatter in Li and the Li-rotation connection have been found in other clusters and associations both younger and older than the Pleiades, e.g. the nine young associations with ages between 6 and 70 Myr analyzed in da Silva et al. (2009), IC 4665 ( 28 Myr, Martin & Montes, 1997; Jeffries et al., 2009), IC 2602 ( 45 Myr, Randich et al., 1997, 2001), NGC 2451 A and B ( 50 Myr, Hünsch et al., 2004), Per ( 90 Myr, Balachandran et al., 1988, 2011; Randich et al., 1998), M 35 ( 175 Myr, Barrado y Navascués et al., 2001a), NGC 6475 ( 220 Myr, James & Jeffries, 1997; Sestito et al., 2003), and M 34 ( 250 Myr, Jones et al., 1997). The general picture seems to indicate that the scatter decreases with age and disappears by the age of the Hyades ( 600 Myr, Soderblom et al., 1990, 1995).
The interpretation of the Li scatter as a real abundance scatter and its connection to rotation is sometimes disputed in the literature (see e.g. King et al., 2000; Xiong & Deng, 2005). It has been argued that the Li scatter is only an apparent effect caused by our failure of properly modeling the atmosphere of these stars, neglecting effects caused by stellar activity for example. Theoretical and observational investigations of these effects, however, seem to indicate that they are not able to fully explain the observed scatter (Stuik et al., 1997; Barrado y Navascués et al., 2001b; Randich, 2001; King et al., 2010)
We finally mention that the observed trend of Li with rotation is the opposite of that predicted when effects induced by rotation, such as meridional circulation and shear turbulence, are included (Chaboyer et al., 1995; Mendes et al., 1999). In the models, the fast-rotating stars are expected to deplete more Li then the slow-rotating ones. In the last 15 years several mechanisms related to rotation, magnetic fields, disk locking, and angular momentum loss have been proposed with the aim of solving the discrepancies with observed PMS Li depletion (Martin & Claret, 1996; Ventura et al., 1998; Chabrier et al., 2007; Bouvier, 2008; Baraffe & Chabrier, 2010; MacDonald & Mullan, 2010). Whilst some of these models do predict a larger amount of Li depletion for slow rotators, they still need to be further investigated and constrained.
Beryllium, on the other hand, has been investigated in far fewer stars than Li. This is because Be abundances can only be determined from the Be ii 2S–2P0 resonance lines at 3131.065 Å and 3130.420 Å, a spectral region near the atmospheric cutoff and thus strongly affected by atmospheric extinction. Moreover, this near-UV region is extremely crowded with atomic and molecular lines, some of them still lacking proper identification.
Most of the work on Be in open cluster has concentrated in F and early-G stars (e.g. Stephens et al., 1997; Boesgaard & King, 2002; Boesgaard et al., 2003b, 2004; Randich et al., 2002, 2007; Smiljanic et al., 2010), while very little has been done in cooler stars ( 5400 K). Stars with temperatures down to 5000 K have been investigated only in the Hyades ( 600 Myr) by Garcia Lopez et al. (1995) and Randich et al. (2007) and in NGC 2516 ( 150 Myr) by Randich et al. (2007).
These works have shown the following behavior of the Be abundances. As in the case of the Hyades, although the Li abundance decreases by two orders of magnitude with decreasing temperature between 6000 to 5400 K, the Be abundances remain unaltered (Boesgaard & King, 2002). For cooler stars in the Hyades, the results of Garcia Lopez et al. (1995) and Randich et al. (2007) suggest a small degree of Be depletion. For the four young stars in NGC 2516, no Be depletion was detected down to 5100 K (Randich et al., 2007). For older field stars, Santos et al. (2004) have found some degree of Be depletion in stars cooler than 5600 K. These studies therefore suggest a low level of main-sequence Be depletion in the cooler stars.
Except for one star of IC 2391 analyzed by Randich et al. (2002), Be has never been systematically investigated in cool late G- and K-type stars of young pre-main sequence clusters. Here, we make for the first time such an attempt, and extend the investigation of Be to stars with as low as 4700 K in the PMS clusters IC 2391 and IC 2602. As evolutionary models fail to reproduce the Li depletion pattern in these clusters (Randich et al., 2001), it is important to investigate Be in order to better constrain the properties of the mixing during the PMS phase.
Our work is divided as follows. In Sec. 2 we describe the targets and the observational data. In Sec. 3 we present the model atmosphere and abundance analysis, discussing in detail the difficulties of modeling the spectra of rotating cool stars. Our findings are presented in comparison to evolutionary models and to literature data on older clusters in Sec. 4. Finally, in Sec. 5 we present our final remarks.
2 Targets and observational data
2.1 The young clusters IC 2391 and IC 2602
IC 2391 and IC 2602 are among the closest clusters to the Sun, with distances of the order of 150 pc (van Leeuwen, 2009). Although these two southern clusters are close to the Galactic plane, their proximity results in small reddening. The clusters also have very similar ages. For IC 2391, Barrado y Navascués et al. (2004) derived an age of 50 Myr using the lithium depletion boundary method (see e.g. Bildsten et al., 1997). For IC 2602, the Li depletion method has recently been applied by Dobbie et al. (2010) and an age of 46 Myr was found. The clusters are young enough that 1 stars have just arrived or are arriving at the zero age main-sequence (ZAMS)222According to the models presented in Piau & Turck-Chièze (2002), for example, stars with 1.4 and 1.0 , with Pleiades chemical composition, arrive at the ZAMS after pre-main sequence lifetimes of 30 and 50 Myr, respectively.. The data on the clusters is summarized in Tab. 1. The young ages and proximity make the two clusters of considerable interest for the study of pre-main sequence evolutionary phases.
| Cluster | Age | Distance | [Fe/H] | ||
|---|---|---|---|---|---|
| (mag.) | (mag.) | ( Myr) | (pc) | ||
| IC 2391 | 5.80 | 0.01 | 50 | 144.9 | 0.01 |
| IC 2602 | 5.86 | 0.04 | 46 | 148.6 | 0.00 |
In spite of that, only a few analyses of their chemical composition have been published. The metallicities were first determined by Randich et al. (2001) for a subsample of the early-G and late-K type stars that they analyzed. Values of [Fe/H]444[A/B] = [N(A)/N(B)]⋆ [N(A)/N(B)]⊙ = 0.03 0.07 and [Fe/H] = 0.05 0.05 were found for IC 2391 and IC 2602, respectively. Stütz et al. (2006) analyzed 5 B-F stars in IC 2391 including star SHJM2, one of the stars included in our sample. A mean metallicity above solar of [Fe/H] = +0.06 was determined, if we exclude HD 74044 which was found to be a slightly chemically peculiar A-type star. For SHJM2 a value of [Fe/H] = +0.08 was found. Platais et al. (2007) derived an average value of [Fe/H] = +0.06 0.06 from high resolution spectra of four slowly-rotating G-dwarfs. More recently, detailed abundances for 15 G- and K-type dwarf members of the two clusters were obtained by D’Orazi & Randich (2009). Solar average metallicities of [Fe/H] = 0.01 0.02 and [Fe/H] = 0.00 0.01 were determined for IC 2391 and IC 2602, respectively. Here we adopted these last values.
| Star (1) | Other | Date of | Exp. Time | S/N at | |||
|---|---|---|---|---|---|---|---|
| Name | (mag.) (2) | (mag.) | (mag.) | observation | (s) | 3130 Å (3) | |
| VXR3a | CD-52 2467 | 10.95 | … | 0.37 | 16/02/2001 | 2 2400 | 100 |
| VXR31 | Cl* IC 2391 PMM 6478 | 11.22 | … | 0.37 | 17/02/2001 | 3 2400 | 20 |
| VXR67a | Cl* IC 2391 PMM 5859 | 11.71 | … | 0.52 | 16/02/2001 | 4 1800 | 55 |
| VXR70 | CD-52 2524 | 10.85 | … | 0.38 | 17/02/2001 | 2 2400 | 115 |
| VXR72 | TYC 8569-230-1 | 11.46 | … | 0.43 | 18/02/2001 | 4 1800 | 70 |
| SHJM2 | CPD-52 1614 | 10.30 | 0.57 | 0.33 | 16/02/2001 | 2 1200 | 90 |
| R1 | TYC 8960-1957-1 | 11.57 | 0.91 | … | 16/02/2001 | 4 1800 | 75 |
| R14 | TYC 8964-606-1 | 11.57 | 0.87 | … | 17-18/02/2001 | 4 1800 + 1 1650 | 75 |
| R15 | TYC 8964-73-1 | 11.75 | 0.93 | … | 18/02/2001 | 5 1800 | 60 |
| R66 | CPD-63 1624 | 11.07 | 0.68 | … | 16/02/2001 | 2 1800 | 80 |
| R70 | HD 307926 | 10.92 | 0.69 | … | 18/02/2001 | 2 2400 | 80 |
| R92 | HD 308013 | 10.26 | 0.67 | … | 16/02/2001 | 2 1200 | 70 |
2.2 Targets
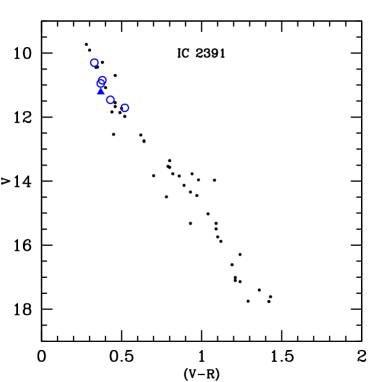
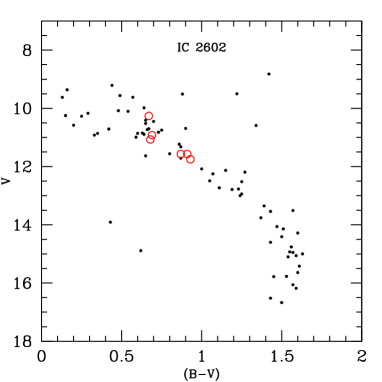
In this work we analyze six G- and K-type stars of each cluster (listed in Tab. 2). All the stars were included in the work of D’Orazi & Randich (2009). The color-magnitude diagrams of the clusters are shown in Fig. 1, where the observed stars are shown as open circles. The sample stars have been identified as photometric counterparts of possible low-mass cluster members detected in ROSAT X-ray observations (Randich et al., 1995; Patten & Simon, 1996). The membership of these stars is supported by spectroscopic observations of radial velocities, H activity, and Li abundances (Randich et al., 1997, 2001; Stauffer et al., 1997; Mermilliod et al., 2009). For IC 2391, proper motions have been measured by Platais et al. (2007). These measurements confirm the membership of all our sample stars, except for star VXR31, which is found to be a non-member. A search in the literature shows that this star has always been flagged as having a discrepant radial velocity, but was suspected to be a single-lined spectroscopic binary. We therefore assume here that it is not a member of the cluster, and we exclude it from further discussion.
| Star | (K) | g | A(Li) | A(Be) | ||
| (K) | (km s-1) | (km s-1) | ||||
| VXR3a | 5590 | 4.45 | 1.15 | 10 | 2.80 | 1.30 |
| VXR67a | 4680 | 4.50 | 0.70 | 8 | 2.30 | 1.30 |
| VXR70 | 5557 | 4.50 | 1.15 | 17 | 2.80 | 1.30 |
| VXR72 | 5257 | 4.50 | 1.20 | 15 | 2.70 | 1.10 |
| SHJM2 | 5970 | 4.45 | 1.20 | 15 | 2.90 | 1.20 |
| R1 | 5050 | 4.50 | 1.15 | 10 | 2.40 | 1.25 |
| R14 | 5100 | 4.50 | 1.10 | 13 | 2.65 | 1.20 |
| R15 | 4770 | 4.50 | 0.70 | 7 | 2.40 | … |
| R66 | 5590 | 4.45 | 1.15 | 12 | 2.80 | 1.30 |
| R70 | 5760 | 4.45 | 1.10 | 12 | 2.90 | 1.15 |
| R92 | 5630 | 4.45 | 1.20 | 14 | 2.93 | 1.20 |
| vB109 | 5141 | 4.50 | 0.86 | … | 0.49 | 0.95 |
| vB182 | 5079 | 4.50 | 0.84 | … | 0.73 | 0.95 |
2.3 Observational data
The observations were carried out in visitor mode using UVES, the Ultraviolet and Visual Echelle Spectrograph (Dekker et al., 2000) fed by UT2 of the VLT. UVES is a cross-dispersed echelle spectrograph able to obtain spectra from the atmospheric cut-off at 300 nm to 1100 nm. UVES was operated in dichroic mode with cross dispersers #1 and #4 and central wavelengths 346 nm and 750 nm, respectively. A slit of 0.8 was used, resulting in a resolution of R 55 000 in the blue arm. The reduction was conducted with the ESO UVES data reduction pipeline within MIDAS (Ballester et al., 2000). The spectra have average signal-to-noise (S/N) between 55 and 115 in the region around the Be lines. The log book of the observations is given in Table 2.
3 Analysis
3.1 Atmospheric parameters
The atmospheric parameters were adopted from the work of D’Orazi & Randich (2009). Their analysis was done in LTE and differentially to the Sun. Effective temperatures were determined with the excitation equilibrium of Fe i lines. A value of = 4.50 was in general adopted for the surface gravities, except for a few slow-rotating stars where the gravity could be checked using the ionization equilibrium between Fe i and Fe ii lines. In these cases a final value of = 4.45 was found, in excellent agreement with the initial assumption. The microturbulence was constrained by requiring the abundances calculated from Fe i lines to have a null correlation with the equivalent widths. The reader is referred to their work for more details on the adopted line list and atomic data. For the Sun, adopting the parameters, = 5777 K, = 4.44, = 1.10 km s-1, a value of A(Fe) = 7.52 was derived. As mentioned above, average metallicities of [Fe/H] = 0.01 0.02 and [Fe/H] = 0.00 0.01 were determined for IC 2391 and IC 2602, respectively. The atmospheric parameters are given in Tab. 3. D’Orazi & Randich (2009) estimate that the random errors affecting their parameters are of 60 K for , 0.20 km s-1 for , and between 0.15 and 0.25 dex for .
3.2 Be abundances
The beryllium abundances were determined using synthetic spectra calculated with the codes described in Coelho et al. (2005). Model atmospheres were computed for the exact atmospheric parameters of the stars using the Linux version (Sbordone et al., 2004; Sbordone, 2005) of the ATLAS9 code originally developed by Kurucz (see e.g. Kurucz, 1993). For the calculations we adopted the new opacities distribution functions of Castelli & Kurucz (2003) without overshooting. These models assume local thermodynamic equilibrium, plane-parallel geometry, and hydrostatic equilibrium.
The line list is the same as used in our previous works on Be abundances (Smiljanic et al., 2008, 2009, 2010). The molecular line list is that described in Coelho et al. (2005) and the atomic line list is the one compiled by Primas et al. (1997). Log of 0.168 and 0.468 were adopted for the Be lines at 3131.066 Å and 3130.421 Å, respectively. The line list includes a Fe i line at 3131.043 Å, with = 2.517 and = 2.85 eV, with the objective of simulating an unknown line that affects the blue wing of the Be 3131 line. The parameters of this line were constrained using several stars of different parameters and metallicities (see Primas et al., 1997, for details). The proper identification of this line is still controversial in the literature, and we remark that other choices have been made by different authors. As discussed in more detail by Randich et al. (2007), this choice does not affect the calculation of Be abundances of stars with 5400 K. As a number of our stars are cooler than that we discuss this issue in detail below.
With the line list described above, the solar UVES spectrum777The spectrum is available for download at the ESO website: www. eso.org/observing/dfo/quality/UVES/pipeline/solar_spectrum.html, and adopting the parameters: = 5777 K, = 4.44, and = 1.00 km s-1 an abundance of A(Be)888A(Be) = N(Be) = (Be/H) + 12. = 1.10 is obtained. This abundance is in excellent agreement with the one found by Chmielewski et al. (1975), A(Be) = 1.15, and usually adopted as the reference photospheric solar abundance.
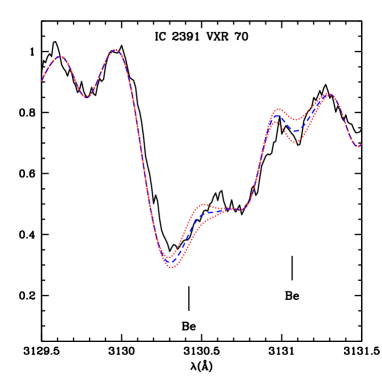
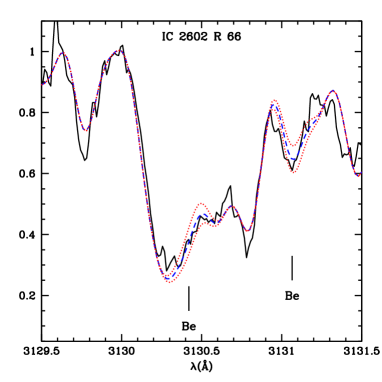
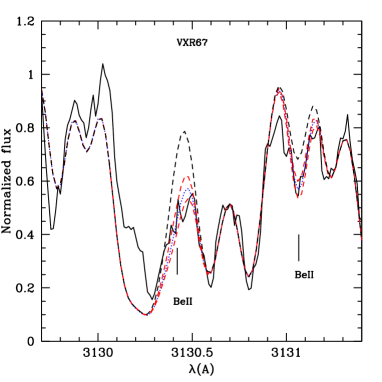
As for some stars in the open cluster IC 4651 analyzed in Smiljanic et al. (2010), the spectra of our sample stars are affected by rotational broadening. Smiljanic et al. (2010) found that from this kind of data reliable, albeit slightly overestimated, Be abundances can be determined. The reader is referred to the discussion presented in Smiljanic et al. (2010) for more details. Examples of the fits for the stars VXR70 (from IC 2391) and R66 (from IC 2602) are shown in Figs. 2 and 3, respectively.
We also derived Be abundances in two stars of the Hyades analyzed in Randich et al. (2007), vb109 and vb182. The abundance we find for both of them is A(Be) = 0.95 0.23 (the two stars have temperatures of 5141 and 5079 K, respectively). That should be compared with A(Be) = 0.80 0.21 derived in Randich et al. (2007).
3.3 The Be 3131 line below 5400 K
Of the two Be resonance lines, the one at 3130 Å is stronger but also more affected by blends. Because of that, the line at 3131 Å is usually preferred for abundance determinations. The latter is, however, also affected by blends. The most important blends are: (i) a Zr i line at 3131.109 Å at its red wing (included in our analysis with parameters determined by Corliss & Bozman, 1962); (ii) two OH (A-X) lines and one CH (C-X) line (included with parameters determined by Castilho et al., 1999) at its blue wing; (iii) an unknown line at its blue wing that we model as a Fe i line following Primas et al. (1997).
The lower the effective temperature the weaker the Be ii lines are expected to become, as the population of the ionized species decreases. The blending features from neutral atoms and molecules, however, increase in importance. One might then question down to what temperatures the Be lines are still reliable abundance indicators.
To address this issue, the behavior of the 3131 Be line in late-type stars cooler than 5400 K was investigated in detail first by Garcia Lopez et al. (1995) and then by Randich et al. (2007). Garcia Lopez et al. (1995) adopted a different solution for the unknown blending line, i.e. increasing the value of a Mn i line at 3131.037 Å by 1.50 dex999 We note that other tentative identifications for the blend have been advocated in the literature. For example, King et al. (1997) decided to enhance the of the Mn ii 3131.015 Å line by +1.726 dex. However, as also pointed out in the paper, they failed to fit the spectrum of Procyon, since this choice predicts a feature that is too strong. In addition, from our exercise we conclude that a feature which increases in strength with decreasing temperature is more adequate. The ionized line of Mn would have the opposite behavior.. This Mn i line is also included in our line list, but with the original determined by Kurucz (1988), i.e. = 1.725. Garcia Lopez et al. (1995) concluded that below 5200 K, the Mn i becomes the dominant component of the blend, therefore the utility of the 3131 Be line as a good abundance indicator decreases. The exact temperature where it might become useless, however, would depend on both the resolution and the S/N ratio of the spectrum. Because of this, Garcia Lopez et al. (1995) were able to put only upper-limits to the Be abundance in their sample stars with 5200 K.
In Randich et al. (2007), a similar exercise was conducted. These authors, however, adopted the same atomic line list that we use in this work and compared the different effects caused by adopting either the Fe i or the Mn i line. Randich et al. (2007) concluded that for stars above 5400 K choosing either of the solutions does not affect in a significant way the Be abundances. For lower temperatures, they found that the Be abundances can differ by 0.150.10 dex between 52505400 K, and up to 0.20 dex at 5000 K. Smaller abundances are derived when the Fe i line is adopted (i.e., this line is found to be always stronger than the Mn one). Using the Fe blend, Randich et al. (2007) concluded that it was possible to measure Be down to the lowest in their sample, 5000 K.
Here, we repeat the exercise, comparing the Fe and Mn lines, but also investigating the influence of the Zr i and the molecular lines on the blend and extending the test down to 4800 K. A comparison of the relative strengths of these lines is shown for five different temperatures in Fig. 4.
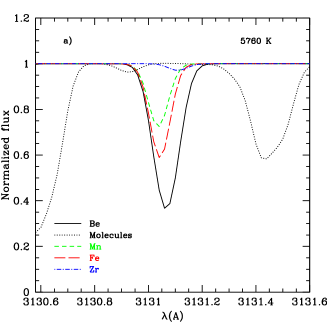
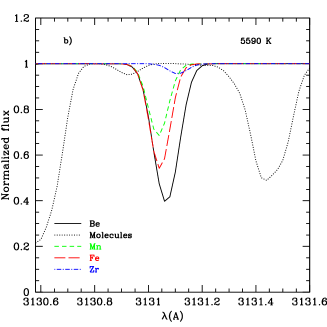
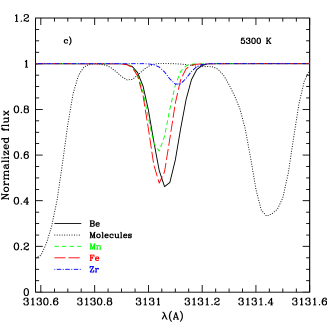
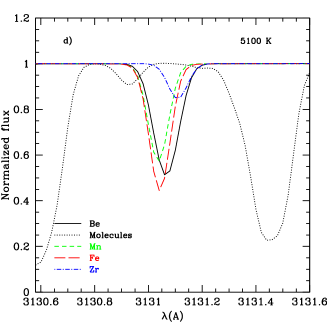
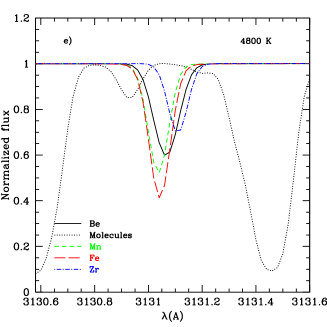
As expected, the Be ii line becomes weaker with decreasing temperature while the lines of Fe i, Mn i, and Zr i all become stronger. At 5100 K, the added contribution of the blending lines are comparable to the strength of the Be line, irrespective of the choice between Fe or Mn. As was found by Randich et al. (2007), the Fe line is always stronger than the Mn line. We also confirm the differences in the Be abundances caused by adopting different lines in the temperatures range studied by Randich et al. (2007). In addition, we find that for even lower temperatures, down to 4800 K, the difference can amount to 0.400.45 dex.
While we have no definitive answer to whether the blend is caused by a Fe or a Mn line, it is clear that had we chosen to use the Mn line in our analysis, we would obtain a trend of increasing Be abundance with decreasing temperature (in Fig. 6), as we would need to compensate for the weaker blend by increasing the Be abundance to fit the 3131 line. This increase in the Be abundance would also make the 3130 line much stronger than observed. Choosing the Fe blending line, we can get a good simultaneous fits of both the 3130 and 3131 lines. Therefore, we conclude here that the Fe line seems to be a better solution for the blend, although in the future it might still be proven that it is not the right one.
Although the Be line is not the dominant line at low temperatures, the blend should still be sensitive to the Be abundance, as long as the blending lines are well constrained. Although this is not perfectly true, from the exercise we conducted we believe to have as good a control over the blends as is currently possible. Thus, using spectrum synthesis, Be abundances can be determined down to at least 4700 K, which is the low-temperature end of our sample. This is illustrated in Fig. 5, where we show the spectra of our coolest sample star in comparison with synthetic spectra with different Be abundances.
To finalize, two points must be stressed. First, for as long as the blends remain not well known, we can not claim to determine absolute Be abundances at the low range with sufficient precision. The relative comparison between similar stars in the same range, however, should be robust. Second, as the Fe line we adopt is the stronger among the possible choices, our Be abundances should be on the low-end. Therefore, our conclusion that there is no significant Be depletion in the stars analyzed here (see Section 4 below) is robust.
3.4 Uncertainties in the Be abundances
The Be abundances are affected by random uncertainties coming from the atmospheric parameters and by uncertainties in the determination of the pseudo-continuum during the spectrum synthesis. To estimate the effect of the atmospheric parameters, we can change each one by its own error, keeping the other ones with the original adopted values, and recalculate the abundances. Thus, we measure how the variation of one parameter affects the abundances. We assume the uncertainties introduced by each parameter to be independent of the other ones. The uncertainty due to the continuum was determined by estimating the sensitivity of the derived Be abundance on the adopted continuum level. This uncertainty is mostly related to the S/N of the spectrum, and thus can be slightly different from star to star. Estimations of these effects are listed in Table 4. The calculations were done for three stars, spanning the rage in temperatures of the sample (VXR67, R14, and SHJM2). In the plots that follow these uncertainties were considered as typical values also for the other sample stars with similar temperatures.
As mentioned in Sec. 2, Randich et al. (2002) has also analyzed one of sample stars, star SHJM2 of IC 2391. The atmospheric parameters they used are the same adopted here. An abundance of A(Be) = 1.11 0.13 was derived. Our own value, A(Be) = 1.20 0.13 agrees with theirs within 1.
| Star | ||||||
|---|---|---|---|---|---|---|
| SHJM2 | 0.05 | 0.10 | 0.00 | 0.03 | 0.05 | 0.13 |
| R14 | 0.05 | 0.10 | 0.05 | 0.00 | 0.10 | 0.16 |
| VXR67 | 0.10 | 0.20 | 0.10 | 0.00 | 0.20 | 0.32 |
3.5 Lithium abundances
Lithium abundances for IC 2391 and IC 2602 were first calculated by Stauffer et al. (1989) and Randich et al. (1997), respectively. The samples of member stars of these two clusters were then reanalyzed and extended by Randich et al. (2001). The Li abundances listed in Tab. 3 were all taken from this last reference. Li abundances are particularly sensitive to temperature and the adopted in Randich et al. (2001) are for a few stars slightly different from the ones adopted here. The differences amount to at most 70 K. According to the analysis presented in Randich et al. (2001), these differences could result in 0.100.15 dex differences in the Li abundances. Differences that are within the uncertainties of the analysis itself (for our sample stars the uncertainties in A(Li) listed in Randich et al. (2001) vary between 0.18 and 0.30 dex).
The Be abundances, on the other hand, are only weakly sensitive to the . Because of this, and because the Li abundances from Randich et al. (2001) are, anyway, consistent within themselves, we decided to just adopt their values for A(Li) instead of recomputing the abundances.
4 Discussion
4.1 Mixing in the pre-main sequence
Solar-type stars start their lifes as fully convective objects with large radii and low central temperature. As they contract, the stellar temperature rises and may eventually reach values high enough to burn the light elements. The rise in temperature can also lead to the development of a radiative core while the convective layer retreats to the upper layers. The radiative core will appear at later ages the smaller the mass and the higher the metallicity of the star. Light element depletion will only be observed if the temperature in the convective zone reaches the values necessary for nuclear burning. If the temperature is high enough for depletion only in the radiative core, no depletion is observed in the photosphere.
Models and observations have shown that stars more massive then 1.20 do not deplete Li during the PMS. The amount of depletion increases for less massive stars. At about 0.6 all Li will be burned before the radiative core is able to develop. As beryllium is less fragile than Li, it is expected to survive longer. Significant Be depletion is expected by the models only for masses below 0.6 (Bodenheimer, 1966; Chabrier & Baraffe, 1997). This expectation, however, has not been empirically tested before and this is our aim here.
Before discussing the Be abundances, lets briefly recall the behavior of the Li abundances in our two clusters. As discussed in Randich et al. (2001), stars more massive then 1.0 do not show signs of Li depletion, while cooler stars are depleted by an amount that increases with decreasing temperature. Randich et al. (2001) concluded that the late-G and early-K stars in IC 2602 present a scatter in Li abundances that is similar, but not as large, as the one seen in the Pleiades. IC 2391 did not show strong evidence of a scatter, but this could be caused by low number statistics. Some correlation with rotation is seen, but not as strong as in the Pleiades.
The dependence of Li depletion on temperature was found to be similar in the two clusters down to 5000 K. At lower temperatures, the stars in IC 2391 seem to be more depleted than the ones in IC 2602. Moreover, some of the stars in the two clusters are more depleted in Li than similar stars in the older Pleiades. These observations point that the pattern of depletion may be affected by the individual properties of each cluster.
The observed correlation between Li and rotation in main-sequence stars in young clusters is a strong indication that the evolution of stellar angular momentum during the PMS affects the efficiency with which Li is burned. In addition to the increase in rotation due to the contraction of the star, the angular momentum evolution is also affected by the interaction of magnetic fields with the disk and/or the stellar wind.
Given the complexity of the processes involved, abundances of both Be and Li are useful to probe the range in temperatures achieved in the convective zone during the PMS. Thus, demonstrating whether the expectation from the models, i.e. that Be is not affected, is important.
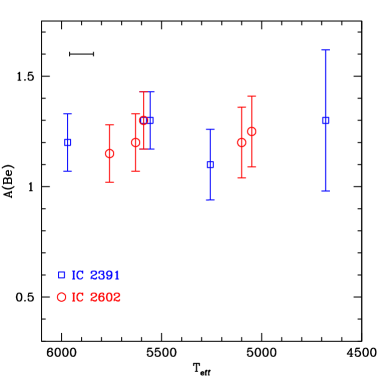
In Fig. 6 we show the Be abundances of the stars as function of the effective temperatures. The mean abundance of our stars is A(Be) = 1.23 0.07. No trend with temperature is detected. Taking into account that the spectra of many of our sample stars are affected by rotational broadening, the Be abundances we derive are expected to be slightly overestimated (see discussion in Smiljanic et al., 2010). Therefore, given the uncertainties, there is no significant difference between the abundances measured in our stars and that observed in the Sun (where A(Be) = 1.10).
Recently, Takeda et al. (2011) proposed that most early-G stars suffer some degree of gradual Be depletion. This conclusion is based on a weak correlation found between A(Be) and in a large sample of solar analogues. However, the observations of Be in old open clusters and the similarity of the Be abundances among cluster members of different ages and field stars seem to argue against that, suggesting instead that no Be depletion has taken place in stars between 6100 K 5600 K. If that is indeed the case, then Fig. 6 strongly suggests that our cooler stars also did not suffer any Be depletion. Below 5000 K, we were only able to determine the Be abundance in one star, VXR67 (see Fig. 5). Although its abundance has a larger error bar, it is fully consistent with the remaining objects. There is no indication of Be depletion.
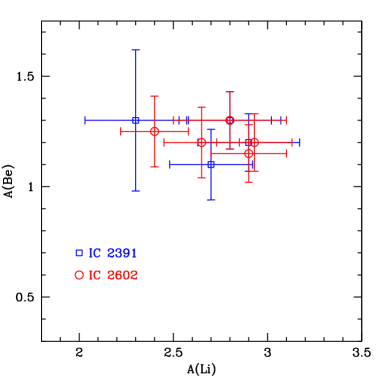
This conclusion is reinforced by Fig. 7, where we plot the Be abundances as a function of the Li abundances derived in Randich et al. (2001). In the case where Be is affected by PMS depletion, one would expect the abundances of Li and Be to correlate, i.e. that stronger Be depletion should be seen in stars with stronger Li depletion. As no such trend is seen in Fig. 7 there is again no indication of Be depletion.
We recall here that, as discussed in Sec. 3.3, the Fe line we adopt as a blend is the stronger among the possible choices. Therefore, any systematic effect introduced by this choice would result in a smaller Be abundance for cooler stars. Thus our conclusion that there is no significant Be depletion in the stars analyzed here is robust.
4.2 Depletion on the main sequence
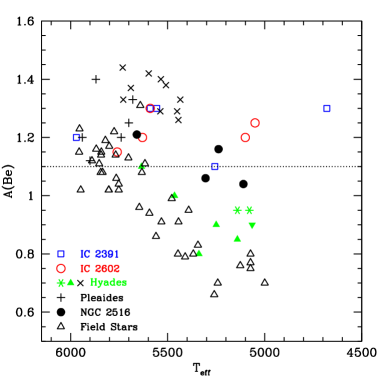
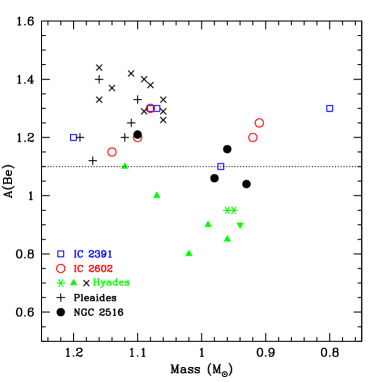
In Fig. 8 we present a comparison of our results with Be abundances of other clusters and field stars. The references from where the abundances were compiled are given in the caption of the figure. All of them derived a solar abundance of beryllium similar to the one we obtain here, and thus are in a similar scale. Exception are the results of Boesgaard and collaborators who found A(Be)⊙ = 1.30 (Boesgaard et al., 2003b). If we were to express the results using the Sun as reference, we would be in the same scale. The addition of their results in Fig. 8 do change our conclusion below, as their stars are located in the same temperature range where all other results also do not find Be depletion.
The masses of the stars shown in the left panel of Fig. 8 were interpolated from theoretical isochrones, for the age of the cluster and the given temperature of the star. The isochrones were calculated with the internet server111111http://www.astro.ulb.ac.be/siess/server/iso.html dedicated to pre-main sequence and main-sequence model calculations presented by Siess et al. (2000). From these isochrones, it seems that the masses of stars older than the ZAMS might be slightly overestimated (by 0.10 ).
The sequence from the clusters to the field in Fig. 8 can be seen as a sequence of age: from IC 2391 and IC 2602 ( 50 Myr), to NGC 2516 ( 150 Myr), the Hyades ( 600 Myr), to the field stars of Santos et al. (2004) (older than 1 Gyr). It is seen that for stars cooler than 5600 K (mass lower than 1.10 ) the degree of Be depletion seems to increase with age. There is also a clear correlation between Be depletion and temperature (mass). The depletion is stronger the lower the mass. As there seems to be no Be depletion for stars at ages of 50 and 150 Myr, we conclude that the Be depletion in this temperature range is taking place during the main sequence, in agreement with the conclusions of Santos et al. (2004) and Randich et al. (2007).
4.3 Comparison with the models
We now compare our abundances with expectations from theoretical models. Isochrones for the early-main sequence were calculated using the internet server of Siess et al. (2000) for solar metallicity (Z = 0.02), with and without overshooting, and for 5 different ages (1, 10, 50, 125, and 600 Myr). In addition to the usual quantities (luminosity and temperature) the models offer additional information such as the surface abundance of the light elements (LiBeB).
When looking at the plots comparing abundances and models, it is important to remember that a star does not keep its temperature constant during the whole age interval for which we show models. In other words, a fixed temperature value in the following plots correspond to stars with different masses depending on the age. For example, at 1 Myr, a star with 3 has 5000 K, but at 50 Myr (onwards) a star with 0.90 has this temperature.
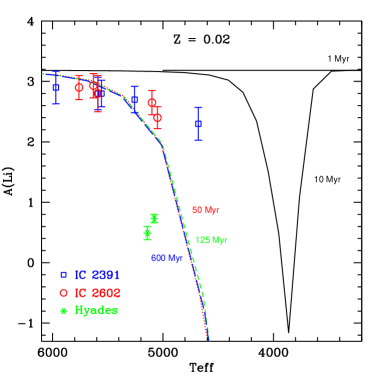
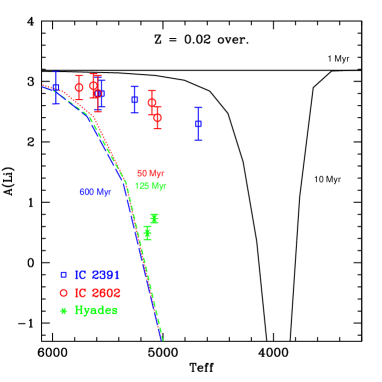
In Fig. 9 we compare the Li abundances with the models without overshooting. Both IC 2391 and IC 2602 have ages of about 50 Myr while the Hyades has 600 Myr. The plot shows what was discussed before, i. e., the models predict too much Li depletion for cool stars and no depletion during the main sequence. The difference between the young clusters and the Hyades, however, suggest that some depletion took place during the main sequence in this older cluster.
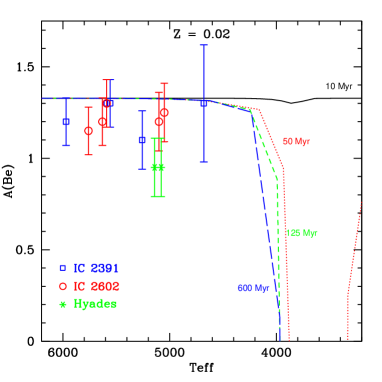
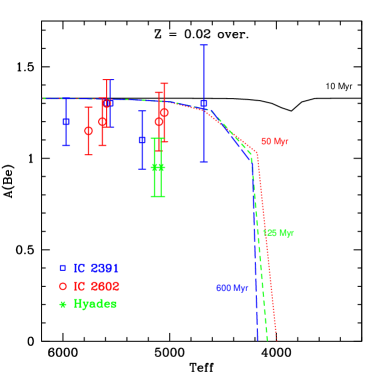
The same comparison is done with the Be abundances in Fig. 10. The models show slightly higher Be abundance because of a difference in the choice of reference solar abundance. Apart from that, the observations agree very well with the models. In the temperature range investigated, which for an age of 50 Myr correspond to a mass range between 0.80 1.20, no Be depletion is expected and none is seen.
Formally, the inclusion of the Hyades stars in these plots and their comparison with the Z = 0.02 models could be questioned as they are more metal rich ([Fe/H] = +0.13). From the models point of view, metallicity is expected to influence the degree of light elements depletion (e.g. Piau & Turck-Chièze, 2002; Sestito et al., 2006). An increased opacity would affect the conditions at the bottom of the convective zone during PMS. In Randich et al. (2007), however, models of PMS Be depletion were calculated for both the solar and the Hyades composition for a star of 0.9 . It was shown that the effect caused by metallicity in this case is negligible. Thus, the observed difference between the Be abundances can not be explained by the difference in metallicity. Sestito et al. (2006) has indeed investigated in detail the effect of heavy-element opacity on PMS Li depletion. They concluded that changes in the abundances are not enough to result in agreement between models and Li observations in low-mass stars of young clusters. Observationally, no significant difference between Li depletion patterns has been found among clusters with similar ages and different metallicities, arguing against a strong metallicity dependence of PMS depletion (Jeffries & James, 1999; Jeffries, 2006).
Similar comparisons are shown in Figs. 11 and 12 but against the models including overshooting. The discrepancy with the Li data is shown to increase when overshooting is taken into account. For Be however, the inclusion of overshooting is still not enough to cause Be depletion in the range of parameters of our sample. From these plots we see that we were still not able to reach down to effective temperatures where Be depletion during the pre-main sequence phases could be detected. If one can push the determination of Be abundances to even lower temperatures, it would be possible to look for the effect of overshooting on Be depletion. Such measurement are, however, be very challenging.
As discussed previously in Randich et al. (2007), the small difference seen between the Be abundances in the Hyades and in IC 2391/2602, seems to point to yet another shortcoming of the models. The mixing mechanism depleting Li during the main sequence seems also to be able to deplete Be, although not as dramatically.
4.4 Evolution of Be in the disk
The average Be abundance in the two clusters is A(Be) = 1.24 0.09 and 1.22 0.06, for IC 2391 and IC2602 respectively. These values can be compared to the average of other young clusters to search for variations of the Be abundance in the disk and to investigate signs of Be evolution with time in the Galaxy. For this comparison we selected from the literature only stars with 5400 K 5800 K, i.e. stars that show no signs of Be depletion. For the clusters analyzed by Boesgaard and collaborators the averages are: A(Be) = 1.33 0.06 for 10 stars of the 600 Myr old Hyades; A(Be) = 1.26 0.07 for 3 stars of the 120 Myr old Pleiades; A(Be) = 1.28 for 2 stars of the 500 Myr old Coma; A(Be) = 1.25 for 1 stars of the 300 Myr old Ursa Major moving group (Boesgaard & King, 2002; Boesgaard et al., 2003a, b, 2004). All these average values seem to be in agreement with each other, given the uncertainties. Although one should keep in mind that there is a small spread in metallicity between the clusters (from [Fe/H] = 0.09 for Coma and [Fe/H] = +0.13 for the Hyades) and that the results are not exactly on the same scale as ours, when seen together they indicate a lack of strong variations in the initial Be abundance among the clusters.
By comparing the Be abundance in these young clusters with the solar abundance, one can search for evidence of Be enrichment in the disk. This task if made difficult by a possible disagreement between the solar photospheric and meteoritic abundances, A(Be) = 1.10 and A(Be) = 1.42 respectively. This meteoritic value recommended by Anders & Grevesse (1989) seems to indicate a photospheric depletion by a factor of two.
Balachandran & Bell (1998) and Bell et al. (2001), however, argued that by accounting for a possible missing near-UV continuum opacity the photospheric Be abundance increases to A(Be) = 1.41, and thus is brought into agreement with the meteoritic one. This conclusion is corroborated by a re-analysis of the Be photospheric solar abundance using 3D hydrodynamical models (Asplund, 2004), where a recommended value of A(Be) = 1.38 is found. As discussed in Asplund (2005) and Asplund et al. (2009), Be abundances in the Sun seem to be largely insensitive to NLTE and 3D effects and this increase is only due to the missing opacity. It is interesting however to notice that two recent re-determinations of the Be abundance in a CI chondrite meteorite yields a value of A(Be) = 1.32 (Makishima & Nakamura, 2006, see also Lodders 2010), which is smaller than the currently recommended photospheric value. The implications of this smaller value have not been discussed in the literature yet, but this lower value might suggest that the ‘missing opacity’ has been overestimated in the above analyses. In their analysis of Be abundances in solar analogues, Takeda et al. (2011) reached similar conclusion.
As discussed before, the Be abundances we derived in the young clusters show no evidence of PMS depletion and are in agreement with the one we derived for the Sun. Thus we can draw the two following conclusions: (1) there is no evidence for significant Be depletion in the Sun, in agreement with the conclusions of Randich et al. (2002, 2007); (2) the similarity of the abundances also indicate that there has been no significant Galactic enrichment of Be in the last 4.5 Gyr since the Sun was formed.
5 Summary
Beryllium abundances were calculated for ten confirmed members of the young pre-main sequence clusters IC 2391 and IC 2602. We also recalculated Be abundances for two main sequence stars of the Hyades. With a careful abundance analysis, we were able to provide actual detections for fast-rotating stars and for stars with effective temperatures down to 4700 K. These young stars ( 50 Myr) have just arrived in the main sequence. Therefore, any alteration in the surface abundance of the light elements Li and Be should have taken place during the PMS phase.
We show that all the stars analyzed have, within the uncertainties, the same Be abundance even though they have different degrees of Li depletion. This result confirms empirically for the first time the theoretical prediction that Be abundances are not affected by mixing during the PMS for stars in the range between 0.80 1.20, as expected by the models. In addition, as discussed in the literature, for stars less massive than the Sun the mixing mechanism depleting Li during the main sequence seems also to be able to deplete Be.
At even lower temperatures ( 4000 K), models with and without overshooting differ in the predicted amount of Be depletion. It is not clear, however, if the Be abundances can be properly determined in such cool stars. The attempt to push the determination of Be abundances to even lower temperatures, although very challenging, could provide important information to differentiate between these models, testing the importance of overshooting during the PMS.
Acknowledgements.
This research has made use of the WEBDA database, operated at the Institute for Astronomy of the University of Vienna, of NASA’s Astrophysics Data System, and of the Simbad database operated at CDS, Strasbourg, France.References
- Anders & Grevesse (1989) Anders, E. & Grevesse, N. 1989, Geochim. Cosmochim. Acta., 53, 197
- Asplund (2004) Asplund, M. 2004, A&A, 417, 769
- Asplund (2005) Asplund, M. 2005, ARA&A, 43, 481
- Asplund et al. (2009) Asplund, M., Grevesse, N., Sauval, A. J., & Scott, P. 2009, ARA&A, 47, 481
- Balachandran et al. (1988) Balachandran, S., Lambert, D. L., & Stauffer, J. R. 1988, ApJ, 333, 267
- Balachandran & Bell (1998) Balachandran, S. C. & Bell, R. A. 1998, Nature, 392, 791
- Balachandran et al. (2011) Balachandran, S. C., Mallik, S. V., & Lambert, D. L. 2011, MNRAS, 410, 2526
- Ballester et al. (2000) Ballester, P., Modigliani, A., Boitquin, O., et al. 2000, The Messenger, 101, 31
- Baraffe & Chabrier (2010) Baraffe, I. & Chabrier, G. 2010, A&A, 521, A44+
- Barrado y Navascués et al. (2001a) Barrado y Navascués, D., Deliyannis, C. P., & Stauffer, J. R. 2001a, ApJ, 549, 452
- Barrado y Navascués et al. (2001b) Barrado y Navascués, D., García López, R. J., Severino, G., & Gomez, M. T. 2001b, A&A, 371, 652
- Barrado y Navascués et al. (2004) Barrado y Navascués, D., Stauffer, J. R., & Jayawardhana, R. 2004, ApJ, 614, 386
- Bell et al. (2001) Bell, R. A., Balachandran, S. C., & Bautista, M. 2001, ApJ, 546, L65
- Bildsten et al. (1997) Bildsten, L., Brown, E. F., Matzner, C. D., & Ushomirsky, G. 1997, ApJ, 482, 442
- Bodenheimer (1966) Bodenheimer, P. 1966, ApJ, 144, 103
- Boesgaard et al. (2003a) Boesgaard, A. M., Armengaud, E., & King, J. R. 2003a, ApJ, 583, 955
- Boesgaard et al. (2003b) Boesgaard, A. M., Armengaud, E., & King, J. R. 2003b, ApJ, 582, 410
- Boesgaard et al. (2004) Boesgaard, A. M., Armengaud, E., & King, J. R. 2004, ApJ, 605, 864
- Boesgaard & King (2002) Boesgaard, A. M. & King, J. R. 2002, ApJ, 565, 587
- Bouvier (2008) Bouvier, J. 2008, A&A, 489, L53
- Butler et al. (1987) Butler, R. P., Marcy, G. W., Cohen, R. D., & Duncan, D. K. 1987, ApJ, 319, L19
- Castelli & Kurucz (2003) Castelli, F. & Kurucz, R. L. 2003, in Proceedings of the IAU Symposium 210: Modelling of Stellar Atmospheres, ed. N. Piskunov, W. W. Weiss, & D. F. Gray (ASP, San Francisco), A20
- Castilho et al. (1999) Castilho, B. V., Spite, F., Barbuy, B., et al. 1999, A&A, 345, 249
- Chaboyer et al. (1995) Chaboyer, B., Demarque, P., & Pinsonneault, M. H. 1995, ApJ, 441, 876
- Chabrier & Baraffe (1997) Chabrier, G. & Baraffe, I. 1997, A&A, 327, 1039
- Chabrier et al. (2007) Chabrier, G., Gallardo, J., & Baraffe, I. 2007, A&A, 472, L17
- Charbonnel et al. (2000) Charbonnel, C., Deliyannis, C. P., & Pinsonneault, M. 2000, in IAU Symposium 198: The Light Elements and their Evolution, ed. L. da Silva, R. De Medeiros, & M. Spite (ASP, San Francisco), 87–+
- Chmielewski et al. (1975) Chmielewski, Y., Brault, J. W., & Mueller, E. A. 1975, A&A, 42, 37
- Coelho et al. (2005) Coelho, P., Barbuy, B., Meléndez, J., Schiavon, R. P., & Castilho, B. V. 2005, A&A, 443, 735
- Corliss & Bozman (1962) Corliss, C. H. & Bozman, W. R. 1962, Experimental transition probabilities for spectral lines of seventy elements (US Dep. of Commerce, National Bureau of Standards, Washington)
- da Silva et al. (2009) da Silva, L., Torres, C. A. O., de La Reza, R., et al. 2009, A&A, 508, 833
- Dekker et al. (2000) Dekker, H., D’Odorico, S., Kaufer, A., Delabre, B., & Kotzlowski, H. 2000, in Proc. SPIE, Optical and IR Telescope Instrumentation and Detectors, ed. M. Iye & A. F. Moorwood, Vol. 4008 (SPIE), 534–545
- Deliyannis et al. (2000) Deliyannis, C. P., Pinsonneault, M. H., & Charbonnel, C. 2000, in IAU Symposium 198: The Light Elements and their Evolution, ed. L. da Silva, R. De Medeiros, & M. Spite (ASP, San Francisco), 61
- Dobbie et al. (2010) Dobbie, P. B., Lodieu, N., & Sharp, R. G. 2010, MNRAS, 409, 1002
- D’Orazi & Randich (2009) D’Orazi, V. & Randich, S. 2009, A&A, 501, 553
- Duncan & Jones (1983) Duncan, D. K. & Jones, B. F. 1983, ApJ, 271, 663
- Ford et al. (2002) Ford, A., Jeffries, R. D., & Smalley, B. 2002, A&A, 391, 253
- Garcia Lopez et al. (1994) Garcia Lopez, R. J., Rebolo, R., & Martin, E. L. 1994, A&A, 282, 518
- Garcia Lopez et al. (1995) Garcia Lopez, R. J., Rebolo, R., & Perez de Taoro, M. R. 1995, A&A, 302, 184
- Hünsch et al. (2004) Hünsch, M., Randich, S., Hempel, M., Weidner, C., & Schmitt, J. H. M. M. 2004, A&A, 418, 539
- James & Jeffries (1997) James, D. J. & Jeffries, R. D. 1997, MNRAS, 292, 252
- Jeffries (1999) Jeffries, R. D. 1999, MNRAS, 309, 189
- Jeffries (2006) Jeffries, R. D. 2006, in Chemical Abundances and Mixing in Stars in the Milky Way and its Satellites, ESO Astrophysics Symposia, ed. Randich, S. & Pasquini, L. (Springer-Verlag, Berlin-Heidelberg), 163
- Jeffries et al. (2009) Jeffries, R. D., Jackson, R. J., James, D. J., & Cargile, P. A. 2009, MNRAS, 400, 317
- Jeffries & James (1999) Jeffries, R. D. & James, D. J. 1999, ApJ, 511, 218
- Jones et al. (1997) Jones, B. F., Fischer, D., Shetrone, M., & Soderblom, D. R. 1997, AJ, 114, 352
- Jones et al. (1996) Jones, B. F., Shetrone, M., Fischer, D., & Soderblom, D. R. 1996, AJ, 112, 186
- King et al. (1997) King, J. R., Deliyannis, C. P., & Boesgaard, A. M. 1997, ApJ, 478, 778
- King et al. (2000) King, J. R., Krishnamurthi, A., & Pinsonneault, M. H. 2000, AJ, 119, 859
- King et al. (2010) King, J. R., Schuler, S. C., Hobbs, L. M., & Pinsonneault, M. H. 2010, ApJ, 710, 1610
- Kurucz (1993) Kurucz, R. 1993, ATLAS9 Stellar Atmosphere Programs and 2 km/s grid. CD-ROM No. 13. Cambridge, Mass.: Smithsonian Astrophysical Observatory.
- Kurucz (1988) Kurucz, R. L. 1988, in Transactions of the International Astronomical Union, Volume XXB, ed. M. McNally (Kluwer, Dordrecht), 168–172
- Lodders (2010) Lodders, K. 2010, in Principles and Perspectives in Cosmochemistry, Astrophysics and Space Science, ed. A. Goswami & B. E. Reddy (Springer, Berlin), 379–+
- MacDonald & Mullan (2010) MacDonald, J. & Mullan, D. J. 2010, ApJ, 723, 1599
- Makishima & Nakamura (2006) Makishima, A. & Nakamura, E. 2006, Geostandards and Geoanalytical Research, 30, 245
- Martin & Claret (1996) Martin, E. L. & Claret, A. 1996, A&A, 306, 408
- Martin & Montes (1997) Martin, E. L. & Montes, D. 1997, A&A, 318, 805
- Mendes et al. (1999) Mendes, L. T. S., D’Antona, F., & Mazzitelli, I. 1999, A&A, 341, 174
- Mermilliod et al. (2009) Mermilliod, J.-C., Mayor, M., & Udry, S. 2009, A&A, 498, 949
- Patten & Simon (1996) Patten, B. M. & Simon, T. 1996, ApJS, 106, 489
- Piau & Turck-Chièze (2002) Piau, L. & Turck-Chièze, S. 2002, ApJ, 566, 419
- Pinsonneault (1997) Pinsonneault, M. 1997, ARA&A, 35, 557
- Platais et al. (2007) Platais, I., Melo, C., Mermilliod, J., et al. 2007, A&A, 461, 509
- Primas et al. (1997) Primas, F., Duncan, D. K., Pinsonneault, M. H., Deliyannis, C. P., & Thorburn, J. A. 1997, ApJ, 480, 784
- Prosser et al. (1996) Prosser, C. F., Randich, S., & Stauffer, J. R. 1996, AJ, 112, 649
- Randich (2001) Randich, S. 2001, A&A, 377, 512
- Randich et al. (1997) Randich, S., Aharpour, N., Pallavicini, R., Prosser, C. F., & Stauffer, J. R. 1997, A&A, 323, 86
- Randich et al. (1998) Randich, S., Martin, E. L., Lopez, R. J. G., & Pallavicini, R. 1998, A&A, 333, 591
- Randich et al. (2001) Randich, S., Pallavicini, R., Meola, G., Stauffer, J. R., & Balachandran, S. C. 2001, A&A, 372, 862
- Randich et al. (2002) Randich, S., Primas, F., Pasquini, L., & Pallavicini, R. 2002, A&A, 387, 222
- Randich et al. (2007) Randich, S., Primas, F., Pasquini, L., Sestito, P., & Pallavicini, R. 2007, A&A, 469, 163
- Randich et al. (1995) Randich, S., Schmitt, J. H. M. M., Prosser, C. F., & Stauffer, J. R. 1995, A&A, 300, 134
- Santos et al. (2004) Santos, N. C., Israelian, G., Randich, S., García López, R. J., & Rebolo, R. 2004, A&A, 425, 1013
- Sbordone (2005) Sbordone, L. 2005, Memorie della Societa Astronomica Italiana Supplement, 8, 61
- Sbordone et al. (2004) Sbordone, L., Bonifacio, P., Castelli, F., & Kurucz, R. L. 2004, Memorie della Societa Astronomica Italiana Supplement, 5, 93
- Sestito et al. (2006) Sestito, P., Degl’Innocenti, S., Prada Moroni, P. G., & Randich, S. 2006, A&A, 454, 311
- Sestito et al. (2003) Sestito, P., Randich, S., Mermilliod, J.-C., & Pallavicini, R. 2003, A&A, 407, 289
- Siess et al. (2000) Siess, L., Dufour, E., & Forestini, M. 2000, A&A, 358, 593
- Smiljanic et al. (2009) Smiljanic, R., Pasquini, L., Bonifacio, P., et al. 2009, A&A, 499, 103
- Smiljanic et al. (2010) Smiljanic, R., Pasquini, L., Charbonnel, C., & Lagarde, N. 2010, A&A, 510, A50
- Smiljanic et al. (2008) Smiljanic, R., Pasquini, L., Primas, F., et al. 2008, MNRAS, 385, L93
- Soderblom et al. (1995) Soderblom, D. R., Jones, B. F., Stauffer, J. R., & Chaboyer, B. 1995, AJ, 110, 729
- Soderblom et al. (1990) Soderblom, D. R., Oey, M. S., Johnson, D. R. H., & Stone, R. P. S. 1990, AJ, 99, 595
- Soderblom et al. (1993) Soderblom, D. R., Pilachowski, C. A., Fedele, S. B., & Jones, B. F. 1993, AJ, 105, 2299
- Stauffer et al. (1989) Stauffer, J., Hartmann, L. W., Jones, B. F., & McNamara, B. R. 1989, ApJ, 342, 285
- Stauffer et al. (1997) Stauffer, J. R., Hartmann, L. W., Prosser, C. F., et al. 1997, ApJ, 479, 776
- Stephens et al. (1997) Stephens, A., Boesgaard, A. M., King, J. R., & Deliyannis, C. P. 1997, ApJ, 491, 339
- Stuik et al. (1997) Stuik, R., Bruls, J. H. M. J., & Rutten, R. J. 1997, A&A, 322, 911
- Stütz et al. (2006) Stütz, C., Bagnulo, S., Jehin, E., et al. 2006, A&A, 451, 285
- Takeda et al. (2011) Takeda, Y., Tajitsu, A., Honda, S., et al. 2011, PASJ, 63, 697
- van Leeuwen (2009) van Leeuwen, F. 2009, A&A, 497, 209
- Ventura et al. (1998) Ventura, P., Zeppieri, A., Mazzitelli, I., & D’Antona, F. 1998, A&A, 331, 1011
- Xiong & Deng (2005) Xiong, D. & Deng, L. 2005, ApJ, 622, 620