Disordered Silicates in Space: a Study of Laboratory Spectra of “Amorphous” Silicates
Abstract
We present a laboratory study of silicate glasses of astrophysically relevant compositions including olivines, pyroxenes and melilites. With emphasis on the classic Si–O stretching feature near 10m, we compare infrared spectra of our new samples with laboratory spectra on ostensibly similar compositions, and also with synthetic silicate spectral data commonly used in dust modeling. Several different factors affect spectral features including sample chemistry (e.g., polymerization, Mg/Fe ratio, oxidation state and Al-content) and different sample preparation techniques lead to variations in porosity, density and water content. The convolution of chemical and physical effects makes it difficult to attribute changes in spectral parameters to any given variable. It is important that detailed chemical and structural characterization be provided along with laboratory spectra. In addition to composition and density, we measured the glass transition temperatures for the samples which place upper limits on the formation/processing temperatures of these solids in space.
Popular synthetically-generated optical functions do not have spectral features that match any of our glass samples. However, the 10m feature generated by the synthetic data rarely exactly matches the shape and peak position of astronomically observed silicate features. Our comparison with the synthetic spectra allows astronomers to determine likely candidates amongst our glass samples for matching astronomical observations.
1 Introduction
Understanding the nature and formation of cosmic dust is crucial to our understanding of the cosmos. Over its 50-year history, infrared (IR) astronomy has shown that dust contributes to the physical processes inherent in star formation and mass-loss from evolved stars, as well as to several interstellar processes such as gas heating and the formation of molecules (e.g. Videen & Kocifaj, 2002; Draine, 2003; Krishna-Swamy, 2005; Krugel, 2008). In particular, silicate grains dominate dust emission in many astrophysical environments. The “amorphous” m and m silicate spectral features have been observed in almost every direction and to almost any distance, but the precise nature of this silicate dust remains a mystery. Here we present a laboratory investigation of amorphous silicates, the type of dust grains most frequently inferred to exist from observational data.
1.1 A brief history of the “amorphous” silicate spectral features
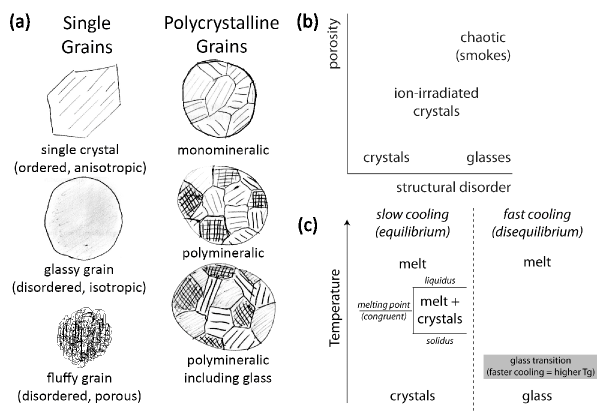
The classic “10 m” silicate feature was first observed in the late sixties in the IR spectra of several M-type giants and red supergiants (RSGs; Gillett et al., 1968). Shortly thereafter a 10 m absorption feature was discovered in the interstellar medium (ISM; Knacke et al., 1969; Hackwell et al., 1970). Since then, it has been found to be almost ubiquitous, occurring in many astrophysical environments including the solar system and extrasolar planetary systems (e.g., Mann et al., 2006, and references therein), the circumstellar regions of both young stellar objects and evolved intermediate mass stars (asymptotic giant branch; AGB stars, and planetary nebulae; e.g., Speck et al., 2000; Casassus et al., 2001); many lines of sight through the interstellar medium in our own galaxy (e.g., Chiar et al., 2007); and in nearby and distant galaxies (e.g., Hao et al., 2005). Initially this feature was attributed to silicate minerals (Woolf & Ney, 1969), based on mixtures of spectra of crystalline silicate species predicted to form by theoretical models (Gaustad, 1963; Gilman, 1969). However, laboratory spectra of crystalline silicate minerals showed more structure within the feature than observed in the astronomical spectra (see e.g., Woolf, 1973; Huffman & Stapp, 1973). Subsequent comparison with natural glasses (obsidian and basaltic glass; from e.g., Pollack et al., 1973) and with artificially disordered silicates (Day, 1979; Krätschmer & Huffman, 1979) showed that “amorphous” silicate was a better candidate for the 10 m feature than any individual crystalline silicate mineral. Since then, it has been commonly assumed that description of silicate as disordered or “amorphous” is synonymous with glassy silicate. However, this is an oversimplification. The term “glass” has a specific definition, i.e. the solid has no long-range order beyond nearest-neighbor atoms. “Crystalline” is often taken to mean single crystals, but it is possible to form poly-nanocrystalline agglomerates, with a continuum which essentially extends from a true glass to a single crystal grain. Furthermore, natural and synthetic “glasses” often contain microlites111micro- or nano-crystalline inclusions within a glassy matrix (see e.g., Pollack et al., 1973; Jäger et al., 1994). Prior to Zachariasen (1932) the difference between nanocrystalline (i.e. ceramic) and glassy solids was not understood.In addition, one might expect agglomerated particles to be polymineralic, and possibly to contain both crystalline and glassy constituents. Nuth & Hecht (1990) introduced the idea of “chaotic silicate” in which the level of disorder is even greater than for glass. A chaotic silicate does not have to be stoichiometric, can contain different compositional zones within a single grain, and may be porous, and therefore much lower density than a glass. This range of possible grain types is demonstrated schematically in Fig. 1.
In astrophysical environments, whether a solid is glassy, crystalline or some combination of the two has implications for its formation, and subsequent processing, evolution and destruction, and thus it is important to have tools to distinguish between such grain types. For example, true glasses with no inclusions will not transform into crystals below their glass transition temperature (; see § 1.3), whereas a glass already containing microlites can continue to crystallize at slightly lower temperatures. In the case of terrestrial obsidians, with 900 K 1000 K, elemental diffusion profiles suggest that crystal growth can continue down to 700 K (e.g., Watkins et al., 2009). If poly-nano-crystalline grains can be distinguished spectroscopically in the lab from truly glassy grains, we can test for their presence in astrophysical environments. For instance Speck & Hofmeister (2004) showed that there is a difference between single crystal and polynanocrystalline silicon carbide (SiC), while Speck, Thompson & Hofmeister (2005) showed that glassy SiC looks different than various crystalline samples. These laboratory data were invoked to explain changes in SiC grains formed as carbon stars evolve. For silicates, laboratory data on poly-nano-crystalline samples are lacking. Whether grains are glassy or poly-nano-crystalline is an indicator of whether grains form or are processed above . If the two forms cannot be distinguished in laboratory spectra, then the “amorphous” nature of silicates in space would no longer necessarily imply a truly glassy structure, allowing the possibility of higher dust formation temperatures.
Many observations have shown that the 10 m silicate feature varies from object to object and even within a single object both temporally (e.g., Monnier et al., 1998) and spatially (e.g. in Car, N. Smith, Pers. Comm). Within a single type of astrophysical object, the feature shows huge variations in terms of its peak position, width and its ratio to the m feature (e.g. Speck, 1998; Ossenkopf, Henning, & Mathis, 1992). Variations in feature shape from star to star cannot be explained in terms of optical depth or grain temperature effects. Several interpretations of these observations have been suggested including: grain size effect (e.g., Papoular & Pégourié, 1983); Mg/Fe ratio and (Mg+Fe)/Si ratio (e.g. Dorschner et al., 1995); inclusion of oxide grains (e.g., Speck et al., 2000); increasing crystallinity (e.g., Sylvester et al., 1998; Bouwman et al., 2001); grain shape (e.g., Min et al., 2007); and grain porosity (e.g., Voshchinnikov & Henning, 2008; Henning & Stognienko, 1993). However, all models of these effects utilize laboratory spectra, and are only as reliable as the data that goes into them.
The near ubiquity of “amorphous” silicate features and their variations in strength, width, peak position and the ratio of the 10 m/18 m features potentially provide the diagnostic tools to understand the detailed mechanisms by which dust is formed, processed and destroyed. However, existing laboratory and synthetic spectra are not sufficiently well understood to achieve this goal.
1.2 A brief synopsis of existing laboratory and synthetic spectra for disordered silicates
Since the discovery of the 10 m feature, there have been many laboratory studies producing IR spectra and optical functions222Usually these are called optical “constants”, but they are wavelength-dependent quantities, so we prefer “functions” of various samples for comparison with and modeling of observational data. In addition, synthetic optical functions have been derived from observational spectra, often combined with laboratory mineral data, in order to match the observed features (e.g., Draine & Lee, 1984; Volk & Kwok, 1988; Ossenkopf, Henning, & Mathis, 1992).
The first laboratory spectra used in astronomical silicate studies were of crystalline silicates and natural glasses (obsidian and basaltic glass, which contain some microlites; e.g., Pollack et al., 1973). Various studies produced “amorphous” samples through chemical vapor deposition (e.g., Day, 1979), smokes (e.g., Nuth & Donn, 1982), ion-irradiation of crystalline samples (e.g., Krätschmer & Huffman, 1979), laser ablation of crystalline samples (Scott & Duley, 1996), and quenching melts to glass (e.g., Dorschner et al., 1995; Jäger et al., 2003). However, these techniques yield different results. For instance the peak positions, full width at half maxima (FHWMa) and ratios of the strengths of the 10 and 18 m features vary between datasets even though the materials investigated are ostenibly the same composition. Spectra from samples with the same reported composition vary, which should not occur if the samples had the same structures, and if all spectra were obtained under optically thin conditions. A detailed comparison between existing and new laboratory data are given in § 3. The sample preparation techniques vary widely and lead to a range of disordered structures. Unfortunately we do not have sufficient information on the physical structure or chemical characteristics of previously studied samples to determine the effects quantitively, but a qualitative analysis presented here highlights the need to make such sample information available.
The data used most commonly for modeling astronomical environments are synthetic optical functions such as Draine & Lee (1984, hereafter DL) and Ossenkopf, Henning, & Mathis (1992, hereafter OHM). These data are favored over laboratory spectra because they have broad wavelength coverage, which is not true of individual laboratory datasets. However, these synthetic functions were produced using compilations of laboratory spectral data and astronomical observed dust opacities from which new optical functions were calculated. The derived optical functions were then modified specifically to match the astronomical observations. For instance, in the DL data, the 9.7 m feature is entirely derived from observational opacities, while the NIR-NUV section of their optical function uses laboratory data from crystalline olivine studies, and the FUV/X-ray region uses laboratory data for crystalline alumina (Al2O3). Both DL and OHM blend laboratory and astronomical data and their optical functions will match some spectral features, and can be used for comparison of optical depths between different dusty environments. However, they do not represent real solids and thus cannot be used to determine the true nature of dust in space, how it varies spatially or temporally, or why.
1.3 A brief guide to the structure of silicate minerals, glasses and the glass transition
The basic building block of silicates is the SiO tetrahedron. These can be linked in a framework, with each oxygen shared between two tetrahedra (e.g. SiO2 minerals and feldspars), or they can be linked in chains (e.g. pyroxenes such as diopside [Di; CaMgSi2O6], enstatite [En;MgSiO3]) or they can be isolated tetrahedra (e.g. the olivines series: forsterite [fo; Mg2SiO4] to fayalite [fa; Fe2SiO4]). In all cases, the non-shared oxygens (known as non-bridging oxygens or NBOs) are charge-balanced by other cations (e.g. Mg2+, Fe2+, Ca2+, Na+, etc). The Ca-Mg-Al silicates that are expected to form in circumstellar environments are dominantly of pyroxene and olivine composition.
Within each mineral group, solid solution allows compositions to vary between end-members. In the case of similarly-sized cations the solution may be continuous e.g., enstatite to ferrosilite (fs; FeSiO3) and the olivine series. Given the availability of other cations, end-member pyroxenes rarely occur in terrestrial or meteoritic samples. Where the substituting cation is a different size, solid solution is more limited, for example between enstatite and diopside. In such cases, solid solution becomes less extensive at lower temperatures, so that cooling may lead to “exsolution” of two different pyroxene compositions from an initially homogeneous high-temperature solid.
Minerals occur as crystals that possess long-range order, with very narrow distributions of bond angles and lengths. This leads both to anisotropy (properties varying with crystal orientation) and narrow spectral features. Silicate glasses are the “frozen” structural equivalents of liquids, possessing short-range order (so that local charge-balance is conserved for example) but lacking the long-range order that gives rise to symmetry and anisotropy in crystals. Glasses are therefore both isotropic and have broad spectral features.
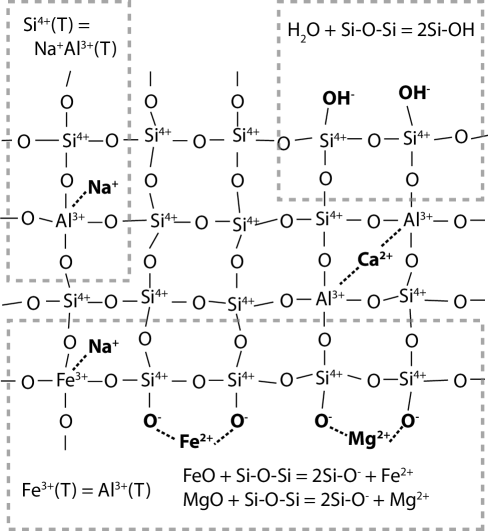
The basic structural unit of silicate glasses and melts is the SiO tetrahedron, as is the case in crystalline silicate minerals. Oxygens linking tetrahedra are known as bridging oxygens (BO), while non-bridging oxygens (NBO) are coordinated by metal cations, which are termed network-modifiers in this role. Tetrahedral cations (T) include not only Si4+, but also trivalent cations such as Al3+ and Fe3+; these must be charge-balanced by other cations (usually alkalis or alkaline earths; Fig. 2). The degree of polymerization of a melt or glass can be summarized by the ratio of NBO/T, which can range from 0 (fully polymerized, e.g. SiO2) to 4 (fully depolymerized, e.g. Mg2SiO4). In general, more polymerized melts are more viscous and have higher glass transition temperatures. On quenching a melt, its structure is “frozen in” at the glass transition if cooling is rapid enough to prevent crystallization. The glass transition is actually an interval, often approximated by the glass transition temperature () which is usually taken to be the temperature at which the viscosity is 1012 Pa.s (). Rapid cooling from a given temperature preserves the network present in the liquid at that particular temperature. Because of this behavior, glasses of any given composition can have subtle differences in structure that depend on cooling rates. The temperature at which the glass has the same structure as the melt is called the fictive temperature (). See Mysen & Richet (2005) for a comprehensive review of melt structure and properties.
Two issues whose importance will be discussed in the current work are the role of water and the oxidation state of iron. At low water contents (less than about 1 wt.% total H2O), water dissolves in silicate glasses almost exclusively as hydroxyl (OH-) ions (Stolper, 1982), and acts as a network modifier (Fig. 2). Compared to other modifier oxides such as Na2O and MgO, water has a more dramatic effect in reducing melt viscosity and glass transition temperatures (Dingwell et al., 1996). Iron can play the role of network modifier (octahedral Fe2+ or Fe3+) or network-forming cation (tetrahedral Fe3+). Consequently, the oxidation state of an iron-bearing glass or melt has a significant effect on its structure and properties.
From the perspective of cosmic dust formation, the glass transition temperature is essentially the temperature above which a given composition should form as or convert to crystalline solids, whereas solids formed below this temperature will be glassy if they cool sufficiently rapidly (Richet et al., 1993; Speck et al., 2008). More depolymerized melts are more difficult to quench, and melts less polymerized than pyroxenes (NBO/T 2) typically require extreme quench rates (100s K s-1) using methods such as containerless laser processing to achieve truly glassy samples (Tangeman et al., 2001). For a given composition, faster cooling rates result in a higher Tg. This dependence can be determined by differential scanning calorimetry using different heating and cooling rates, and is used to determine the cooling rate of natural lava samples (Wilding et al., 1995).
For depolymerized silicates (e.g. olivines and pyroxenes), if glassy grains form they must do so below their because the cooling rate required for quenching to a glass is extremely rapid. Highly polymerized silicates (e.g. silica, obsidian) can be cooled more slowly, over hours or days, and not crystallize (Schairer & Bowen, 1956). However, the cooling timescales (months) determined by Speck et al. (2008) for AGB star circumstellar shells are sufficiently long as to preclude the preservation of glassy/chaotic solids that form above , because annealing timescales are shorter than those for cooling for all but the most polymerized silicates.
1.4 The need for new data
Modeling of silicate dust in space has been limited by the available laboratory data The influence of various model parameters was investigated by Jones & Merrill (1976), who found that using so-called “clean” (i.e. pure magnesium) silicate grains to model the observed 9.7 m features did not yield a good fit due to the lack of absorption by these grains in the visible and near-IR. They also found that just mixing in more absorbing grains did not solve the problem. This led to the suggestion that the grains responsible for the 9.7 m feature are “dirty” silicates, i.e. Mg-silicates with impurities introduced into the matrix giving more opacity in the optical and near-IR.
It is known that NBO/T (polymerization) affects the spectra of amorphous silicates such that the peak position of the 10 m feature shifts redwards as NBO/T increases (e.g. OHM). Aluminium (Al) is a network former and consequently Al content strongly affects NBO/T. Mutschke et al. (1998) suggested that Al may be an important component of silicates in space that could explain why previous laboratory spectroscopic studies failed to match observational data. Other cations may be equally important. Ca2+ and Fe2+ both substitute for Mg, while Fe3+ will substitute for tetrahedral site (e.g. Si or Al3+). Therefore, the oxidation state is another important variable in addition to elemental substitutions.
Existing laboratory spectral data for “amorphous” silicates were produced using samples that are not sufficiently well-characterized to allow astronomers to interpret their observations without ambiguity. Here we present new laboratory spectra of several silicate glasses of astronomical relevance, and discuss compositional factors that influence their spectral features. We compare these new data with those previously available for “amorphous” silicates and discuss how these samples compare to successfully-applied synthetic optical functions. We find that the synthetic spectra cannot be well matched by the conventionally assumed glassy silicate composition and discuss whether astrophysical silicates need to be truly glassy.
2 Experimental Methods
2.1 Sample selection
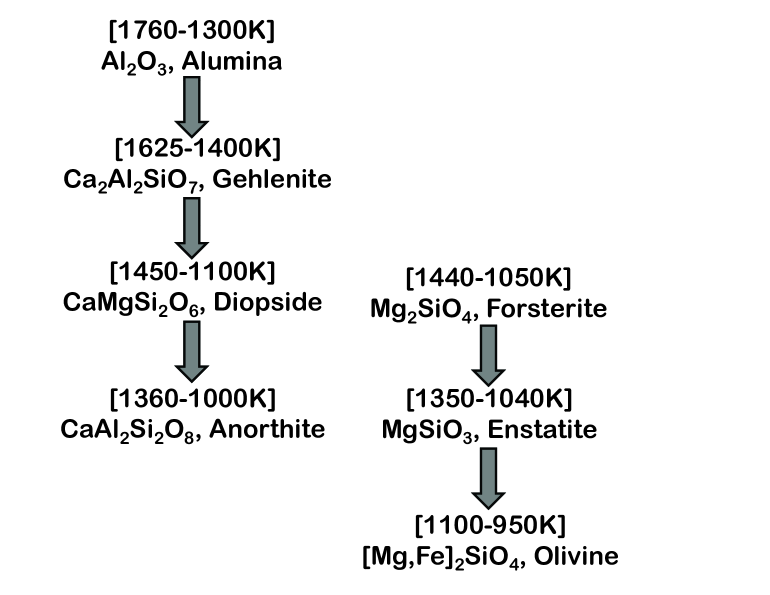
The bulk composition of silicate stardust lies somewhere between pyroxene (M2Si2O6) and olivine (M2SiO4), where M indicates metal cations, with Mg and Fe being the most abundant. The cosmic Mg/Si ratio is predicted to be 1.02, while Fe/Si 0.84 (e.g., Lodders & Fegley, 1999). However, most Fe is expected to combine with S, Ni, Cr, Mn and other siderophile elements into metallic grains (Gail & Sedlmayr, 1999; Lodders & Fegley, 1999). This partitioning is reflected in the Earth, where most iron resides in the metallic core while the mantle is dominated by magnesium-rich silicate with Mg/Fe 9. The predicted bulk cosmic silicate would then be close to MgSiO3, with minor amounts of iron leading to an atomic (Mg+Fe)/Si ratio slightly greater than 1. Determining the spectra of various olivine and pyroxene glasses is therefore of critical importance for identifying the silicate mineralogy. The focus of this study is glass compositions for which data already exist in the astronomy literature i.e. predominantly olivines and pyroxenes (See Table 1 and references therein). Mg-rich endmembers are forsterite and enstatite, respectively. Another mineral that is commonly discussed in astromineralogy is diopside, which is also a pyroxene. Diopside has been invoked to explain observed crystalline silicate features (e.g. Demyk et al., 2000; Kemper et al., 2002; Hony et al., 2009; Onaka & Okada, 2003) and appears in the classic condensation sequence for dust formation (e.g. Tielens, 1990, see Fig. 3). Furthermore, aluminous diopside formed in the experimental condensation study by Toppani et al. (2006), and Demyk et al. (2004) showed that crystalline diopside grains can easily be amorphized by heavy ion irradiation.
To complement the olivines and pyroxenes (Table 1) we include four samples from the melilite series, whose endmembers are gehlenite (Ge; Ca2Al2SiO7) and åkermanite (Åk; Ca2MgSi2O7). gehlenite is predicted to be among the first-formed silicate grains (e.g., Tielens, 1990; Lodders & Fegley, 1999, see Figure 3), and the major repository for calcium and aluminum in dust, whereas pyroxenes are predicted to be among the most abundant grains, and the major repository for Mg and Si (e.g., Tielens, 1990; Lodders & Fegley, 1999; Gail & Sedlmayr, 1999). Furthermore aluminium and calcium are highly depleted from the gas phase and are assumed to be included in dust (Whittet, 1992). Aluminum-rich silicates like gehlenite and other melilites are major constituents of Calcium-Aluminum-rich Inclusions (CAIs) and gehlenite has been identified in red supergiants (Speck et al., 2000) and Active Galactic Nuclei (AGN) environments (Jaffe et al., 2004) and in meteorites (Stroud et al., 2008; Vollmer et al., 2007). Furthermore, a recent Type Ib supernova (SN2005E) has been shown to contain more calcium than expected (Perets et al., 2010). Indeed almost 50% of its ejecta mass (or 0.1M⊙) is attributed to calcium. Chihara et al. (2007) reported laboratory spectra of crystalline melilites every 10% along the solid-solution join between åkermanite and gehlenite. Mutschke et al. (1998) reported laboratory spectra of two glasses: end-member gehlenite, and åk50-ge50. Given that the cosmic Mg/Ca ratio is 16, it seems likely that melilites could have substantial åkermanite contents. The difference in the structure of the glasses is profound: NBO/T is 0.67 for gehlenite and 3.0 for åkermanite, while Al/Si is 2 for gehlenite and 0 for åkermanite.
Both theoretical models (Li & Li, 2009) and observations (Jones & Merrill, 1976) suggest that some iron is incorporated into silicates. Jäger et al. (1994) presented spectra for two silicate glasses containing the most abundant dust forming elements (i.e. Mg, Si, Fe, Ca, Al, Na). However, iron in their sample was partially oxidized (FeO/Fe2O1) which leads to problems in interpreting the spectrum (see § 1.3). With this in mind we present a sample we call “Basalt” (), which contains ferrous iron (Fe2+).
While iron has been invoked to explain opacity problems, most iron is expected to combine with other siderophile elements to form metal or metal sulfide grains rather than silicate (Gail & Sedlmayr, 1999; Lodders & Fegley, 1999). Consequently, we have synthesized an iron-free silicate glass using cosmic abundance ratios for Mg, Si, Al, Ca, and Na, yielding . This sample does not include volatile elements or iron and is quite close to enstatite in composition. This “cosmic silicate” is designed to test the Stencel et al. (1990) hypothesis that dust forms as chaotic solids with the elemental abundances of the gas.
Pollack et al. (1973) provided spectra of obsidian, a naturally occurring glassy silicate. Consequently we include obsidian glass in our sample, in part because this is the origin of the attribution of the 10 m feature to amorphous silicates. It is also useful for studying the effect of silicate structure and composition on spectral parameters because it is different from the more commonly assumed olivines and pyroxenes.
Finally, we include silica (SiO2) glass in our sample. Like obsidian, the structure of SiO2 is significantly different from olivines and pyroxenes and thus provides potential insight into the effects of structure on silicate spectral features. Furthermore, silica dust grains have been invoked to explain observed astronomical spectral features in both evolved stars (Speck et al., 2000) and in young stellar objects (e.g. Sargent et al, 2006).
The samples investigated here are listed in Table 2.
2.2 Sample synthesis and preparation
Samples designated with “synthetic” in their name are generated from mixtures of reagent-grade oxides and carbonates, providing glasses with compositions like those of end-member minerals. The “cosmic” silicate was also synthesized in this way. In contrast, samples designated as “remelt” were generated by melting natural mineral samples. Consequently the “remelt”-samples have compositions whose additional components reflect the impurities333 Unlike minerals, glasses do not have to have well-defined formulae. Some studies describe such non-stoichiometric glasses as having large quantities of impurities, but these non-mineral-end-member compositions are simply what the glass is made of. found in natural crystalline samples of the relevant minerals. Using both synthetic and remelted samples helps to demonstrate the effect and importance of small compositional variations in silicates.
Synthesis of silicate glasses from oxide and carbonate starting materials, was undertaken at the MU experimental petrology facility and the procedures are described in detail by Getson & Whittington (2007). Melilite glasses were prepared by fusion in Pt crucibles and quenched by pouring into graphite molds (slow cooling), or on to a copper plate (faster cooling for less polymerized compositions). Glasses in the pyroxene series (including “cosmic” compositions) vary in their quenchability; diopside (CaMgSi2O6) is an excellent glass-former, while enstatite (MgSiO3) crystallizes extremely rapidly.
Glass of forsterite (Fo, Mg2SiO4) or olivine (Mg2xFe2-2xSiO4) can only be formed in the laboratory under special conditions. Specifically, Fo glass in the form of 50 to 200 m diameter beads was first produced by Tangeman et al. (2001) at Containerless Research by suspending small particles in argon gas and melting/quenching by pulsing with a laser. In addition to providing rapid cooling of 700 K/sec, the lack of container promotes crystal-free glass formation. Commercially prepared samples of Fo were purchased from Containerless Research, Inc. Iron-bearing olivine samples were not available. We were able to prepare “basalt glass” at Washington U. by flash melting rock on a glassy carbon substrate in a vacuum chamber with a CO2 laser followed by rapid cooling. When applied to iron-bearing olivine or fayalite (Fe2SiO4) crystals this approach failed to produce glass.
2.3 Chemical Analyses for Sample Composition Determination
Samples were characterized by wavelength dispersive analysis (WDS) using standard procedures on the JEOL-733 and JXA-8200 electron microprobes at Washington University using “Probe for Windows” for data reduction (see http://www.probesoftware.com/). The measured data were corrected using CITZAF after Armstrong (1995). Oxide and silicate standards were used for calibration (e.g., Amelia albite for Na, Si; microcline for K; Gates wollastonite for Ca; Alaska Anorthite for Al; synthetic fayalite for Fe; synthetic forsterite for Mg; synthetic TiO2 for Ti; synthetic Mn-olivine for Mn; synthetic Cr2O3 for Cr). Microprobe analyses are given in Table 3, and the resulting compositions are given as chemical formulae in Table 2. Table 3 also lists water contents, which we determined from near-IR spectra using the method in Hofmeister et al. (2009).
2.4 Viscosimetric Determination of Glass Transition Temperature
As discussed in § 1.3, the glass transition temperature () is essentially the temperature above which a given composition should form as or convert to crystalline solids, while solids formed below this temperature should be glassy. We determine values as a proxy for for our silicate samples to provide an upper limit on temperature for models of glass formation in space. depends on composition and cooling rate. Viscosity was measured over a range of temperatures using a Theta Instruments Rheotronic III parallel plate viscometer, following procedures described by Whittington et al. (2009). Viscosity is calculated from the measured longitudinal strain rate, known load and calculated instantaneous surface area, assuming perfect slip between sample and plates. The measurements are interpolated to find with an uncertainty of less than 2 K.
2.5 Spectroscopy
Room temperature (18–19∘C) IR absorption spectra were acquired using an evacuated Bomem DA 3.02 Fourier transform spectrometer (FTIR) at 1 cm-1 resolution The accuracy of the instrument is 0.01 cm-1. Far-IR data () were collected for five samples using a SiC globar source, a liquid helium cooled bolometer, and a coated mylar beam-splitter. Mid-IR data ( 450–4000 cm-1) were collected for all samples using a SiC globar source, a liquid nitrogen cooled HgCdTe detector, and a KBr beam-splitter. The spectra were collected from powdered samples pressed in a diamond anvil cell (DAC). The empty DAC was used as the reference spectrum which allows reflections to be removed. The methodology is described by Hofmeister, Keppel & Speck (2003).
Interference fringes exist in many of our spectra because the diamond faces are parallel and are separated by a distance within the wavelength range studied. The spacing is larger than film thickness. Fringes are associated with a sideburst in the interferogram. Due to mathematical properties of Fourier transforms, the fringes are convolved with the spectrum and therefore do not affect peak shape or the parameters used to describe the peak (position, width and height).
3 Comparison of new laboratory spectra with previous laboratory and synthetic spectra
3.1 New laboratory spectra
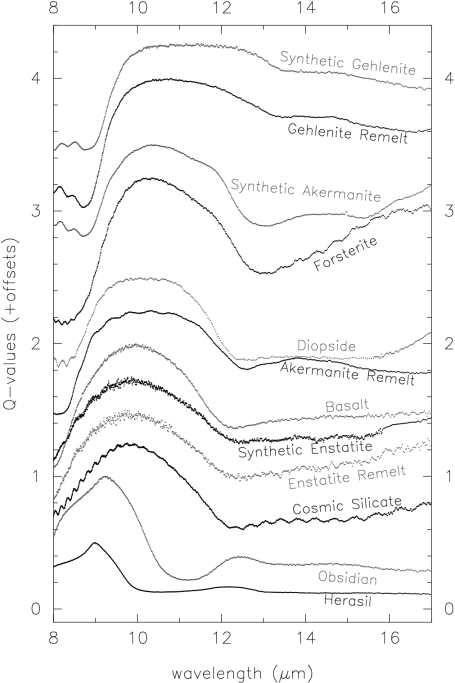
The new laboratory spectra, shown in Figure 4, are the highest resolution spectra of silicate glasses to date. These data are available online from http://galena.wustl.edu/dustspec/idals.html The main observable parameters of astronomical spectra are the peak position of the absorption/emission features at m and m; their FWHMa and the ratio of their strengths (see e.g., OHM and references therein). For instance, the ratio of band strengths between the 10 and 18 m features in observations varies markedly, as do the peak positions. Therefore we have extracted the most important spectral parameters from our data using the NOAO onedspec package within the Image Reduction and Analysis Facility (IRAF). The spectral parameters (the peak position, barycentric position, full width half maximum, FWHM, and equivalent width) were determined for the and m features. Figure 4 shows the barycentric position of the m feature for all samples, while Figure 5 shows the barycentric positions of both the and m features for the five compositions for which far-IR data were collected. The barycentric positions, along with the peak positions and FWHMa from absorbance measurements are listed in Table 4.
There are multiple terms and symbols for the various ways in which absorption of light by solids is described. In order to prevent confusion, we will explain precisely how each term we use is defined. This is particularly important for applying laboratory spectra to astrophysical studies because our spectra are initially in the form of absorbance (), but we typically use either absorption efficiency (Q-values), optical depth or extinction in astronomy.
Transmittance, (which is also referred to as transmissivity in Fox, 2002) is defined as the ratio of the intensity of transmitted () and incident () light, i.e. . Similarly reflectivity, and absorptivity, are the ratios of absorbed to incident light and reflected to incident light, respectively444note that absorbance is the reciprocal of the log of the transmittance, in contrast to the absorptivity defined here; see also Speck, Thompson & Hofmeister (2005).
For simplicity we will assume the reflectivity is negligible or has been accounted for (see Hofmeister et al., 2009, for how we can account for reflections) . Then,
| (1) |
When light passes through a solid the absorption can be expressed as:
| (2) |
where is pathlength or thickness of the solid sample and is usually called the absorption coefficient, but is sometimes called opacity. In addition , where is the mass absorption coefficient, and is the mass density.
| (3) |
Absorbance, , is the exponent in the decay of light due to absorption: . Optical depth of an absorbing material is defined by:
| (4) |
(From, e.g. Glass, 1999).
From equations 2, 3 and 4 we see that the absorbance is similar to optical depth . In order to compare astronomical data in which we have a wavelength-dependent optical depth we can use absorbance (which is how we present our transmission spectra in Fig. 4 and Fig. 5 after accounting for surface reflections.) Now we can relate the absorbance () and absorptivity () via equation 3:
To compare with some astronomical observations we still need to extract a version of the laboratory data that is comparable to the absorption efficiency, -values. To get this we need to consider how -values are defined. For a non-blackbody dust grain we define an absorption cross-section as the effective geometrical cross-section of the particle once we account for it not being a blackbody:
where is the geometrical cross-sectional area of a dust grain. Now if we consider how the absorption cross section gives rise to absorption we get:
| (5) |
where is the number density of absorbing particles and is the pathlength or thickness of the absorbing zone.
| (6) |
where is the molar mass of the solid and is the mass of a hydrogen atom. Combining equations 5 and 6 we get:
| (7) |
It is clear from equation 7 that Q-values absorptivity such that:
where,
Consequently, while the shape, peak position and FWHM of spectral features shown in -values will be identical to those for , the absolute values depend on the pathlength and on the cross-section areas of a given grain distribution. The uncertainty in the thickness of our samples and in potential grain size makes the absolute -values uncertain. Consequently we normalize our -value spectra to peak at unity. These Q-value spectra are stacked in Fig 6 to demonstrate the shift in both barycentric position and FWHM with composition. Table 4 also includes the FWHM in Q-value.
3.2 How to compare disparate data sets
Here we compare the new laboratory spectra with those previously published to distinguish which factors are most important in determining spectral feature parameters. Previously published data are available as complex refractive indices ( and ). To make a fair comparison between the many available datasets we converted our absorbance data to the wavelength-dependent imaginary part of the complex refractive index () for each sample. This absorption index is chosen as the best comparison of different datasets, as it does not depend on grain sizes or shapes and can be extracted equally well from transmission or reflectance data (see e.g., Hofmeister et al., 2009; Fox, 2002). Comparing absorption efficiency requires assumptions about grain shape, which have been shown to affect the shapes and positions of spectral features (e.g. Min et al., 2003; DePew et al., 2006). The conversion of the absorbance spectrum to -values uses:
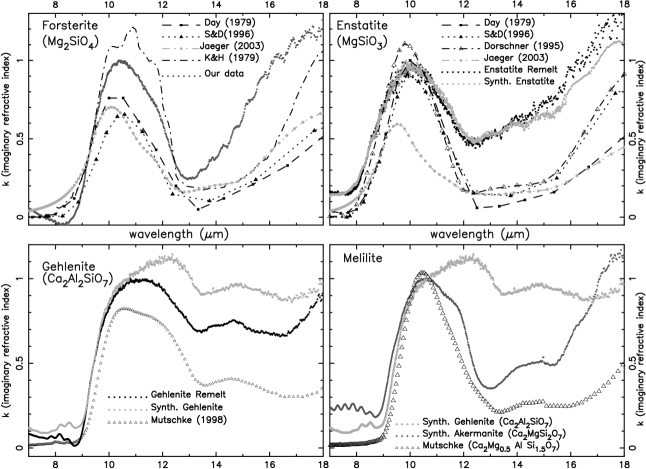
where is the absorbance, is the sample thickness (in cm) and is the frequency (wavenumber) in cm-1. There is some uncertainty in the measurement of the sample thickness which is estimated to be 0.5 – 1.5 m thick (Hofmeister & Bowey, 2005). Consequently, for comparison our data has been normalized to peak at a -value of 1. In Figure 7 we compare spectra of forsterite, enstatite, gehlenite and åkermanite composition “amorphous” silicates.
3.3 Comparison of new glass spectra with existing laboratory data.
Various synthesis techniques are associated with samples studied in the laboratory, as described in § 1.2 and listed in Table 1. Considering, for example, forsterite composition samples shown in the upper left panel of Figure 7, it is clear that the spectral parameters vary even for ostensibly the same composition. The ion irradiation technique used by Krätschmer & Huffman (1979) apparently does not produce a fully amorphized sample, as this spectrum is closer to that of crystalline forsterite, which was their starting material. The sample from Day (1979) was produced via chemical vapor deposition; the Scott & Duley (1996) sample was produced by laser ablation of crystalline samples; and the sol-gel method was used by Jäger et al. (2003).
The spectra of three different samples produced by chemical vapor deposition, laser ablation and sol-gel techniques are similar. However, although these samples may be “amorphous” they are not necessarily glassy. The samples generated by these three techniques may represent chaotic silicates rather than the glassy silicates investigated herein. The difference between previous samples and those presented here is most likely a combination of density and porosity. Glasses should be less porous and denser than chaotic silicates.
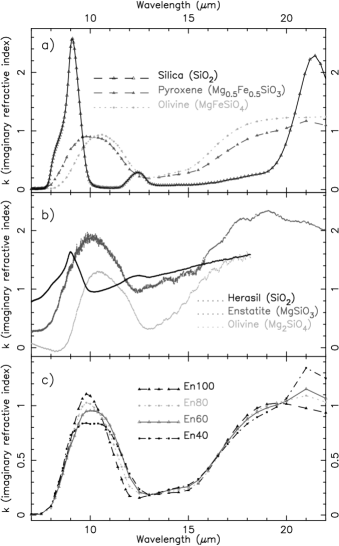
Among the enstatite composition samples, those from Day (1979) and Scott & Duley (1996) are, again, similar to each other. Samples produced by melting and quenching (e.g. ours, Dorschner et al., 1995) show some variability in the spectral features. However, the peak positions and FWHMa are similar (see Tables 1 and 2). The difference in breadth may result from different cooling rates and fictive temperatures. Jäger et al. (2003) investigated amorphous MgO-SiO2 solids prepared using the sol-gel method. The spectra vary markedly with changes in SiO2 content, and hence with polymerization (Fig. 8). However, these samples also contained a reported 0.8 to 1.2 wt.% H2O, which equates to 3 mol.% H2O, all dissolved as network-modifying hydroxyl (OH-) ions (see § 1.3). Glasses quenched from melts at atmospheric pressure (e.g. those presented here and in Dorschner et al., 1995) contain much less water, typically 0.02–0.1wt.%. In previous laboratory studies it has been suggested that the changes in peak positions are due to differing silica contents, and hence polymerization states (NBO/T), i.e. forsterite has a redder peak position than enstatite, which in turn is redder than silica (see e.g., OHM, 1992, and reference therein). This is demonstrated in Fig. 8. Thus, even the modest levels of water remaining in samples prepared using the sol-gel method will affect the structure of the silicate and thus its spectrum. This makes precise interpretation of spectra from sol-gel samples difficult, especially of the more silica-rich compositions whose structure will be the most affected by the incorporation water. Therefore the sample/material structure is not well known. Spectral differences between the sol-gel MgSiO3 of Jäger et al. (2003) and the quenched MgSiO3 glass of Dorschner et al. (1995) emphasize the point, especially around the 10m feature (Fig. 7).
The bottom left panel of Fig. 7 compares spectra for the gehlenite, the Al-rich endmember of the melilite series. All data were produced by the melt-quench method. Gehlenite from this study closely matches spectra of the Mutschke et al. (1998) sample, while the sample we generated by melting a natural crystal of gehlenite (designated gehlenite remelt) shows significant differences which can be attributed to the deviation from stoichiometry which results in large shifts in both Al/(AlSi) and NBO/T (see Table 2). The bottom right panel compares the mid-composition melilite (Åk50Ge50) from Mutschke et al. (1998) with our end-member synthetic melilites. The peak position of the Mutschke et al. (1998) melilite is similar to our Al-rich endmember, while the feature shape is closer to that of our Mg-rich endmember.
Mutschke et al. (1998) discussed the low contrast feature in the 12–16 m range in various aluminous silicates. This feature moves from m in gehlenite towards shorter wavelengths, with the åkermanite feature peaking closer to 13.5 m (Fig. 7). Mutschke et al. (1998) did not investigate the åkermanite-rich melilites because their focus was on the effect of aluminium, but their findings, and those seen here may pertain to the carrier of the observed “ m” feature (e.g. Sloan et al., 2003, and references therein).
Figure 9 shows a comparison between our “cosmic silicate”, “basalt” and the “dirty silicate” produced by Jäger et al. (1994). The 10 m features are very similar in peak position and FWHM, but the ratio of the 10 and m features vary. This comparison shows that samples containing several elements give rise to very similar 10 m spectral features even though they differ in Fe/(Mg+Fe), oxidation state, NBO/T and other compositional parameters.
In single crystal silicates, the Mg/Fe ratio affects the spectral features (e.g., Koike et al., 2003; Hofmeister & Pitman, 2007). Dorschner et al. (1995) investigated the effect of Mg/Fe ratio on the spectra of (Mg,Fe)SiO3 glasses produced by quenching melts in air. The peak positions shift slightly, and the ratio of the 10 m and 18 m feature heights varies markedly (Fig. 8). Substitution of Ca for Mg produces substantial broadening of the 10 m feature, consequently the peak (and barycenter) shift redward. The viscosity and glass transition data in Table 2 show that small impurities can have important effects on melt properties (and structure). For example, compare synthetic and remelted åkermanite and gehlenites. This is why it is important to consider Ca in pyroxenes, in addition to the En-Fs series. Indeed based on the spectra presented here, the effect of calcium substitution is larger than that of iron.
Dorschner et al. (1995) reported that the FeO/Fe2O3 ratios of their samples were 1. Whether molar or weight ratio (unspecified in their paper), these samples do not have pyroxene stoichiometry, and thus have a structure differing from that of our pyroxene glasses. Using their reported compositions, and assuming all Fe3+ acts as a network former, calculated NBO/T values ranges from 2.1 for En95 to 0.8 for En50 and En40 glasses, considerably lower than the value of 2.0 for a true (Mg,Fe)SiO3 composition. Furthermore, the effect of tetrahedral Fe3+ on neighboring Si–O bonds, which give rise to the 10 m feature, may be sufficient to produce marked changes in the shape and peak position of the feature even if Mg-Fe substitution does not. Therefore existing lab data on glasses do not allow astronomical spectra to be interpreted reliably in terms of either M2+/Si or Mg/Fe ratio, which are important tools for discriminating between competing dust formation models. We will address the roles of oxidation state and Al-content in silicates in future papers.
3.4 Comparison with Synthetic Spectra
As discussed in § 1.2 the most popular silicate spectral data used in astronomy are the synthetic optical functions (complex refractive indices/complex dielectric functions) from DL and OHM. In the spectral regions considered here, both groups derived dielectric functions from astronomical observations. DL used observations of the ISM while OHM produced two sets of optical constants designated as warm O-deficient and cold O-rich. The warm O-deficient is intended to match circumstellar dust features where the Nuth & Hecht (1990) predicted that non-stoichiometric silicates form in the outflows. The cold O-rich silicate is meant to represent dust formed in molecular clouds, where the cool temperatures and slow dust formation lead to stoichiometric compositions. For the circumstellar (O-deficient warm), opacities are derived by Volk & Kwok (1988) based on averaging approximately 500 IRAS LRS spectra of evolved stars. However, this approach is less than ideal. It is well known that the observed “silicate” features vary markedly from source to source (see e.g. Nuth & Hecht, 1990; Mutschke et al., 1998; Speck et al., 2000) and thus averaging can smear out such differences and give rise to an opacity that is close to matching many objects and actually matches none.
To provide a fair comparison, parameters for these synthetic silicate spectra have been included in Table 1. Whereas the DL spectra provide a reasonable match to the features observed in the ISM, the spectra from OHM provides a narrower m feature which matches the circumstellar silicate features more closely (e.g. Sargent et al., 2010, and references therein). However, neither DL nor OHM provide perfect matches to the observed astronomical mid-IR features; nor do they reflect the diversity of features seen in astronomical environments. Although synthetic spectra do not match astronomical data perfectly, they are widely used and come close to matching many astronomical observations. Consequently, comparing our new laboratory data to these synthetic spectra allows us to assess whether any true glasses show promise as carriers of observed silicate features.
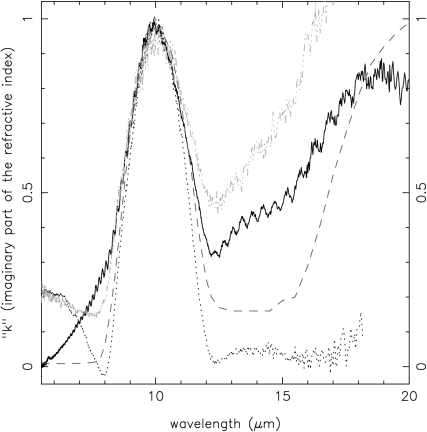
Figures 10 to 14 show how the spectral properties of the new laboratory samples compare to those of synthetic silicates from DL and OHM. In all cases the comparison is made with the absorption index , which is the imaginary part of the complex refractive index, and was chosen to avoid complications arising from grain shape and grain effects (see § 3.2). None of the samples presented here precisely match the spectral features of the synthetic silicates. In particular, the 10m feature in the spectra from DL is too broad to be matched by any of the laboratory samples, with the possible exception of gehlenite (both “synthetic” and “remelt”; see Fig. 11, bottom row). However, the relative cosmic abundances calcium and aluminium make this an unlikely attribution for the ISM dust. It is usually assumed that astronomical silicates are largely comprised of “amorphous” Mg-rich olivine and pyroxene compositions. Therefore, we compare the interstellar feature as represented by DL with such compositions in Fig. 12– 13. The spectra of the four Mg-rich pyroxene-like glasses (Synthetic Enstatite, Enstatite Remelt, Cosmic Silicate and Basalt) have grossly similar spectra. In all four cases, the laboratory data match the blue side of the DL feature, but are too narrow and fail to match the red side. This is also true for the broader diopside feature (Fig. 12). While forsterite composition glass has a redder feature than the pyroxenes, it is still too narrow and still not red enough to match the DL 10m feature.
If glasses do produce the astronomical 10m band, the excess breadth needs accounting for and may suggest processing of dust in the ISM (Nuth & Hecht, 1990). The physical changes to the dust that give rise to the broader interstellar feature remain unknown, but there are numerous interpretations. In circumstellar environments the red-side broadening of the 10 m feature has been interpreted as being due to oxide inclusions (e.g., Speck et al., 2000); increasing crystallinity (e.g., Sylvester et al., 1998; Bouwman et al., 2001); changes in grain shape (e.g., Min et al., 2007); or grain porosity (e.g., Henning & Stognienko, 1993; Voshchinnikov & Henning, 2008). The silicate feature is fairly constant and broad for the diffuse ISM, but varies more and is narrower for molecular clouds (see e.g. van Breeman et al., 2011, and references therein). These variations have been attributed to a combination of grain agglomeration and ice mantle formation (see Chiar & Tielens, 2006; Chiar et al., 2007; McClure, 2009; van Breeman et al., 2011), but the results of those studies depend on the optical properties input into their models.
The spectra of OHM have been used somewhat successfully in modeling circumstellar silicate features (e.g. Sargent et al., 2010, and references therein). Of the new laboratory glasses, only forsterite comes close to matching the OHM synthetic spectra (Fig. 14), but there is still a problem with the breadth and redness of the feature. Most other compositions have 10m features that are too blue. However, 10 m silicate emission features seen in AGB stars spectra and observed by ISO and IRAS are consistently slightly bluer than those in the synthetic spectra (Wheeler & Speck, 2007; Wheeler et al, 2011). Consequently our samples may provide better matches than the OHM synthetic spectra.
4 Discussion
4.1 Amorphousness at different scales: Glasses vs. Nanocrystalline solids
We have shown that differences exist between spectra of amorphous samples of ostensibly the same composition due to structural differences arising from synthesis methods. In this section we discuss the range of structures that may be considered amorphous, and other factors such as composite or polycrystalline grains that may produce different spectral features to those obtained from studies of single crystals. The range of structures is shown schematically in Fig. 1.
Disordered (but not glassy) silicates may form at temperatures above by ion bombardment of initially crystalline materials. Depending on the extent of damage done by ion radiation, an initially crystalline sample may be amorphized and could be indistinguishable spectroscopically from a truly glassy sample (see e.g. Demyk et al., 2004). As discussed in § 1.2, limited heavy ion irradiation may not completely amorphize a crystalline sample (e.g. Krätschmer & Huffman, 1979). Consequently ion-irradiation of initially crystalline material should lead to a continuum of structures ranging from perfect crystals to completely disordered, with the accompanying range of spectral features. Furthermore Demyk et al. (2004) showed that ion irradiation leads to more porous samples than simple splat-quenched glasses. While lower densities should not directly affect the spectra, voids give rise to extra reflections which increases extinction and feature widths through increased scattering even though absorption is unchanged. The structures of ion-irradiated crystals may be more similar to smokes than glasses because of ion damage (see Fig. 1).
Another potential carrier of the observed silicate spectral features is polycrystalline silicate. Spectra of single composition (monomineralic) polycrystals will be affected by multiple scattering which should broaden and smear out the features as demonstrated for hematite in Marra et al. (2011). During annealing and crystallization of an initially glassy grain the final structure would depend strongly on composition. For a glass of pure enstatite composition, one may expect either a single crystal of enstatite or a mono-mineralic polycrystalline agglommeration (if crystallization starts at more than one point in the grain.) However, since glassy grains are expected to form to include all the atoms in the outflowing gas, fractional crystallization is possible. For instance, our “cosmic” silicate has a bulk composition close to enstatite, but contains a significant amount of other elements. Consequently we might expect an annealed sample of this composition to be poly-mineralic polycrystals with a large abundance of enstatite crystals. Depending on the spectral contributions from other constituents of the polymineralic grain, we may not perceive sharp crystalline features in the spectrum. This is beyond the scope of the present work but will be investigated in the future.
Given that there are multiple mechanisms for the formation of both amorphous and crystalline silicate grains, and that processing can lead from one to the other and vice versa, it is possible that many types of grains represented on Fig. 1 are found in space.
4.2 Potential application to astronomy
AGB stars present an interesting environment in which to study dust formation because they are relatively benign and the stability of CO molecules simplifies the chemistry. Whereas many AGB stars exhibit the m feature, this feature varies in peak position and shape from object to object, and even temporally within a single object (Speck et al., 2000; Sloan et al., 2003; Monnier et al., 1998). Speck et al. (2000) showed that several Galactic objects show silicate features peaking as short as 9.2 m, while Speck et al. (2008) found a very red 10 m absorption feature in the spectrum of an obscured AGB star. While the synthetic spectra are commonly used to model the observed features, they rarely match the details of peak position and width. The new laboratory data presented here provide a framework to interpret the observed variations in AGB star spectral features. For example, the red feature seen by Speck et al. (2008) can be best matched by something forsteritic, while the observed 9.2m feature needs very silica-rich dust.
Recent studies by Chiar & Tielens (2006); Chiar et al. (2007), McClure (2009) and van Breeman et al. (2011) have shown that the shape and peak position of the classic 10 m interstellar silicate absorption feature varies depending on the line of sight. Whereas the m feature remains the same for all diffuse lines of sight, its shape and position varies once the line of sight includes a molecular cloud. This has been attributed to a combination of grain agglomeration and ice mantle formation within the molecular clouds (op. Cit.). The diffuse ISM is well characterized by DL but for molecular clouds this 10 m feature is too broad (van Breeman et al., 2011). The competing hypotheses explaining the molecular cloud spectra could be tested by comparing with the glass spectra presented herein.
The importance of dust to astrophysical processes cannot be over stated. For example, observations of high redshift () galaxies and quasars demonstrate that there was copious dust produced by the time the Universe was 700 million years old (e.g., Sugerman et al., 2006; Dwek et al., 2007). Furthermore, in Active Galactic Nuclei (AGN), the observed silicate absorption feature is shifted to peak at a longer wavelength, and is broader than that observed in our own Galaxy. This spectral shift has been attributed to calcium-aluminum rich silicates (Jaffe et al., 2004) or porous particles (Li et al., 2008). Moreover, data from Spitzer (SAGE-IRS Legacy program) show a number of both AGB and YSO sources with remarkably blue silicate features. Given that Mg, Fe and Si are formed in different nucleosynthetic processes, the abundance ratios of these elements do not necessarily scale with metallicity. Disentangling dust formation mechanisms through observations of dust requires the optical properties of a range of silicate samples of varying Mg- Fe- and Si- contents and other components as provided here. The work presented here is a subset of a larger study and further sample compositions and structures will be presented in the near future.
5 Conclusions
We have presented new laboratory spectra of astrophysically relevant silicate glasses and compared them to existing data in the literature. We have shown that (1) “disordered” is not synonymous with glassy. In addition to structural disorder, porosity also affects spectral features. (2) Sample preparation and characterization are important. (3) We confirm the general trend of decreasing peak wavelength with increasing polymerization for the 10 m feature. However the scatter about this overall trend indicate that other compositional factors must be important. (4) Nothing quite matches the diffuse ISM in peak position and breadth.
Spectral parameters of disordered silicates are sensitive to composition and sample synthesis techniques, which reflect degree of disorder, porosity, oxidation states and water content. To understand dust formation we must disentangle these parameters through further systematic study of major compositional series using high resolution spectroscopy on thoroughly characterized samples. Further studies of the parameters will follow. These new data can be used for interpretation of more esoteric environments e.g. high redshift galaxies and novae.
References
- Armstrong (1995) Armstrong, J.T. 1995, Microbeam Anal, 4, 177.
- Bouwman et al. (2001) Bouwman, J., Meeus, G., de Koter, A., Hony, S., Dominik, C., Waters, L. B. F. M. 2001, A&A, 375, 950.
- Casassus et al. (2001) Casassus, S., Roche, P. F., Aitken, D. K., Smith, C. H. 2001, MNRAS, 320, 424.
- Chiar & Tielens (2006) Chiar, J. E., Tielens, A. G. G. M. 2006, ApJ, 637, 774.
- Chiar et al. (2007) Chiar, J. E., Ennico, K., Pendleton, Y. J., et al. 2007, ApJ, 666, L73.
- Chihara et al. (2007) Chihara, H., Koike, C., Tsuchiyama, A. 2007, A&A, 464, 229.
- Day (1979) Day, K.L. 1979, ApJ, 234, 158.
- Demyk et al. (2000) Demyk, K., Dartois, E., Wiesemeyer, H., et al. 2000, A&A, 364, 170.
- Demyk et al. (2004) Demyk, K., d’Hendecourt, L., Leroux, H., Jones, A. P., Borg, J. 2004, A&A, 420, 233.
- DePew et al. (2006) DePew, K., Speck, A., Dijkstra, C., 2006, ApJ, 640, 971.
- Dingwell et al. (1996) Dingwell, D.B., Romano, C., Hess, K.-U., 1996, Contributions to Mineralogy and Petrology, 124, 19.
- Dorschner et al. (1995) Dorschner, J., Begemann, B., Henning, T., Jaeger, C., Mutschke, H. 1995, A&A, 300, 503.
- Draine (2003) Draine, B.T., 2003, ARA&A, 41, 241
- DL (1984) Draine, B. T., Lee, H. M. 1984, ApJ, 285, 89.
- Dwek et al. (2007) Dwek, Eli, Galliano, Fr d ric, Jones, Anthony P. 2007, ApJ, 662, 927.
- Fox (2002) Fox, M. 2002 “Optical Properties of Solids” Oxford University Press.
- Gail & Sedlmayr (1999) Gail, H.-P., Sedlmayr, E. 1999, A&A, 347, 594
- Gaustad (1963) Gaustad, John E. 1963, ApJ, 138, 1050.
- Getson & Whittington (2007) Getson, J.M., Whittington, A.G. 2007Journal of Geophysical Research, 112, B10203,
- Gillett et al. (1968) Gillett, F. C., Low, F. J., Stein, W. A. 1968, ApJ, 154, 677.
- Gilman (1969) Gilman, R.C. 1969, ApJ, 155, L185.
- Glass (1999) Glass, I.S., 1999, “Handbook of Infrared Astronomy” Cambdridge University Press
- Grossman (1972) Grossman, Lawrence 1972, Geochim. Cosmchim. Acta, 36, 597.
- Hackwell et al. (1970) Hackwell, J. A., Gehrz, R. D., Woolf, N. J. 1970, Nature, 227, 822.
- Hao et al. (2005) Hao, Lei, Spoon, H. W. W., Sloan, G. C., et al. 2005, ApJ, 625, L75.
- Henderson (2005) Henderson, G.S., 2005, The Canadian Mineralogist, 43, 1921.
- Henning & Stognienko (1993) Henning, Th., Stognienko, R. 1993 A&A, 280, 609.
- Hofmeister et al. (2009) Hofmeister, A. M., Pitman, K. M., Goncharov, A. F., Speck, A. K. 2009, ApJ, 696, 1502.
- Hofmeister & Pitman (2007) Hofmeister, A. M., Pitman, K. M. 2007, Phys. Chem. Min, 34, 319.
- Hofmeister & Bowey (2005) Hofmeister, A, M., Bowey, J. E., 2006 MNRAS, 367, 577. Monthly Notices of the Royal Astronomical Society, Volume 367, Issue 2, pp. 577-5
- Hofmeister, Keppel & Speck (2003) Hofmeister, A.M., Keppel, E., Speck, A.K., 2003, MNRAS, 345, 16.
- Hony et al. (2009) Hony, S., Heras, A. M., Molster, F. J., Smolders, K. 2009, A&A, 501, 609.
- Huffman & Stapp (1973) Huffman, D. R., Stapp, J. L. 1973, in Interstellar Dust and Related Topics. IAU Symp. 52, (Eds) J. Mayo Greenberg and H. C. van de Hulst. Dordrecht, Boston, Reidel, p.297
- Jaffe et al. (2004) Jaffe, W., Meisenheimer, K., R ttgering, H. J. A., et al. 2004, Nature, 429, 47.
- Jäger et al. (1994) Jäger, C., Mutschke, H., Begemann, B., Dorschner, J., Henning, Th. 1994, A&A, 292, 641.
- Jäger et al. (2003) Jäger, C., Dorschner, J., Mutschke, H., Posch, Th., Henning, Th. 2003, A&A, 408, 193.
- Jones & Merrill (1976) Jones, T. W., Merrill, K. M. 1976, ApJ, 209, 509.
- Kemper et al. (2002) Kemper, F., de Koter, A.,Waters, L. B. F. M., Bouwman, J., & Tielens, A. G. G. M. 2002, A&A, 384, 585.
- Knacke et al. (1969) Knacke, R. F., Gaustad, J. E., Gillett, F. C., Stein, W. A. 1969, ApJ, 155, L189.
- Koike et al. (2003) Koike, C., Chihara, H., Tsuchiyama, A., Suto, H., Sogawa, H., Okuda, H. 2003, A&A, 399, 1101.
- Krätschmer & Huffman (1979) Krätschmer, W., Huffman, D. R. 1979, Ap&SS, 61, 195.
- Krishna-Swamy (2005) Krishna Swarmy, K. S., 2005 “Dust in the Universe: Similarities And Differences”, World Scientific Series in Astronomy and Astrophysics, Vol. 7. Singapore: World Scientific Publishing, ISBN 981-256-293-1, 2005, XI + 252 pp.
- Krugel (2008) Krugel, E. 2008, “An Introduction to the Physics of Interstellar Dust” Taylor & Francis Group, LLC, New York, p387.
- Li (2007) Li, A. in The Central Engine of Active Galactic Nuclei, ASP Conference Series, Vol. 373, 2007, (Eds) Luis C. Ho and Jian-Min Wang, p.561.
- Li et al. (2008) Li, M. P., Shi, Q. J., Li, Aigen 2008, MNRAS, 391, L49.
- Li & Li (2009) Li, M. P., Li, Aigen American Astronomical Society, AAS Meeting #214, #402.20
- Lodders & Fegley (1999) Lodders, K., Fegley, B., Jr. 1999, in IAU Symp. 191, Asymptotic Giant Branch Stars, ed. T. Le Bertre, A. Lebre, C. Waelkens (New York: Springer), 279
- Mann et al. (2006) Mann, Ingrid, Köhler, Melanie, Kimura, Hiroshi, Cechowski, Andrzej, Minato, Tetsunori, 2006, A&ARev, 13, 159.
- Marra et al. (2011) Marra, A.C., Lane, M.D., Orofino, C., Blanco, A., Fonti, S., 2011, Icarus, 211, 839.
- McClure (2009) McClure, M. 2009, ApJ, 693, L81.
- Min et al. (2003) Min, M., Hovenier, J. W., de Koter, A., 2003, A&A, 404, 35.
- Min et al. (2007) Min, M., Waters, L. B. F. M., de Koter, A., et al. 2007, A&A, 462, 667
- Monnier et al. (1998) Monnier, J. D., Geballe, T. R., Danchi, W. C. 1998, ApJ, 502, 833.
- Mutschke et al. (1998) Mutschke, H., Begemann, B., Dorschner, J., et al. 1998, A&A, 333, 188.
- Mysen & Richet (2005) Mysen, B.O., Richet, P. Silicate Glasses and Melts: Properties and Structure. Developments in Geochemistry 10, Elsevier, 544 pp.
- Nuth & Donn (1982) Nuth, J. A., III, Donn, B. 1982, ApJ, 257, L103
- Nuth & Hecht (1990) Nuth, J. A., III, Hecht, J. H., 1990, Ap&SS, 163, 79.
- Onaka & Okada (2003) Onaka, T. Okada, Y., 2003, ApJ, 585, 872.
- OHM (1992) Ossenkopf, V., Henning, Th., & Mathis, J. S. 1992, A&A, 261, 567.
- Papoular & Pégourié (1983) Papoular, R., Pégourié, B. 1983, A&A, 128, 335.
- Perets et al. (2010) Perets, H.B., Gal-Yam, A., and Mazali, P.A., et al. 2010, Nature, 465, 322.
- Pollack et al. (1973) Pollack, J. B., Toon, O. B., Khare, B. N. 1973, Icarus, 19, 372.
- Richet et al. (1993) Richet, P., Leclerc, F., Benoist, L. 1993, Geophys. Res. Lett., 20, 1675.
- Sargent et al. (2010) Sargent, B., Srinivasan, S., Meixner, M., et al., 2010, ApJ, 716, 878.
- Sargent et al (2006) Sargent, B., Forrest, W. J., D’Alessio, P, et al., 2006, ApJ, 645, 395.
- Scott & Duley (1996) Scott, A., Duley, W. W. 1996, ApJS, 105, 401.
- Schairer & Bowen (1956) Schairer, J.F., Bowen, N.L. 1956, American Journal of Science, 254, 129.
- Sloan et al. (2003) Sloan, G. C., Kraemer, Kathleen E., Goebel, J. H., Price, S. D., 2003, ApJ, 594, 483.
- Speck (1998) Speck, A. K. 1998, PhD Thesis.
- Speck et al. (2000) Speck, A. K., Barlow, M. J., Sylvester, R. J., Hofmeister, A. M. 2000, A&AS, 146, 437.
- Speck & Hofmeister (2004) Speck, A.K., Hofmeister, A.M., 2004, ApJ, 600, 986.
- Speck, Thompson & Hofmeister (2005) Speck, A.K., Thompson, G.D., Hofmeister, A.M., 2005, ApJ, 634, 426.
- Speck et al. (2008) Speck, Angela K., Whittington, Alan G., Tartar, Josh B. 2008, ApJ, 687, L91.
- Speck et al. (2009) Speck, Angela K., Corman, Adrian B., Wakeman, Kristina, Wheeler, Caleb H., Thompson, Grant 2009, ApJ, 691, 1202.
- Stencel et al. (1990) Stencel, Robert E., Nuth, Joseph A., III, Little-Marenin, Irene R., Little, Stephen J. 1990, ApJ, 350, L45
- Stolper (1982) Stolper, E. 1982, Geochim. Cosmochim. Acta, 46, 2609.
- Stroud et al. (2008) Stroud, R. M., Nguyen, A. N., Alexander, C. M. O’d., Nittler, L. R., Stadermann, F. J. 2008, Meteoritics & Planet. Sci, Abst. 43, 5201.
- Sugerman et al. (2006) Sugerman, Ben E. K., Ercolano, Barbara, Barlow, M. J., et al. 2006, Science, 313, 196.
- Sylvester et al. (1998) Sylvester, R. J., Kemper, F., Barlow, M. J., et al. 1999, A&A, 352, 587.
- Tangeman et al. (2001) Tangeman, J.A., Phillips, B.L., Navrotsky, A., Weber, J.K.R., Hixson, A.D., Key, T.S. 2001a, Geophys. Res. Letters, 28, 2517.
- Tielens (1990) Tielens, A. G. G. M. 1990, in From Miras to Planetary Nebulae: Which Path for Stellar Evolution?, ed. M. O. Mennessier A. Omont (Gif-sur-Yvette: Editions Frontieres), 186
- Toppani et al. (2006) Toppani, A., Libourel, G., Robert, F., Ghanbaja, J. 2006, Geochim. Cosmochim. Acta, 70, 5035.
- van Breeman et al. (2011) van Breemen, J. M.; Min, M.; Chiar, J. E.; et al. 2011, A&A, in press.
- Videen & Kocifaj (2002) Videen, G., Kocifaj, M., 2002 Optics of Cosmic Dust: proceedings of a NATO Advanced Research Workshop NATO Science Series. Dordrecht/Boston/London: Kluwer Academic Publishers, 2002.
- Volk & Kwok (1988) Volk, K., Kwok, S., 1988, ApJ, 331, 435.
- Vollmer et al. (2007) Vollmer, C., Stadermann, F. J., Bose, M., Floss, C., Hoppe, P., Brenker, F. E. 2007 Meteoritics & Planet. Sci, Abst. 42, 5107.
- Voshchinnikov & Henning (2008) Voshchinnikov, N. V., Henning, T. 2008, A&A, 483, L9.
- Watkins et al. (2009) Watkins, J., Manga, M., Huber, C., Martin, M. 2009. Contributions to Mineralogy and Petrology, in press, DOI 10.1007/s00410-008-0327-8
- Wheeler & Speck (2007) Wheeler, Caleb, Speck, A. K. 2007, BAAS, 39, 890.
- Wheeler et al (2011) Wheeler, Caleb, Speck, A. K. 2011, in prep.
- Whittet (1992) Whittet, D. C. B., 1992, “Dust In The Galactic Environment”, IoP Publishing.
- Whittington et al. (2009) Whittington AG, Hellwig BM, Behrens H, Joachim B, Stechern A, and Vetere F, 2009, Bulletin of Volcanology, 71, 185.
- Wilding et al. (1995) Wilding, M.C., Webb, S.L., Dingwell, D.B. 1995. Chemical Geology, 125, 137.
- Woitke (2006) Woitke, P. 2006, A&A, 460, L9.
- Woolf (1973) Woolf, N. J.
- Woolf & Ney (1969) Woolf, N. J., Ney, E. P. 1969, ApJ, 155, L181.
- Zachariasen (1932) Zachariasen, W. H., 1932, Journal of the American Chemical Society, 54, 3841.


| Citation | Sample Preparation Technique | Sample Composition | Barycenter (m) | FWHM (m) | Barycenter (m) | FWHM (m) | |
|---|---|---|---|---|---|---|---|
| Day (1979) | chemical vapor condensation | Fo100 | 10.2 | 1.9 | 21.8 | 11.2 | |
| En100 | 10.0 | 1.8 | 20.9 | 6.9 | |||
| Scott & Duley (1996) | laser ablation of crystalline samples | Fo100 | 10.4 | 1.8 | 22.3 | 17.7 | |
| En100 | 10.0 | 1.8 | 22.5 | 17.3 | |||
| Krätschmer & Huffman (1979) | ion-irradiation of crystalline samples | Fo100 | 10.5 | 2.2 | 18.0 | 2.5 | |
| Jena | Melting and Quenching | Fo50 | 10.3 | 2.3 | 20.5 | 11.5 | |
| En50 | 9.8 | 2.6 | 20.0 | 7.3 | |||
| Dorschner et al. (1995) | Melting and Quenching | En100 | 9.8 | 1.8 | 20.4 | 9.8 | |
| En80 | 9.8 | 2.3 | 20.2 | 9.1 | |||
| En60 | 9.9 | 2.5 | 20.3 | 9.3 | |||
| En40 | 9.7 | 2.7 | 20.4 | 8.2 | |||
| Jäger et al. (2003) | Sol-Gel | Fo100 | 10.0 | 2.2 | 17.7 | 4.0 | |
| En100 | 9.5 | 2.0 | 20.3 | 9.1 | |||
| Jäger et al. (1994) | Melting and Quenching | dirtysil1 | 9.6 | 1.4 | 21.3 | 10.2 | |
| Mutschke et al. (1998) | Melting and Quenching | Gehlenite | 10.2 | 1.2 | 21.4 | 7.5 | |
| melilite | 10.5 | 1.8 | 19.9 | 5.6 | |||
| DL | synthetic | generic | 10.5 | 3.3 | 20.8 | 8.6 | |
| OHM warm | synthetic | generic | 10.7 | 2.5 | 19.7 | 5.7 | |
| OHM cold | synthetic | generic | 10.8 | 2.6 | 19.7 | 5.3 |
| 1 Mg0.50Fe0.43Ca0.03Al0.04SiO3 |
| Name | Formula | (kg m-3) | (K) | Al/(AlSi) | NBO/Ta |
|---|---|---|---|---|---|
| Synthetic Gehlenite | 2879 | 1111 | 0.68 | 0.65 | |
| Gehlenite Remelt | 2927 | 1032 | 0.44 | 1.43 | |
| Synthetic Akermanite | 2951 | 1012 | 0.01 | 3.04 | |
| Forsterite | 2920 | 1040b | 0.00 | 4.00 | |
| Diopside | 2853 | 999 | 0.00 | 1.91 | |
| Akermanite Remelt | 2995 | 932 | 0.25 | 2.15 | |
| Basalt | 0.03 | 1.48 | |||
| Synthetic Enstatite | 2735 | 1037 | 0.02 | 1.94 | |
| Enstatite remelt | 2769 | 1022 | 0.01 | 1.93 | |
| “Cosmic Silicate” | 2772 | 1001 | 0.09 | 1.92 | |
| Herasil | 2200c | 1420 | 0.00 | 0.00 | |
| Obsidian | 0.16 | 0.02 |
| a NBO/T |
| b from Tangeman et al. |
| c from manufacturer |
| weight percent oxide | Water contenta | |||||||||||
|---|---|---|---|---|---|---|---|---|---|---|---|---|
| name | SiO2 | TiO2 | Al2O3 | FeO | MnO | MgO | CaO | Na2O | K2O | P2O5 | total | (ppm) |
| Synthetic gehlenite | 21.53 | na | 37.88 | na | na | na | 40.85 | 0.12 | na | na | 100.37 | 76 |
| Gehlenite remelt | 31.46 | 0.01 | 21.11 | 1.58 | 0.01 | 5.47 | 40.26 | 0.27 | 0.02 | 0.04 | 100.22 | 85 |
| Synthetic åkermanite | 43.12 | na | 0.44 | na | na | 14.33 | 41.62 | na | na | na | 99.51 | 80 |
| Forsterite | 41.17 | na | na | na | na | 57.19 | na | na | na | na | 98.36 | bd |
| Diopside | 54.82 | na | na | na | na | 16.55 | 25.58 | na | na | na | 96.95 | 57 |
| Åkermanite remelt | 34.34 | 0.89 | 9.65 | 6.85 | 0.52 | 6.53 | 33.32 | 3.08 | 0.49 | 2.03 | 97.72 | 125 |
| Basalt | 45.92 | 3.04 | 15.99 | 10.16 | 0.13 | 8.04 | 13.45 | 0.80 | 0.18 | na | 97.71 | bd |
| Synthetic enstatite | 59.69 | na | 0.68 | na | na | 39.88 | na | na | na | na | 100.25 | 80 |
| Enstatite remelt | 58.30 | 0.02 | 0.66 | 4.74 | 0.12 | 35.43 | 0.54 | 0.02 | 0.01 | na | 99.85 | 63 |
| Cosmic silicate | 54.26 | na | 4.34 | na | na | 36.58 | 3.27 | 1.61 | na | na | 100.05 | 81 |
| Obsidian | 74.82 | 0.03 | 12.09 | 0.95 | 0.03 | 0.01 | 0.39 | 3.39 | 4.91 | na | 96.62 | 3000 |
| Herasilb | 100.00 | na | na | na | na | na | na | na | na | na | 100.00 | 940 |
| na = not analyzed (mostly for synthetic melts where the ingredients were well known) |
| bd = below detection limit |
| a determined from near-IR spectra using the method in Hofmeister et al. (2009) |
| b pure SiO2 with 15-26 ppm metals (Hofmeister and Whittington, in review) |
| SAMPLE | 10 m | 18 m | 10/18 m | ||||||||
|---|---|---|---|---|---|---|---|---|---|---|---|
| NAME | Peak | Barycenter | FHWM | Peak | Barycenter | FHWM | strength ratio∗ | Offset† | |||
| ( m) | (m) | (m) | (m) | ||||||||
| Gehlenite | 10.3 | 10.8 | 2.71 | 2.86 | 3.25 | ||||||
| Gehlenite RM | 10.8 | 10.6 | 2.69 | 2.88 | —‡ | 20.0 | 4.08 | 4.45 | 3.74 | 4.25 | 2.75 |
| Akermanite | 10.3 | 10.6 | 2.31 | 2.46 | 2.50 | ||||||
| Forsterite | 10.2 | 10.4 | 2.25 | 2.43 | 2.25 | ||||||
| Diopside | 10.1 | 10.2 | 2.33 | 2.46 | 19.2 | 19.4 | 4.34 | 4.12 | 1.65 | 1.26 | 1.50 |
| Akermanite RM | 10.3 | 10.1 | 2.63 | 2.70 | 21.0 | 20.9 | 4.45 | 4.70 | 1.78 | 1.57 | 1.25 |
| Basalt | 10.0 | 9.9 | 2.27 | 2.41 | 1.00 | ||||||
| Enstatite | 9.9 | 9.9 | 2.38 | 2.58 | 17.6 | 18.5 | 3.99 | 4.70 | 3.03 | 2.25 | 0.75 |
| Entatite remelt | 10.0 | 9.8 | 2.33 | 2.48 | 0.50 | ||||||
| Cosmic silicate | 9.8 | 9.7 | 2.76 | 3.15 | 18.3 | 18.7 | 4.64 | 4.54 | 4.87 | 4.79 | 0.25 |
| Obsidian | 9.0 | 9.1 | 1.91 | 2.14 | 0.00 | ||||||
| Herasil | 9.0 | 8.9 | 1.24 | 1.34 | 0.5 | ||||||
| ∗ strength is defined as the equivalent width (EW) of the feature, rather than the peak-to-continuum ratio. Therefore the strength ratio is EW10μm/ EW18μm. |
| Peak position for the Gehlenite remelt sample cannot be accurately measured because of interference fringes. |
| † the offset is added to the normalized -values and is applied in Figure 6 for clarity. |
| ‡ strong fringing prevents measurement of peak position. |
| RM designates remelted samples (see § 2.2) |