FIFA World Cup 2010: A Network Analysis of the Champion Team Play
Abstract
We analyze the pass network among the players of the Spanish team (the world champion in the FIFA World Cup 2010), with the objective of explaining the results obtained from the behavior at the complex network level. The team is considered a network with players as nodes and passes as (directed) edges, and a temporal analysis of the resulting passes network is done, looking at the number of passes, length of the chain of passes, and the centrality of players in the turf. Results of the last three matches indicate that the clustering coefficient of the pass network increases with time, and stays high, indicating possession by Spanish players, which eventually leads to victory, even as the density of the pass network decreases with time.
Introduction
The hypothesis that a complex network analysis can help understand soccer matches has been present for a long time. Several teams, formal or informally, have performed analysis of soccer matches from the point of view of the network of passes formed along the match. One starting point happened in 2004, when a competition to predict the four best-classified teams in the EuroCup that was celebrated that year was done in the Redes (Spanish for “network”) social-network mailing list (in Spanish). The results, which completely failed to predict the outcome, were published in http://revista-redes.rediris.es/webredes/eurocopa2004.htm.
The main problem with these predictions, besides the outcome, which was completely wrong (not even the two finalists, Portugal and Greece, were included in any of them) was that they were looking at the static picture of the team as it emerged from a previous match. It is quite clear that soccer is a game of two players, whose networks clash. While there must be some quantity that is kept from a game to the next, and that quantity is related to the team structure (midfielders, forwards, defense), the other team will do its best to prevent that network to move information (that is, the football) from one part to other, resulting in a quite unpredictable result.
On the other hand, the network does not have any kind of spatiotemporal information. A network might show a perfect structure, well formed, with short distances from goalie to forward players, but if it plays out of place or simply in its own field it will not be able to obtain a good result. On the other hand, if the network develops quite slowly with a low number of passes and low precision (low transitivity), the result will not be good either. In both cases, the static structure, while meaningful and a good qualitative description of the overall game, is unable to reflect them.
In this paper, spurred by the victory of the Spanish selection in the 2010 world cup, we have performed a spatiotemporal analysis of the essential games that led to victory. In this analysis, we have looked at the temporal evolution of the number of passes, the centrality of the player and pitch zones networks, and also at the length of the chains of passes and its transitivity (taking thus into account the effect of the opponent of simple ball losses). In this way, we take into account both the complex network structure (reflected in the power-law structure of the length of the number of passes and overall network structure) and the spatiotemporal nature of the game. In that sense, this paper is the first to make that kind of analysis, which can latter be complemented with other kind of static micro, macro, and meso measurements of the same type.
The rest of the paper is structured as follows: next, we examine the state of the art in analysis of the outcome of soccer matches. Then, the methodology used to extract data from the match is presented. An overall examination of the matches played by the Spanish team is subsequently performed. We close the paper with some conclusions and guidelines for future work.
State of the Art
Despite the huge cultural and popular interest that soccer arises, being arguably the most popular sport (or maybe spectacle) in the world, there have not been many scientific approaches to sport performance and prediction. This was true when Onody and de Castro, (2004) wrote their often-referenced paper in 2004, and it is still true today.
However, since then, several papers try to apply complex network analysis to the soccer world. The above-mentioned paper itself was seminal in its thoroughness: it analyzed the network of all Brazilian soccer players, and linked them if they had shared a team, and found that several metrics (number of teams by player, number of goals by player, number of games played) follow truncated power laws or exponential distributions. However, there was no attempt to relate any of those quantities to performance. Could the number of teams a player has participated be related to the number of goals?
In general, the prediction of performance has concentrated on the hypothesis that a team has some kind of intrinsic fitness –see Heuer and Rubner, (2009)– whose difference between teams affect the probability (not the certainty) of one beating the other. These studies have mainly concentrated on time series analysis (Heuer et al.,, 2010) but not intra-game dynamics.
Since the pass data for several world-class events (Euro Cup and World Cup) were made available, one of the authors has been doing informal analysis on the team’s networks and deducting from them some kind of qualitative prediction on the result of a match. However, this analysis was not formal at all, and even as differences between the network qualities of different teams were appreciated, it was difficult to relate them either to the team fitness or to the match outcome. The ARSfútbol team, based in Argentina, has done extensive analysis of world-class events as well as local low-level soccer teams (Bundio and Conde,, 2009), concluding that the performance of a team is mainly related to the existence of a well-coordinated core of players (such as the players coming from FC Barcelona in the Spanish national team or the set of players from Porto FC in the Portuguese selection). Even those post-hoc observations cannot be easily used for predicting performance.
In this paper, we will look at the micro-dynamics of a soccer team, the Spanish selection during the latest World Cup in which they emerged as champions, bringing happiness to millions of Spaniards all over the world. We will try to find out which quantities made the Spanish team excellent by focusing on quantitative analysis of its game-play. This will be used as a first step for a second leg of analysis which will be focus on prediction.
Data extraction
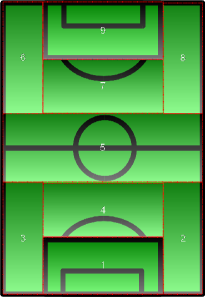
In order to collect the data for the analysis, an important issue was the fact that we intended to analyze the game play from a spatiotemporal perspective. The spatial dimension tries to capture the fact that a player can act in different parts of the pitch and his role (and therefore the way he performs and interacts with the teammates) may be different in each of these zones. For example, a certain midfielder can have a defensive role when the opposing team is attacking, and have the teammates in the last defensive line as preferred target for a pass whenever he regains control of the ball. On the other hand, this very same player can adhere to a much more combinative play when in offensive positions, interacting more with wingers and other creative midfielders. To this end, the pitch has been divided into nine zones as depicted in Figure 1: four zones correspond to defensive positions (own box, wingback lanes, and own midfield), other four zones correspond to offensive positions (opponent’s box and midfield and wingers’ lanes), and the the very central zone of the pitch which plays an important role for both initiating static attacks and pressing the opponent in defense. For the purpose of this analysis, each player is figuratively divided into 9 different players depending of the pitch zone in which they touch the ball (of course, most players only visit a limited number of zones throughout a given game).
As to the temporal perspective, our goal is to capture the fact that a football game can go through different phases in which a team can change its way of playing (e.g., the dominant team can become dominated even if just sporadically or the trainer may introduce tactical changes) or at least can change its effectiveness (e.g., a player that was nullified by an effective defense can resurface later on, when tiredness prevents the defenders for keeping on tight marks). To account for this, we also keep track of the minute in which each pass was done.
Once the kind of data we needed was defined, data extraction was done by ourselves, reviewing the knock-out games played by Spain (contrarily to regular group games in which a team can speculate with a draw or even with a somehow minimal loss in order to qualify for the next phase, knock-out games imply a win-loss situation and therefore the playing style and tactics is effectively directed at winning the game without depending on external factors111Winning the game must be interpreted here as progressing on to the next knock-out stage rather than, e.g., scoring more goals than the opponent. For example, a team may decide to play very defensively in order to reach the penalty shootout if they consider they will be outplayed otherwise; be it as it may, this reflects a definite and valid style, and is anyway not applicable to the games considered in which Spain went effectively to win the game before penalty shootouts.). These correspond to the games against Portugal (1/8th) (not analyzed in this paper), Paraguay (1/4th), Germany (semifinals) and the Netherlands (final). The raw data obtained from this visual inspection consists of a list of passes with the format
half minute player zone player’ zone’
indicating which player passed to which player, in which minute, and in which pitch zones were each of them. As mentioned before, each pair (player, zone) can be interpreted as a virtual player for the purposes of network construction. More precisely we consider a moving window of 15 minutes (which we believe is long enough to capture the state of the game at any given instant) and build a series of directed graphs where , is the set of actual players in the national team, and if, and only if, virtual player passed to virtual player within the -th time window.
This data was extracted by visualizing the matches by the authors; data collection took approximately 4-5 times the duration of matches222This data is available to the scientific community, with the provision that this paper is referenced should any publication arise from the study..
The Spanish Team Analysis
The Spanish national team attended the World Cup 2010 as one of the favorites to win the trophy. While to some extent this was not a completely new situation from the local point of view (and even the scientific point of view: Spain hosted the world cup in 1982, and New Scientist published an article proving why it should win due to home advantage (Dowie,, 1982)), in this case this consideration was quite reasonable a priori, since Spain was the current incumbent in Europe after winning the Euro Cup in 2008 for the 2nd time in history (the 1st time dating back to 1964 in the Euro Cup hosted precisely in Spain). This win at the European level (and even more precisely the win over Italy in penalty shootouts in the 1/4th game) was seen by many as a turning point from the psychological point of view, finally breaking the “curse of the 1/4ths” that had been unescapable for several other –very talented– Spanish teams. On reflection, the current generation of players was probably the most adequately suited for this purpose, since they had been surfing on a winning wave in the national team since junior stages (Íker Casillas, Xavi Hernández and Carlos Marchena were members of the team than won the U-20 World cup in 1999) and were also part of the last dominant cycles of Real Madrid CF and FC Barcelona at club level (holding numerous trophies a European and International club level).
The lack of this “choking culture” that had haunted preceding generations, and the final discovery of a playing style that players felt their own (incidentally a style that departed by long from the traditional “Spanish fury” that had been the national team’s trademark until them, and arguably a finding that was in part possible due to the unfortunate series of injuries of several players) led to the current success cycle of the the team. While this style –informally termed “tiki-taka” (an otherwise meaningless phrase that can be translated as “touchy-touch”) by the late Andrés Montes, a famous TV commentator– is now considered a “dogma of faith” by many in Spain, and is commonly assimilated to that used by FC Barcelona (a claim based on the number of players of this club in the national team), a deeper inspection indicates that there are definite stylistic differences not only between the national team and other clubs in Spain, but also between the Euro 2008 team and the World Cup 2010 team. The former had players such as Fernando Torres (then at Liverpool FC) or David Silva and David Villa (then at Valencia CF) at their highest performance level and played a much more direct, faster combinative football. The latter team had several of these players at a lower performance level, some key players in midfield or defense were obviously two years older, and other players more suited to passing play were incorporated. The result was a slower playing pace in which the ball and players move rapidly, but in which the net advance is slow (yet steady). In the following we will analyze some of the features of this style using the network information collected as indicated in Section Data extraction.
Quarter Final Match: Paraguay-Spain
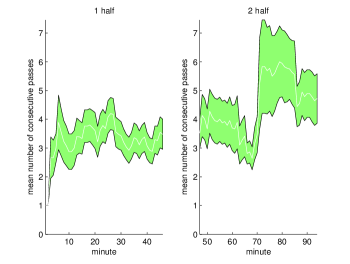
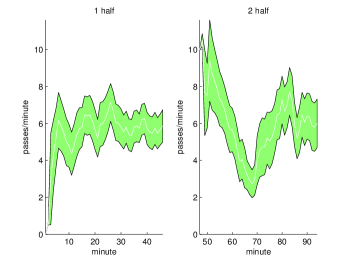
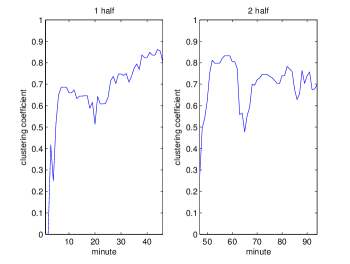
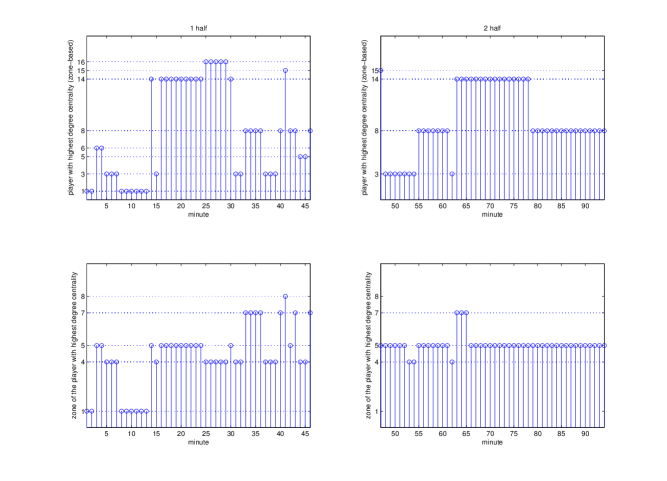
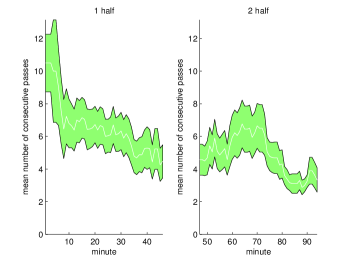
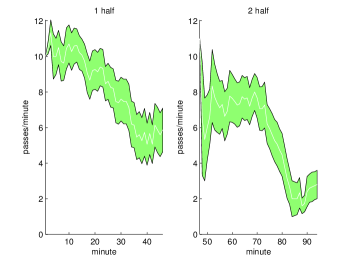
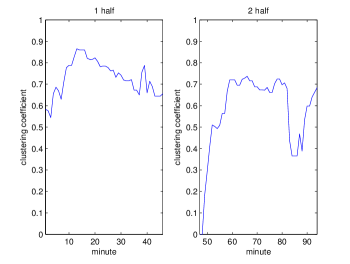
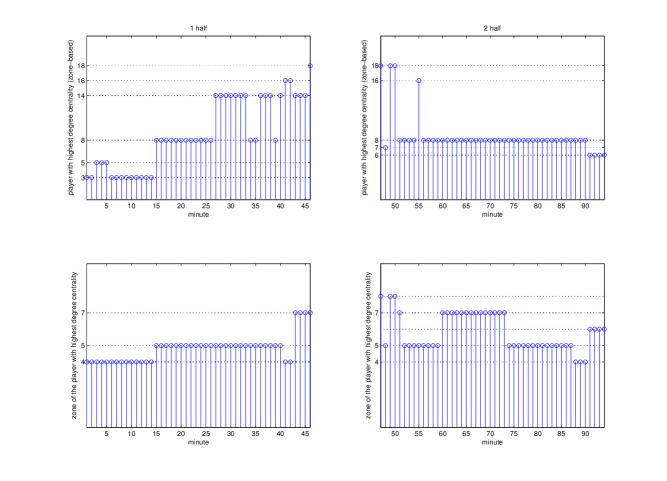
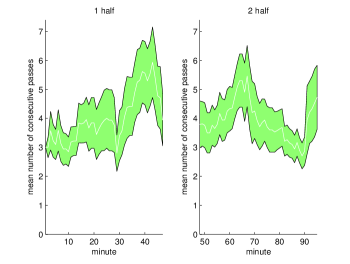
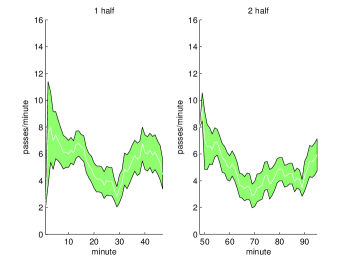
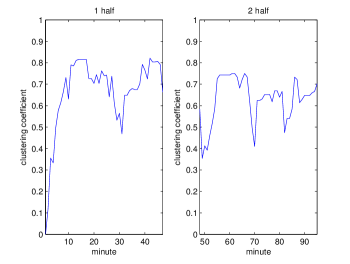
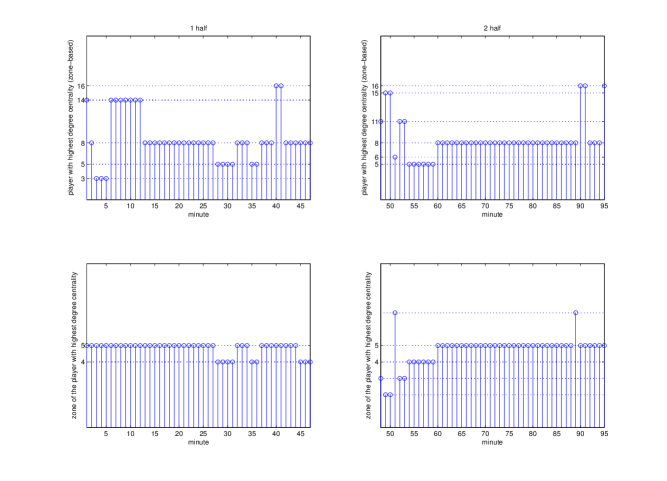
Spain reached quarterfinals after winning 1-0 (a result that would repeat itself in all remaining games) against Portugal. While the result of that last game was tight (and whether Villa, the scorer of the sole goal was in off side is open to some question), from a global point of view Spain was widely regarded as having dominated the game and deservedly progressing to quarterfinals, the historically unsurmountable barrier for the national team. The game was approached by Paraguay (a strong opponent, as demonstrated by their being runner-ups in the Copa América 2011) from a tactical premise: to disrupt the flow of the ball among Spanish players. They succeeded at it for most of the game, with Spain hardly achieving more than 3-4 consecutive passes (see Figure 2) and only attaining a moderate pace of about 6 passes per minute (see Figure 3). Although Spain eventually settled to its usual combinative game (see clustering coefficients in Figure 4), the first half was very irregular for the team, with no single player emerging as the most central (in terms of in-/out-degree), and with the game taking place mostly in Spain’s defensive zone (see Figure 5). This does not mean Spain was necessarily under attack, but that Paraguay’s pressing avoided Spain’s settling the ball in offensive zones. The game’s turning point took place with two penalty shoots failed successively by Paraguay and Spain (low valley shown in Figure 3–right), after which Paraguay lowered their defensive strength due to tiredness, and Spain could finally enter into longer sequences of passes, with Xavi Hernández and Xabi Alonso emerging as dominant players in the midfield.
Semi Final Match: Germany-Spain
The victory over Paraguay in the quarterfinals meant Spain advanced for the first time in history to semifinals333The previous best performance of Spain had been a 4th place in Brazil’s World Cup 1950, an edition in which there was a small league among the top-four teams., and a general consensus that the team had fulfilled the minimum expectations of the supporters. This meant that the semifinal was approached as a game in which there was nothing to loose (although it must be noted that the same held for Germany, who had presented a very young team and a new, less physical style, and were in a transitional year). Maybe due to this lack of pressure, Spain put forward their best performance in all the tournament.
The game was thoroughly dominated by Spain, who managed to engage in a fast game (well above 6 passes per minute, the ceiling reached for the most part of the game against Paraguay, cf. Figures 3 and 7) and more elaborated sequences of passes (roughly twice as much as against Paraguay, cf. Figures 2 and 6). It is interesting to note that the clustering coefficient was rather stable (the drop near the end of the 2nd half corresponds to the final push exerted by Germany once they were 1 goal down) and similar to that reached against Paraguay, which indicates the underlying passing pattern was maintained in both games (but was more effective –i.e., resulted in longer sequences of passes– against Germany). Xabi Alonso and specially Xavi Hernández during the 2nd half were the clear hubs of the game (Paraguay had partly succeeded in disabling these two players, hence the more disconnected game). Actually the 2nd half saw the ball parked deeply inside the German field (Figure 9–bottom, right), indicating a clear domination of the game: sequences of up to 24 passes took place before Spain’s goal (which paradoxically was a header after a corner kick).
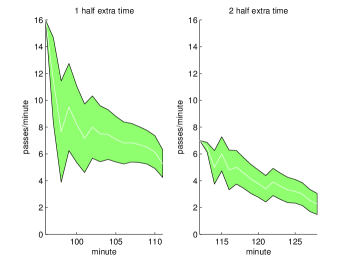
Final Match: Netherlands-Spain
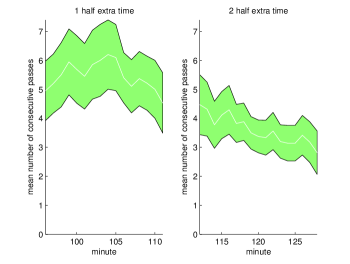
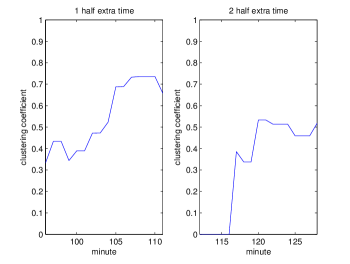
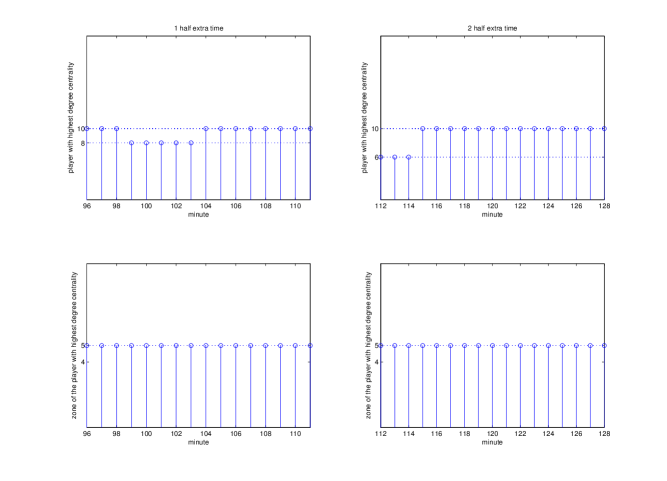
The great final took place against the Netherlands, a very talented team that featured one of the best players of the season in the midfield (Wesley Sneijder, surprisingly left out of the Ballon d’Or contest) and possibly the fastest and finest winger in the whole tournament (Arjen Robben). Indeed, the connection among these two players could have very well tilted the balance in favor of Netherlands had not Íker Casillas provided an outstanding performance. Despite the flair available on the pitch, the Dutch team engaged however in a very rough playing, forever iconized in Nigel de Jong’s ominous tackle on Xabi Alonso’s chest444http://l-g.me/deJong. To some extent the tactical objective was similar to that of Paraguay’s –disrupt the smooth flow of the ball in the Spanish team— yet the execution was much more questionable (and so was the condescending attitude of the referee towards it). The game settled for the most part in a very slow pace due to the number of interruptions (Figure 12), and sequences of passes were generally short, analogously to the game against Paraguay. Unlike the latter game, the Dutch team succeeded in disabling Xabi Alonso but the balance of the game followed a similar pattern in that the physical style of the Netherlands became less consistent as time passed. The midfield was eventually controlled by Xavi Hernández and –despite two clear fast breaks by Robben mentioned before– the ball advanced away from Spain’s defensive zone. The average number of consecutive passes gained momentum at the end of the 2nd half and was rather stable during the 1st part of the extra time. Not surprisingly, the pace of the game decreased steadily during the extra time (Figure 13), due to both the exhaustion of the players and the team strategy shifting to a safer mode of holding possession in order to avoid conceding a late goal and trying to exploit a more direct approach when possible. Indeed, the clustering coefficient during the 2nd part of the extra time is much lower than in remaining games (Figure 15), which is consistent with a less structured development of the game and larger distances between team lines. The whole extra time witnessed the emergence of Cesc Fàbregas (Figure 17), coming from the bench to dominate the midfield, providing eventually the assist that resulted in Andrés Iniesta’s decisive goal.
Conclusions and Future Work
This work has attempted to use some simple graph and network metrics to analyze the performance and playing style of the Spanish national football team in the World Cup 2010. When analyzed from a temporal perspective, global measures such as the number of consecutive passes or the number of passes per minute provide a measure of the success of the team in imposing its style (or alternatively the success of the opposing team in disrupting the style of the Spanish team). A deeper insight is obtained by observing the clustering coefficient with captures the combinative nature of the “tiki-taka” style. While prone to a kind of baroqueness in the sense that many passes are often done in a short distance and might be expendable, it is evident that it has prime value as a defensive strategy, by depriving the opponent of ball possession, one of the factors that is determinant in the game outcome (Lago and Martín,, 2007; Bate,, 1988). Even in the games in which the performance of the Spanish team has been deemed worse by analysts and the general public, this combinativeness imprint globally remains, with marked valleys in the aftermath of scoring a goal (and the subsequent push of the trailing team) and sporadically during the final, a special game in which emotions and passion often led to lower precision and less elaborated game-play.
There is of course much work to be done. From the pure methodological point of view, it is of crucial importance to keep analyzing other network measures such as node and edge betweenness, which naturally capture the hubs and essential associations in the distribution of the ball (let us note en passant here as an example that the role of Sergio Busquets was initially much criticized by the press and a large part of the public due to his lower creativeness; however it is clear that he was instrumental in providing balance to the midfield; uncovering his role in the circuit of distribution of the ball by means of an objective network metric would be of foremost interest). Other measures such as eigenvector centrality can be very valuable for this purpose. This can have not just an explanatory value, but also a predictive value in terms of identifying the weak points of the circuit that may be targeted by the opponent. In addition to these methodological issues, it will be very interesting to deploy this kind of analysis on further data both at club level (e.g., to identify similarities and dissimilarities between team an player performance in their clubs and in the national team), and at the national team level such as in the upcoming Euro 2012 in Poland and Ukraine or –looking beyond– the World Cup 2014 of Brazil.
Acknowledgements
This work has been supported in part by the CEI BioTIC GENIL (CEB09-0010) MICINN CEI Program (PYR-2010-13) project, the Andalusian Regional Government P08-TIC-03903, P08-TIC-03928, and TIC-6083 projects, and MICINN TIN2008-05941. We would like to acknowledge the support of recently awarded project TIN2011-28627-C04-02 and TIN2011-28627-C04-01.
Appendix A Appendix. Spain’s Squad Numbers
| # | Name | Position | |||
|---|---|---|---|---|---|
| 1 | Íker Casillas | Goalkeeper | |||
| 2 | Raúl Albiol | Defender | |||
| 3 | Gerard Piqué | Defender | |||
| 4 | Carlos Marchena | Defender | |||
| 5 | Carles Puyol | Defender | |||
| 6 | Andrés Iniesta | Midfielder | |||
| 7 | David Villa | Forward | |||
| 8 | Xavi Hernández | Midfielder | |||
| 9 | Fernando Torres | Forward | |||
| 10 | Cesc Fàbregas | Midfielder | |||
| 11 | Joan Capdevila | Defender | |||
| 12 | Víctor Valdés | Goalkeeper | |||
| 13 | Juan Mata | Forward | |||
| 14 | Xabi Alonso | Midfielder | |||
| 15 | Sergio Ramos | Defender | |||
| 16 | Sergio Busquets | Midfielder | |||
| 17 | Álvaro Arbeloa | Defender | |||
| 18 | Pedro Rodríguez | Forward | |||
| 19 | Fernando Llorente | Forward | |||
| 20 | Javi Martínez | Midfielder | |||
| 21 | David Silva | Midfielder | |||
| 22 | Jesús Navas | Forward | |||
| 23 | José Manuel Reina | Goalkeeper |
References
- Bate, (1988) Bate, R. (1988). Football chance: tactics and strategy. Science and football, pages 293–301.
- Bundio and Conde, (2009) Bundio, J. and Conde, M. (2009). Análisis del desempeño deportivo durante la eurocopa 2004 a partir del análisis de redes sociales. REDES-Revista hispana para el análisis de redes sociales, 13(0).
- Dowie, (1982) Dowie, J. (1982). Why Spain should win the world cup. New Scientist, 94(10):693–695.
- Heuer et al., (2010) Heuer, A., Mueller, C., and Rubner, O. (2010). Soccer: Is scoring goals a predictable poissonian process? EPL (Europhysics Letters), 89:38007.
- Heuer and Rubner, (2009) Heuer, A. and Rubner, O. (2009). Fitness, chance, and myths: an objective view on soccer results. The European Physical Journal B - Condensed Matter and Complex Systems, 67:445–458. 10.1140/epjb/e2009-00024-8.
- Lago and Martín, (2007) Lago, C. and Martín, R. (2007). Determinants of possession of the ball in soccer. Journal of Sports Sciences, 25(9):969–974.
- Onody and de Castro, (2004) Onody, R. and de Castro, P. (2004). Complex network study of brazilian soccer players. Physical Review E, 70(3):037103.