Influence of gas pressure on high-order harmonic generation of Ar and Ne
Abstract
We study the effect of gas pressure on the generation of high-order harmonics where harmonics due to individual atoms are calculated using the recently developed quantitative rescattering theory, and the propagation of the laser and harmonics in the medium is calculated by solving the Maxwell’s wave equation. We illustrate that the simulated spectra are very sensitive to the laser focusing conditions at high laser intensity and high pressure since the fundamental laser field is severely reshaped during the propagation. By comparing the simulated results with several experiments we show that the pressure dependence can be qualitatively explained. The lack of quantitative agreement is tentatively attributed to the failure of the complete knowledge of the experimental conditions.
pacs:
42.65.Ky,32.80.RmI Introduction
In the last two decades, high-order harmonic generation (HHG) has been widely studied for its potential as a short-wavelength tabletop light source Tenico ; Tenico2 ; light-source , or as an ultrashort attosecond pulse or pulse train Atto1 ; Atto2 . The harmonic emission in a gas medium is well understood qualitatively. Harmonics are emitted when atoms or molecules are exposed to an intense infrared laser field. These lights travel collinearly with the input laser and interact with the generating medium. Thus a full description of HHG involves a quantum treatment of the harmonic emission from a single atom or molecule, together with the propagation of the harmonics and the nonlinear interaction of the laser light with the medium. Recently, Jin et al. Jin09 ; JinJPB ; JinPRA2011 ; Jin-CO2 have combined the well-established propagation theory with the quantitative rescattering (QRS) theory qrs1 ; qrs2 ; qrs3 for individual atoms and molecules, to provide a quantitative description of HHG generated from atomic and molecular targets by an intense laser pulse. Its success has been shown by comparing with the recent experimental measurements JinJPB ; JinPRA2011 ; Jin-CO2 . These applications have focused on the region where the fundamental laser field is not severely modified in the medium. Such studies are useful for using HHG to probe the structure of molecules. For applications, it is desirable to achieve highest number of photons by increasing the laser intensity and the gas pressure. If the HHG from individual atoms are fully phase-matched, then the number of photons will increase quadratically with the medium pressure. Unfortunately, the nonlinear interaction of lasers with the gas medium is complicated. The intense laser light and the harmonics can be dispersed and absorbed by the medium. The intense laser light also ionizes the atoms (or molecules) and generates free electrons, thus changing the optical properties of the gas medium. These nonlinear interactions of the laser light and the harmonics with the medium can be calculated by solving the proper Maxwell’s wave equations, with the induced dipole from each atom or molecule by the laser as the source of the harmonics. A detailed theory of harmonic generation with the inclusion of macroscopic propagation where single-atom HHG emissions are calculated with the QRS theory has been given in Ref. JinPRA2011 .
In this paper our goal is to extend this theory to the harmonic generation for laser intensities near and above the critical intensity for a given target. In particular, we want to investigate the effect of pressure on the yield of HHG, as the intensity is varied or when the focusing conditions are changed. At high intensities, HHG is a highly nonlinear process, and the harmonic yields are very sensitive to all the parameters of the experiment. These parameters, unfortunately, are not always well specified in an experiment. We perform simulations by varying some parameters in order to achieve optimal agreement with the reported experimental data. We also check the effects of various parameters of the medium to illustrate how these individual parameters change the simulated HHG spectra. These kinds of studies have been carried out previously, sometimes connecting with experimental observations. However, in these calculations HHG from each atom was often calculated using the strong field approximation (SFA), or the so-called Lewenstein model SFA . It is well known that the SFA does not predict correct HHG spectra from individual atoms. By using QRS, the atomic dipoles induced by the laser are accurately calculated. These induced dipoles are then fed into the Maxwell’s propagation equations. We perform simulations to check to what extent some of the earlier experimental HHG spectra can be simulated with the present theory.
In Section II, we briefly summarize how the calculations are done. We then simulate the HHG spectra of Ar for 6-fs pulses at quite high intensity reported in Ref. Altucci05 . We also examine the effect of gas pressure on the behavior of Cooper minimum at high intensities. For higher pressure the laser field is severely modified as it propagates through the medium. We show that the Cooper minimum eventually disappears at pressure above about 50 Torr. The disappearance of the Cooper minimum is entirely due to the medium propagation effect Japan . Next we examine the pressure effect on the harmonics, and it is established in general that there is an optimum pressure for each harmonic beyond which the harmonic yield drops with increasing pressure. Since the propagation of harmonics is controlled by the optical properties of the medium, we check if there is a single factor that would mostly affect the harmonic generation. We also take a close look at the dispersion and absorption coefficients used in the simulation. These tabulated data, which were obtained from theoretical calculations, have not been carefully calibrated and should be used with caution. Finally we examine the propagation of HHG generated in Ne at high intensity and high gas pressure to compare with the result reported in a recent experiment Dachraoui09 . We have found that in this case HHG spectra are very sensitive to the experimental parameters such that simulation can only achieve qualitative agreement.
II Theoretical method
The detailed description of the theoretical method used in the calculation can be found in Ref. JinPRA2011 . Briefly, we consider both the propagation of the fundamental and the harmonic fields in an ionizing medium. For the fundamental field, we include dispersion, absorption, Kerr, and plasma effects. For the harmonics, the dispersion and absorption due to neutral atoms are included. The induced dipoles for single atoms are obtained using the QRS theory qrs2 :
| (1) |
Here is the wave packet calculated from the Lewenstein model SFA , normalized by the tunneling ionization rate calculated using the Ammosov-Delone-Krainov (ADK) theory ADK ; Tong . The transition dipole moment is obtained by treating the real atom in a single-active electron approximation. For the argon target used in the present work, is calculated by using the model potential given by Müller Muller . For Ne, the model potential takes the form given in Refs. Tong ; Jin09 . The resulting induced dipoles for hundreds of different peak intensities are then fed into Maxwell’s wave equations. We assume that the laser beam at the entrance of the gas jet has the Gaussian shape both in time and space. The harmonics emitted at the exit face of the gas jet may propagate further in free space until they are detected. Thus the harmonic spectra observed experimentally also depend on the detecting conditions JinPRA2011 . In this paper, except for one case to be described below, all the harmonic signals (i.e., the total signal) from the exit of the medium are collected.
III Results and discussions
III.1 Macroscopic HHG spectra of Ar: Theory vs experiment
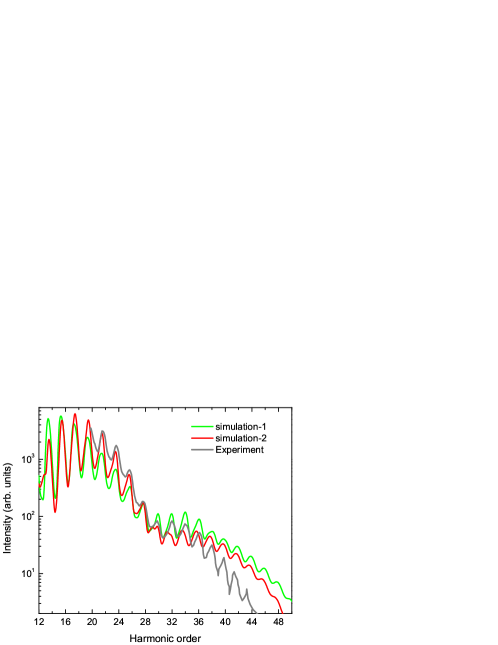
We first simulate experimental HHG spectra of Ar generated by a 760-nm and 6-fs (FWHM) laser pulse reported in Altucci05 . Experimentally, the gas jet was placed 2 mm after the laser focus. The confocal parameter of the laser beam was 10 mm (the beam waist was 34.8 m if a gaussian beam is assumed). The laser intensity at the focus was estimated to be 61014 Wcm2. In simulation-1, we use the gas-jet width of 1 mm, and the gas pressure is 40 Torr. We find that a laser peak intensity of 4.51014 Wcm2 would give better agreement with the spectra in the cutoff region. The calculations have been carried out for different carrier-envelope phases (CEPs) since a short 6-fs laser pulse was applied in the experiment. The theoretical spectra are finally averaged over all the CEPs. To compare with experiment, the HHG spectra are normalized at harmonic 27 (H27). We can see that the main features in the experimental spectra are well reproduced by simulation-1. However, the overall slope of the harmonic yields is not the same. The simulated harmonic yields are too low for lower orders, but too high for higher orders. But this result is already a great improvement over the theoretical simulation reported in Fig. 4(c) of Ref. Altucci05 . Since HHG spectra are sensitive to experimental conditions, we thus make another simulation where the gas-jet length is extended to 2 mm and the laser intensity is reduced to 4.01014 Wcm2. In this simulation-2, other parameters are the same as those in simulation-1. We can see that simulation-2 gives better agreement for the low harmonics up to H27, but the slope for higher harmonics is still not reproduced correctly. We have made further adjustment of the laser parameters within the capability of our present code but were unable to improve agreement. At present our code is limited to a Gaussian (spatial) input pulse. In the experiment of Altucci et al. Altucci05 , the laser was coupled into an argon-filled capillary consisting of a 60-cm-long fiber whose spatial profile would be the Bessel function. Thus the emerged 6-fs pulse may be closer to a truncated Bessel beam. It remains to be seen if the discrepancy can be removed if a truncated Bessel beam is assumed for the input pulse Bessel1 ; Bessel2 ; Bessel3 .
Below we aim at investigating the gas pressure effects on the HHG spectra.
III.2 Influence of the gas pressure on Cooper minimum and spectral modulation
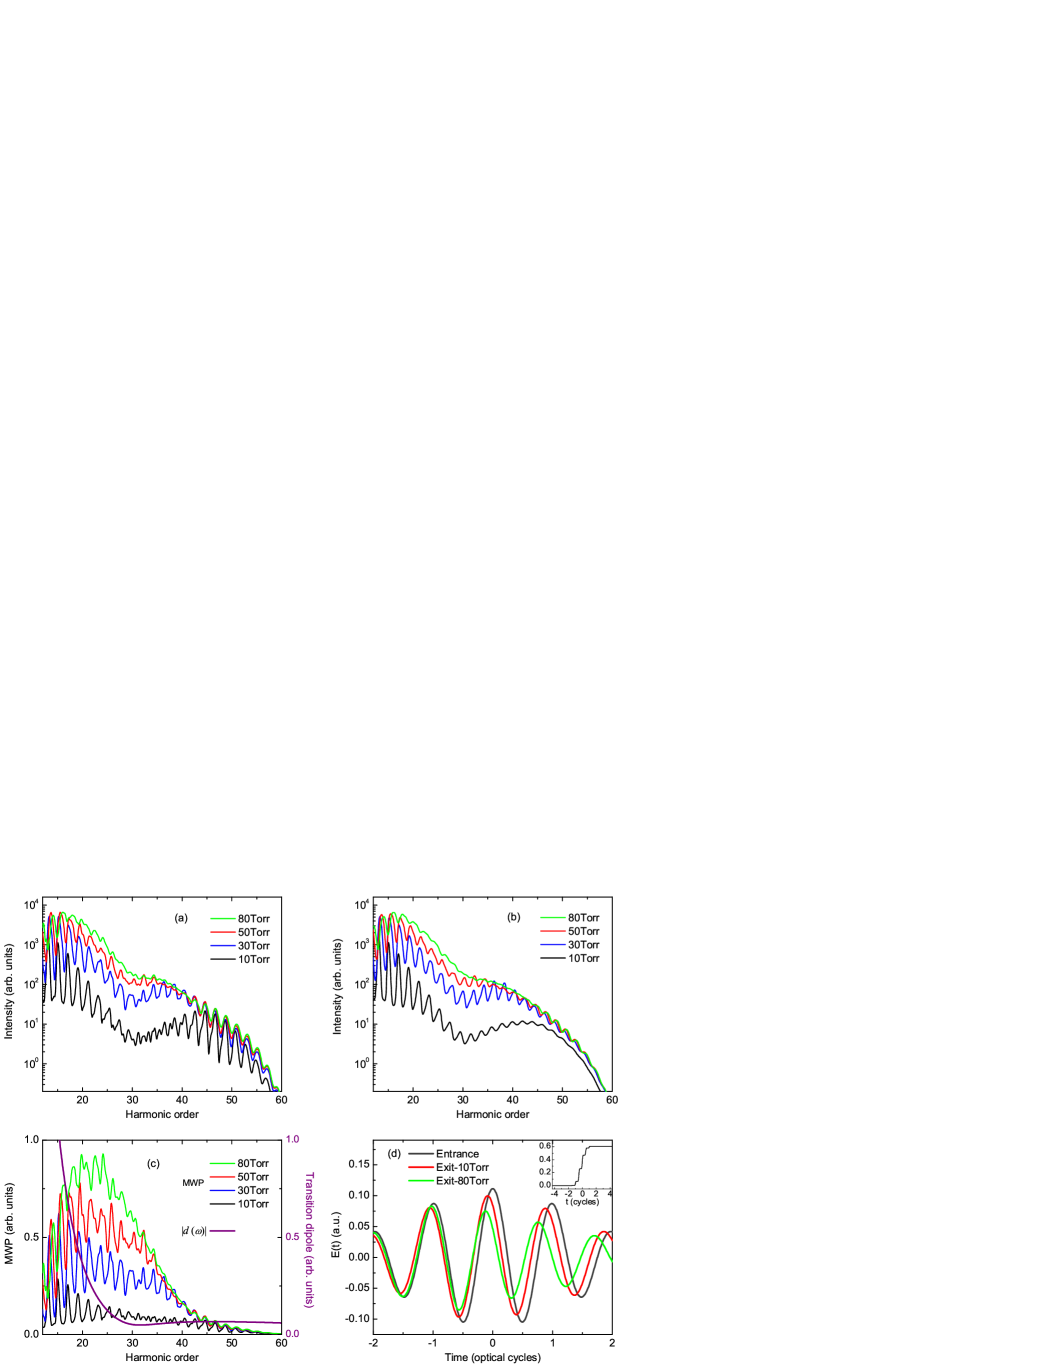
In Figs. 2(a) and 2(b) we show the macroscopic HHG spectra of Ar for four different gas pressures: 10, 30, 50, and 80 Torr, at a laser intensity of 51014 Wcm2 at focus for CEP=0 and CEP averaged, respectively. The other parameters are the same as those in simulation-1 of Fig. 1. Since a few-cycle pulse is used, the harmonic spectra show a strong CEP dependence in the cutoff region. After CEP average the spectra become very smooth. There are two additional features in Figs. 2(a) and 2(b) that warrant further discussions.
The first is about the well-known Cooper minimum (CM) of the HHG in Ar. Although CM in harmonic spectra is a signature of the electronic structure of the Ar atom Hans-prl-09 ; Colosimo-NatPhys08 , previous experimental studies have shown that the “visibility” of CM is sensitive to experimental conditions. For example, the position of the gas jet stanford and the gas pressure Japan could wash out the CM seen in the harmonic spectra. It has also been pointed out by Jin et al. JinPRA2011 that the CM also depends on how the HHG spectra are measured, i.e., in the near or the far fields, with or without the slit. The present simulations show a similar CM dependence on gas pressure, which has been observed in Ref. Japan , although the experiment was performed under different conditions (laser duration was 50 fs, and the laser intensity was 2.81014 Wcm2). In Figs. 2(a) and 2(b), there appears an obvious minimum around 31st harmonic (51 eV) below 30 Torr. When the pressure is increased to 50 Torr, the minimum becomes barely visible, and then it is totally washed out when the pressure is increased to 80 Torr. According to the QRS JinJPB ; JinPRA2011 , these variations are attributed to the change of the macroscopic wave packet (MWP). The QRS states that the macroscopic HHG spectrum can be expressed as Jin09 ; JinJPB ; JinPRA2011
| (2) |
where is the MWP, which reflects the effect of laser and experimental conditions, and is the photorecombination (PR) transition dipole moment, which is a property of the target only. In Fig. 2(c) we show the detailed comparison of the MWPs at four gas pressures for CEP=0. It shows that the MWP () varies with the gas pressure. Around photon energy of 50 eV (H31), the MWP is very flat at 10 Torr. With increasing gas pressure it becomes more steeper. Meanwhile, we also show the PR transition dipole moment for reference. It is concluded that the rapid change of the MWP around 50 eV causes the disappearance of the CM in the HHG spectra.
The second feature in Fig. 2 is the spectral modulation. In Fig. 2(a), for harmonics above the CM, the spectra modulation is large at 10 Torr. The spectra are less modulated at 30 and 50 Torr, and become almost continuous when the gas pressure is increased to 80 Torr. These continuous HHG spectra could be used to produce isolated attosecond pulses (IAPs) with a CEP-stabilized laser. Note that the continuum structure in HHG spectra of Xe has been discussed by Jin et al. Jin-Atto recently [see Fig. 1 in that paper]. They found that reshaping (blue shift and defocusing) of the fundamental laser field was responsible for these phenomena, and they also showed a method to produce an IAP by spatial filtering in the far field. To check this mechanism in our situation, we show the evolution of the on-axis electric field at the entrance and exit of the gas jet for 10 Torr and 80 Torr in Fig. 2(d). Note that the time is defined in the moving coordinate frame JinPRA2011 ; Jin-Atto . The ionization probability is very high (about 61 at the end of a laser pulse with peak intensity of 4.631014 Wcm2). The electric field has a good Gaussian form at the entrance. In the leading edge of laser pulse, where the ionization probability is very small as seen in the inset of Fig. 2(d), the electric field at the exit face has a small shift with respect to the one at the entrance. This shift is originally from the geometric phase due to the tightly focused laser beam. In the falling edge, there is an obvious blue shift, and the electric field at 80 Torr is much reduced than that at 10 Torr. We can conclude that the fundamental laser field is reshaped. Combined with effects due to CEP average, our simulations in Fig. 2(b) show that spectral modulation above the CM increases from 10 Torr to 30 Torr, and then decreases with increasing gas pressure until the HHG spectra become continuous at 80 Torr. Similar phenomena have been observed in Zheng et al. APL for a phase-stabilized few-cycle laser pulse.
III.3 Gas pressure dependence of HHG conversion efficiency at fixed laser intensity and gas-jet length
III.3.1 The optimal HHG yield vs gas pressure
The macroscopic harmonic generation is strongly influenced by many factors collectively. In other words, the conversion efficiency cannot be improved by just increasing the laser intensity, atomic density, and medium length independently. There are three physical effects that limit harmonic generation: absorption, defocusing, and dephasing Krausz2000 . Many experimental and theoretical studies that investigated harmonics efficiency (or photon flux) have been carried out, such as absorption by Schnürer et al. Schnurer99 ; Schnurer2000 , defocusing by Altucci et al. Altucci96 and Dachraoui et al. Dachraoui09 , and dephasing in a hollow waveguide in Refs. Rundquist98 ; Durfee99 .
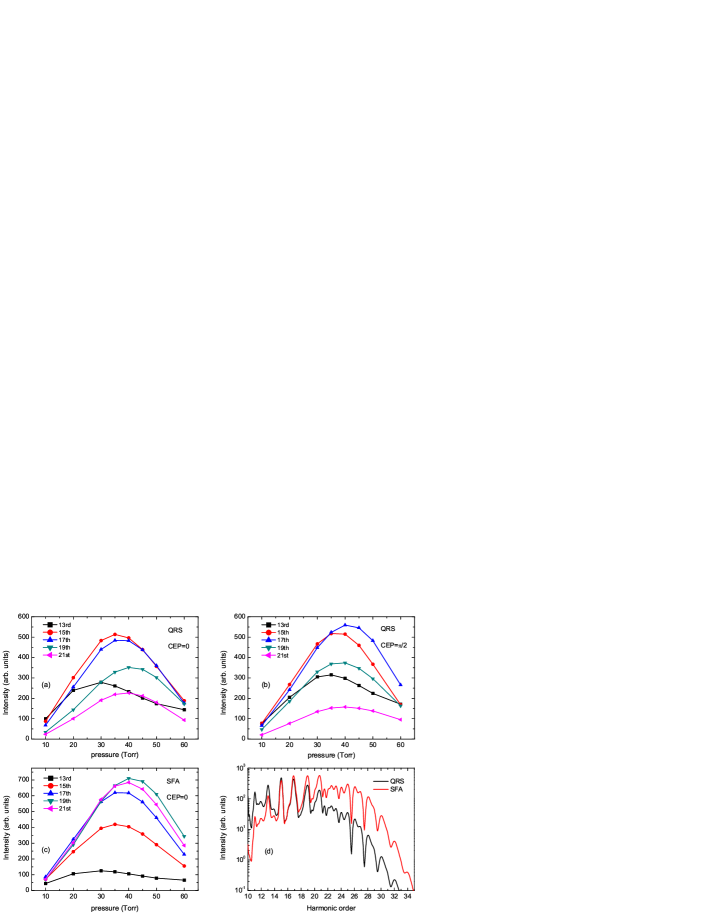
Figure 3(a) shows the dependence of harmonic intensity on the gas pressure for different plateau harmonic orders between H13 and H21 for CEP=0 at the intensity of 21014 Wcm2. The gas jet is 1-mm long, with other parameters the same as those in simulation-1 of Fig. 1. With the increase of gas pressure, the yield for each harmonic order increases first to reach a maximum and finally drops with even higher pressure. The maximum yield shifts to a higher pressure for higher harmonic order, especially in the region of low harmonic orders. These have been demonstrated experimentally in an Ar gas-filled hollow waveguide Rundquist98 and in a gas cell Xu04 . We show a similar figure for CEP=/2 in Fig. 3(b).
The above results are most easily understood from a one-dimensional model given by Constant et al. Constant . For the th harmonic order, the number of photons is proportional to [Eq. 1 of Ref. Constant ]
| (3) | |||||
where (units: Cm) is the amplitude of the atomic response. Here Lcoh= is the coherence length, where is the wave vector mismatch between the fundamental and the generated harmonic field, Labs=1 is the absorption length, where and are the photoionization cross section and the density of the generating gas, respectively. According to this model, if we assume to be independent of (this is true for a loosely focused laser beam), then the harmonic yield is determined by the three parameters: the medium length Lmed, coherence length Lcoh, and absorption length Labs. The phase mismatch is determined by different dispersion terms: atomic, electronic, geometric dispersion (the so-called Gouy phase for a Gaussian beam), and by the gradient of the atomic dipole phase Dachraoui09 . In Fig. 3, the medium length is fixed. An increase of pressure makes the absorption length smaller. According to Fig. 1 of Constant , the harmonic yield would reach saturation, the larger the phase mismatch, the smaller the number of photons generated for the harmonic. The results from Fig. 3 which are simulated from the 3D model, show that as the pressure increases beyond the optimal pressure for the generation of a given harmonic, continuing increase of pressure makes the harmonic yield drop. In fact, since the coherent length varies spatially for each harmonic, the spatial distribution of the harmonic signal also changes with pressure. In fact many factors will influence coherence length or absorption length through their dependence on gas pressure. Furthermore, the coherence length and absorption length also depend on harmonic order. All of these can affect the change of optimal pressure with harmonic order. If the single-atom harmonics are calculated using SFA, the pressure dependence of each single harmonic will be qualitatively correct, see Fig. 3(c). On the other hand, the relative intensities between the harmonics would not be correct since SFA does not use correct photoabsorption cross sections. Thus the HHG spectra predicted using SFA and QRS are different, see Fig. 3(d).
III.3.2 Dependence of harmonic spectra on the optical properties of the gas medium

In the calculations above, few-cycle laser pulses are applied and laser intensity is low such that free electron density in the gas medium is very small. We have checked that effects due to free electrons (defocusing and phase mismatch) in these calculations are negligible. In the simulation we include the dispersion (), Kerr nonlinearity () of the fundamental field, the dispersion () and absorption () of the harmonic fields in the simulation JinPRA2011 . All of these factors are pressure dependent. Note that , , and all contribute to phase mismatch ; in other words, they all affect the coherence length Lcoh. In the meanwhile, leads to pressure-dependent Labs. To see how each term contributes to the HHG yield, we remove each term successively from our model. The results (envelope of HHG spectra only) are shown in Figs. 4(a) and 4(b) for two pressures, 10 Torr and 50 Torr, respectively. At 10 Torr, , , and are small, their effects can be neglected, but the absorption term is important, especially for low harmonics. [Note that is large below 25 eV, see Fig. 4(c)]. When the gas pressure is increased to 50 Torr, the absolute values of , , and all increase by five times. Their effects become significant. In other words, with increasing gas pressure, the change of coherence length cannot be attributed to one single factor only.
For the absorption effect, we first calculate the absorption length Labs for H15. They are about 2.4, 0.8, and 0.5 mm at the gas pressures of 10, 30, and 50 Torr, respectively. According to Eq. (3), only when L Labs the absorption effect would become important. This has been verified in our calculation by comparing H15 at two gas pressures without in the model. The absorption effect becomes significant for all harmonics in the plateau at high pressure (50 Torr). It is important only for low harmonics at low pressure (10 Torr).
We also show atomic scattering factors and in Fig. 4(c), they are related to and respectively JinPRA2011 . We can see that the change of harmonics with or without (or ) follows the energy dependence of (or ). From Fig. 4, we conclude that there is not a single dominant factor that determines the pressure dependence on the HHG observed in Figs. 3(a) and 3(b). Since these factors are wavelength dependent, the effects vary with the harmonic order.
III.3.3 Dispersion and absorption data from different sources
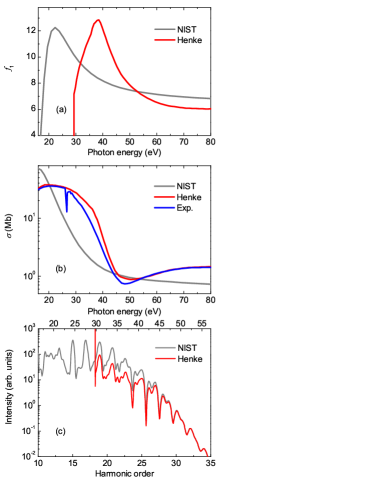
In Fig. 4, we have used the atomic scattering factors and from NIST NIST to calculate the dispersion () and absorption () effects in the propagation equation. An alternative set of atomic scattering factors are given by Henke Henke . These two sets of data are compared in Figs. 5(a) and 5(b). Since is related to atomic photoionization cross section through , where is the classical electron radius, we can obtain theoretical from these two sources to compare with experimental photoionization cross sections tabulated in PI . We note that the NIST data underestimate the absorption cross sections quite significantly. This would have the effect of overestimating the simulated HHG yields. Using these two sets of atomic scattering factors to simulate the HHG spectra, as shown in Fig. 5(c), there are significant differences between the two calculations for the lower harmonics. Such differences have not been addressed in the literature as far as we know. However, the data set from Henke Henke did not extend below 29 eV. In fact, it drops precipitously below about 40 eV. These atomic scattering factors were calculated originally for x-ray energy region. They are perhaps not very reliable in the photon energies considered here. The accuracy of scattering factors in this energy region probably should be used with caution.
III.4 Pressure dependence of HHG at different laser intensities and gas-jet lengths
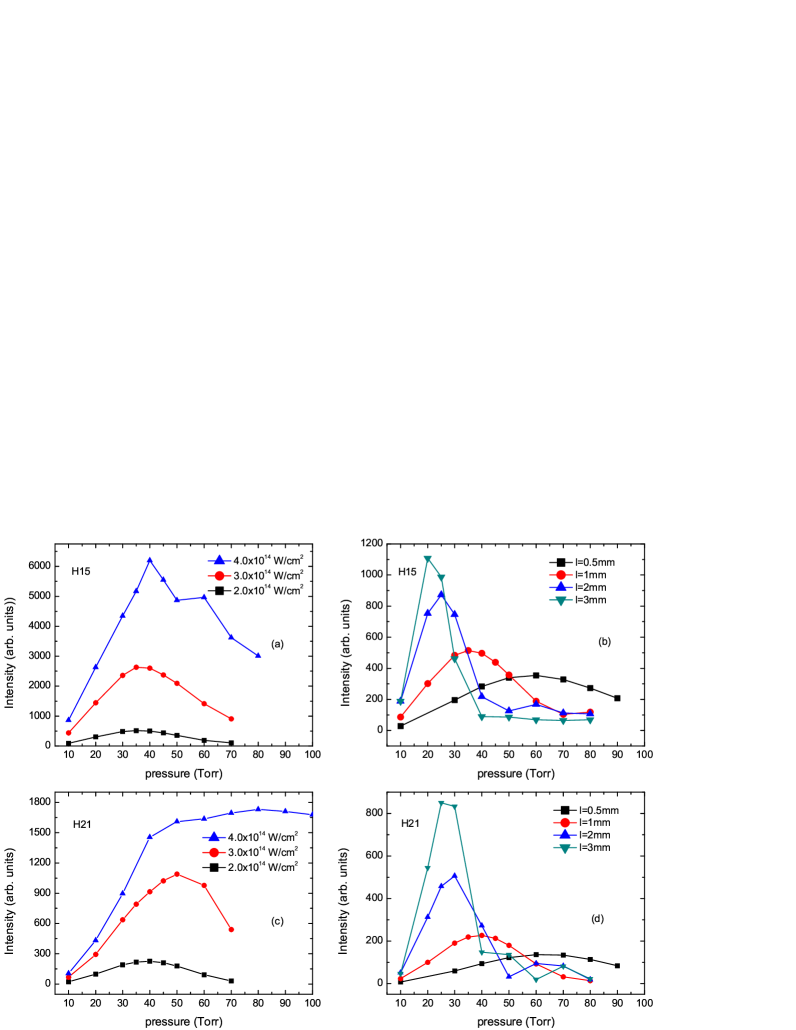
Figures 6(a) and 6(c) compare the pressure dependence of H15 and H21 at three different intensities in a gas jet with the length of 1 mm. For each intensity, the pressure dependence is similar to what we have seen in Fig. 3. As the intensity is increased, we note the highest harmonic yield occurs at a higher pressure. Comparing the two harmonics, the optimum harmonic yield also moves to a higher pressure for the higher harmonic. For intensity of 4.01014 W/cm2, H21 achieves optimal yield at a pressure close to 100 Torr. Because higher intensity results in higher free electron density, consequently, a higher gas pressure is needed to compensate for the phase mismatch due to the free electrons. This means that if we want to obtain high intensity for the high harmonics, we should use a high laser intensity and a high gas pressure. This result is consistent with the generation of water window harmonics using mid-infrared lasers reported recently by Popmintchev et al. Tenico ; Tenico2 , where gas pressure as high as a few atmospheres were used, together with a higher laser intensity.
In Figs. 6(b) and 6(d) we show the harmonic intensities for H15 and H21 at several different lengths of the gas jet (0.5, 1, 2, and 3 mm) using laser intensity of 21014 W/cm2 at focus (for each length, the center of gas jet is always placed at 2 mm after laser focus). Below 20 Torr, the harmonic intensity increases rapidly by increasing the interaction length and gas pressure. When we further increase the pressure to a higher value, on the contrary, the harmonic intensity drops with the medium length. The optimal gas pressure increases with decreasing interaction length, because the absorption length is decreased with increasing gas pressure. The optimized harmonic intensity with a long gas jet is higher than that of a short one. Thus we can obtain a high harmonic intensity using a long gas medium with low gas pressure. These results are very similar to those observed by Tamaki et al. Midorikawa using a 30-fs laser pulse.
III.5 Macroscopic HHG spectra of Ne: Theory vs experiment
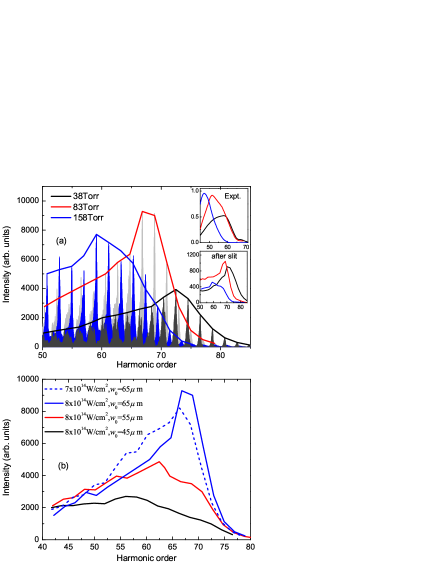
To test how the QRS model works for other atomic targets, we perform a simulation of HHG spectra for Ne reported by Dachraoui et al. Dachraoui09 recently. Figure 7(a) shows the comparison of HHG spectra between theory and experiment. The experiment Dachraoui09 was performed using a laser with pulse duration of 45 fs, central wavelength of 805 nm. The laser focusing position was in the middle of the 3-mm long gas cell and the spot size was estimated to be 110 m (the beam waist at focus was 55 m). The peak vacuum intensity was 1.2(0.4)1015 Wcm2. Three different pressures: 38, 83, and 158 Torr were used. In the simulation the beam waist is 65 m, the laser peak intensity is 81014 Wcm2 (near the critical intensity of Ne, which is 8.51014 Wcm2), the other parameters are the same as those given in the experiment. In Fig. 7(a) simulated spectra at the three pressures are shown, together with the envelope of the calculated spectra. The general trend of the spectra vs gas pressure agrees reasonably with the experiment, see inset. Under present conditions the ionization probability is very high (75% at the end of laser pulse with peak intensity of 81014 Wcm2 according to ADK tunneling model ADK ). The fundamental field is strongly reshaped during the propagation in the medium and has a strong dependence on pressure. By increasing the gas pressure, the harmonic cutoff position shifts to lower orders.
There are still large discrepancies between the experiment and the simulation, especially the cutoff positions. The cutoff positions in the theory are about 10 harmonic orders higher than those in the experiment. In our simulations, we find that many experimental parameters would affect the shape and the cutoff of the spectra significantly. In Fig. 7(b) we show the influence of beam waist and laser intensity on the spectra at a pressure of 83 Torr, the other parameters are fixed as those in Fig. 7(a). We can see that the shape and cutoff position obtained under different conditions are very different. The change of cutoff position for the beam waist from 65 to 45 m is about 10 harmonic orders. A slight change of the laser intensity from 8 to 71014Wcm2 would modify the shape of the HHG spectra drastically. Since many factors mentioned above in the experiment are not well determined, we have not been able to simulate the observed spectra. We also comment that the experimental HHG spectra depend critically on how they are measured JinPRA2011 . For example, if a slit of width of 500 m is placed at 50 cm behind the gas jet, then only harmonics emitted close to the axis will be measured. The second inset in Fig. 7(a) shows how the envelopes of the harmonic spectra at the three pressures are modified. For higher pressure, there are more free electrons generated and thus the fundamental laser is more defocused as the pressure is increased. The inset shows that the relative yield at the higher pressure is reduced, indicating that HHG generated at higher pressure is more divergent.
IV Summary and outlook
In summary, we have used the recently developed quantitative rescattering (QRS) theory for the generation of high-order harmonics of individual atoms with the inclusion of the propagation of the laser and the harmonics in the gas medium to obtain macroscopic HHG spectra that can be compared directly with experimental observations. We have studied the effect of the gas pressure on the yields of the harmonics. The gas pressure affects harmonics through frequency-dependent properties of the medium such as dispersion, absorption, nonlinear Kerr effect, and plasma density, as well as the phase-matching conditions. In the meanwhile, the fundamental laser field is modified as it propagates through the medium. The modification is especially severe when the incident laser reaches the intensity near or above the critical intensity for a given target. From the simulations, we have found that HHG spectra are very sensitive to the laser focusing conditions. By starting with the QRS theory instead of the SFA for the single-atom response, we have been able to obtain HHG spectra that are much closer to experimental observations, but we are still unable to obtain HHG spectra that are in perfect agreement with the data. This is in contrast with our recent positive results JinPRA2011 ; JinJPB ; Jin-CO2 where HHG of atoms and molecules were generated at lower intensities. We have attributed the lack of good agreement to the strong dependence of the HHG spectra on the laser parameters when experiments are carried out at high intensities and that these parameters are difficult to specify accurately in a given experiment. In the future, it is desirable that experiments report HHG spectra taken at various focusing conditions and gas pressures in order to establish if our current theory of HHG is under solid ground in the high-intensity and high-gas-pressure regime. This regime is important in order to generate high-energy harmonics near and above the water window using mid-infrared lasers, as well as the possible generation of few-cycle single attosecond pulses in the soft X-ray region Tenico ; Tenico2 ; light-source .
V Acknowledgments
This work was supported in part by Chemical Sciences, Geosciences and Biosciences Division, Office of Basic Energy Sciences, Office of Science, U.S. Department of Energy. G.-L.W was also supported by the National Natural Science Foundation of China under Grant Nos. 11064013 and 11044007, the Specialized Research Fund for the Doctoral Program of Higher Education of China under Grant No. 20096203110001 and the Foundation of Northwest Normal University under Grant No. NWNU-KJCXGC-03-70.
References
- (1) T. Popmintchev, M.-C. Chen, A. Bahabad, M. Gerrity, P. Sidorenko, O. Cohen, I. P. Christov, M. M. Murnane, and H. C. Kapteyn, Proc. Natl. Acad. Sci. USA 106, 10516 (2009).
- (2) T. Popmintchev, M.-C. Chen, P. Arpin, M. M. Murnane, H. C. Kapteyn, Nature Photon. 4, 822 (2010).
- (3) M.-C. Chen, P. Arpin, T. Popmintchev, M. Gerrity, B. Zhang, M. Seaberg, D. Popmintchev, M. M. Murnane, and H. C. Kapteyn, Phys. Rev. Lett. 105, 173901 (2010).
- (4) M. F. Kling and M. J. J. Vrakking, Annu. Rev. Phys. Chem. 59, 463 (2008).
- (5) F. Krausz and M. Ivanov, Rev. Mod. Phys. 81, 163 (2009).
- (6) C. Jin, H. J. Wörner, V. Tosa, A. T. Le, J. B. Bertrand, R. R. Lucchese, P. B. Corkum, D. M. Villeneuve, and C. D. Lin, J. Phys. B 44, 095601 (2011).
- (7) C. Jin, A. T. Le, and C. D. Lin, Phys. Rev. A 83, 023411 (2011).
- (8) C. Jin, A. T. Le and C. D. Lin, Phys. Rev. A 79, 053413 (2009).
- (9) C. Jin, A. T. Le and C. D. Lin, Phys. Rev. A 83, 053409 (2011).
- (10) T. Morishita, A. T. Le, Z. Chen, and C. D. Lin, Phys. Rev. Lett. 100, 013903 (2008).
- (11) A. T. Le, R. R. Lucchese, S. Tonzani, T. Morishita, and C. D. Lin, Phys. Rev. A 80, 013401 (2009).
- (12) C. D. Lin, A. T. Le, Z. Chen, T. Morishita, and R. R. Lucchese, J. Phys. B 43, 122001 (2010).
- (13) M. Lewenstein, Ph. Balcou, M. Yu. Ivanov, A. L’Huillier, and P. B. Corkum, Phys. Rev. A 49, 2117 (1994).
- (14) C. Altucci, R. Velotta, J. P. Marangos, E. Heesel, E. Springate, M. Pascolini, L. Poletto, P. Villoresi, C. Vozzi, G. Sansone, M. Anscombe, J-P. Caumes, S. Stagira, and M. Nisoli, Phys. Rev. A 71, 013409 (2005).
- (15) S. Minemoto, T. Umegaki, Y. Oguchi, T. Morishita, A. T. Le, S. Watanabe, and H. Sakai, Phys. Rev. A 78, 061402(R) (2008).
- (16) H. Dachraoui, T. Auguste, A. Helmstedt, P. Bartz, M. Michelswirth, N. Mueller, W. Pfeiffer, P Salieres, and U. Heinzmann, J. Phys. B 42, 175402 (2009).
- (17) M. V. Ammosov, N. B. Delone, and V. P. Krainov, Zh. Eksp. Teor. Fiz. 91, 2008 (1986) [Sov. Phys. JETP 64, 1191 (1986)].
- (18) X. M. Tong and C. D. Lin, J. Phys. B 38, 2593 (2005).
- (19) H. G. Muller, Phys. Rev. A 60, 1341 (1999).
- (20) H-C. Bandulet, D. Comtois, A. D. Shiner, C. Trallero-Herrero, N. Kajumba, T. Ozaki, P. B. Corkum, D. M. Villeneuve, J-C. Kieffer, and F. Légaré, J. Phys. B 41, 245602 (2008).
- (21) M. Nisoli, E. Priori, G. Sansone, S. Stagira, G. Cerullo,S. De Silvestri, C. Altucci, R. Bruzzese, C. de Lisio, P. Villoresi, L. Poletto, M. Pascolini, and G. Tondello, Phys. Rev. Lett. 88, 033902 (2002).
- (22) C. Altucci, R. Bruzzese, C. de Lisio, M. Nisoli, E. Priori, S. Stagira, M. Pascolini, L. Poletto, P. Villoresi, V. Tosa, and K. Midorikawa, Phys. Rev. A 68, 033806 (2003).
- (23) H. J. Wörner, H. Niikura, J. B. Bertrand, P. B. Corkum, and D. M. Villeneuve, Phys. Rev. Lett. 102, 103901 (2009).
- (24) P. Colosimo et al., Nat. Phys. 4, 386 (2008).
- (25) J. P. Farrell, L. S. Spector, B. K. McFarland, P. H. Bucksbaum, M. Gühr, M. B. Gaarde, and K. J. Schafer, Phys. Rev. A 83, 023420 (2011).
- (26) C. Jin, A. T. Le, C. A. Trallero-Herrero, and C. D. Lin, e-print arXiv:1107.3609.
- (27) Y. H. Zheng, Z. N. Zeng, H. Xiong, R. X. Li, Z. Z. Xu, Y. Peng, X. Yang, and H. P. Zeng, Appl. Phys. Lett. 95, 141102 (2009).
- (28) T. Brabec and F. Krausz, Rev. Mod. Phys. 72, 545 (2000).
- (29) M. Schnürer, Z. Cheng, M. Hentschel, G. Tempea, P. Kálmán, T. Brabec, and F. Krausz. Phys. Rev. Lett. 83, 722 (1999).
- (30) M. Schnürer, Z. Cheng, M. Hentschel, F. Krausz, T. Wilhein, D. Hambach, G. Schmahl, M. Drescher, Y. Lim, U. Heinzmann, Appl. Phys. B 70 [Suppl.], S227 (2000).
- (31) C. Altucci, T. Starczewski, E. Mevel, and C.-G. Wahlström, J. Opt. Soc. Am. B 13, 148 (1996).
- (32) A. Rundquist, C. G. Durfee III, Z. Chang, C. Herne, S. Backus, M. M. Murnane, and H. C. Kapteyn, Science 280, 1412 (1998).
- (33) C. G. Durfee, A. R. Rundquist, S. Backus, C. Herne, M. M. Murnane, and H. C. Kapteyn, Phys. Rev. Lett. 83 2187 (1999).
- (34) X. H. Xie, Z. N. Zeng, R. X. Li, S. Chen, H. H. Lu, D. J. Yin, and Z. Z. Xu, Science in China Ser. G Physics, Mechanics & Astronom 47, 492 (2004).
- (35) E. Constant, D. Garzella, P. Breger, E. Mével, Ch. Dorrer, C. Le Blanc, F. Salin, and P. Agostini, Phys. Rev. Lett. 82, 1668 (1999).
- (36) C. T. Chantler, K. Olsen, R. A. Dragoset, J. Chang, A. R. Kishore, S. A. Kotochigova, and D. S. Zucker, X-ray Form Factor, Attenuation and Scattering Tables (version 2.1) (National Institute of Standards and Technology, Gaithersburg, MD, 2005) [http://physics.nist.gov/ffast].
- (37) B. L. Henke, E. M. Gullikson, and J. C. Davis, At. Data Nucl. Data Tables 54, 181 (1993), available from:http://henke.lbl.gov/optical_constants/.
- (38) J. A. R. Samson and W. C. Stolte, J. Electron Spectrosc. Relat. Phenom. 123, 265 (2002).
- (39) Y. Tamaki, J. Itatani, M. Obara, and K. Midorikawa, Phys. Rev. A 62, 063802 (2000).